Chapter 6 Performance Measurement (How to Count Results): AI Impressions and Full-Journey Value · IDAEO: Marketing in the Age of AI
Performance Measurement (How to Count Results): AI Impressions and Full-Journey Value
This chapter answersWhat results do AI impressions, AI Content Use, and site visits each represent?
Why it comes hereOnly by matching each step's value with its statistical basis can you read the numbers as marketing results.
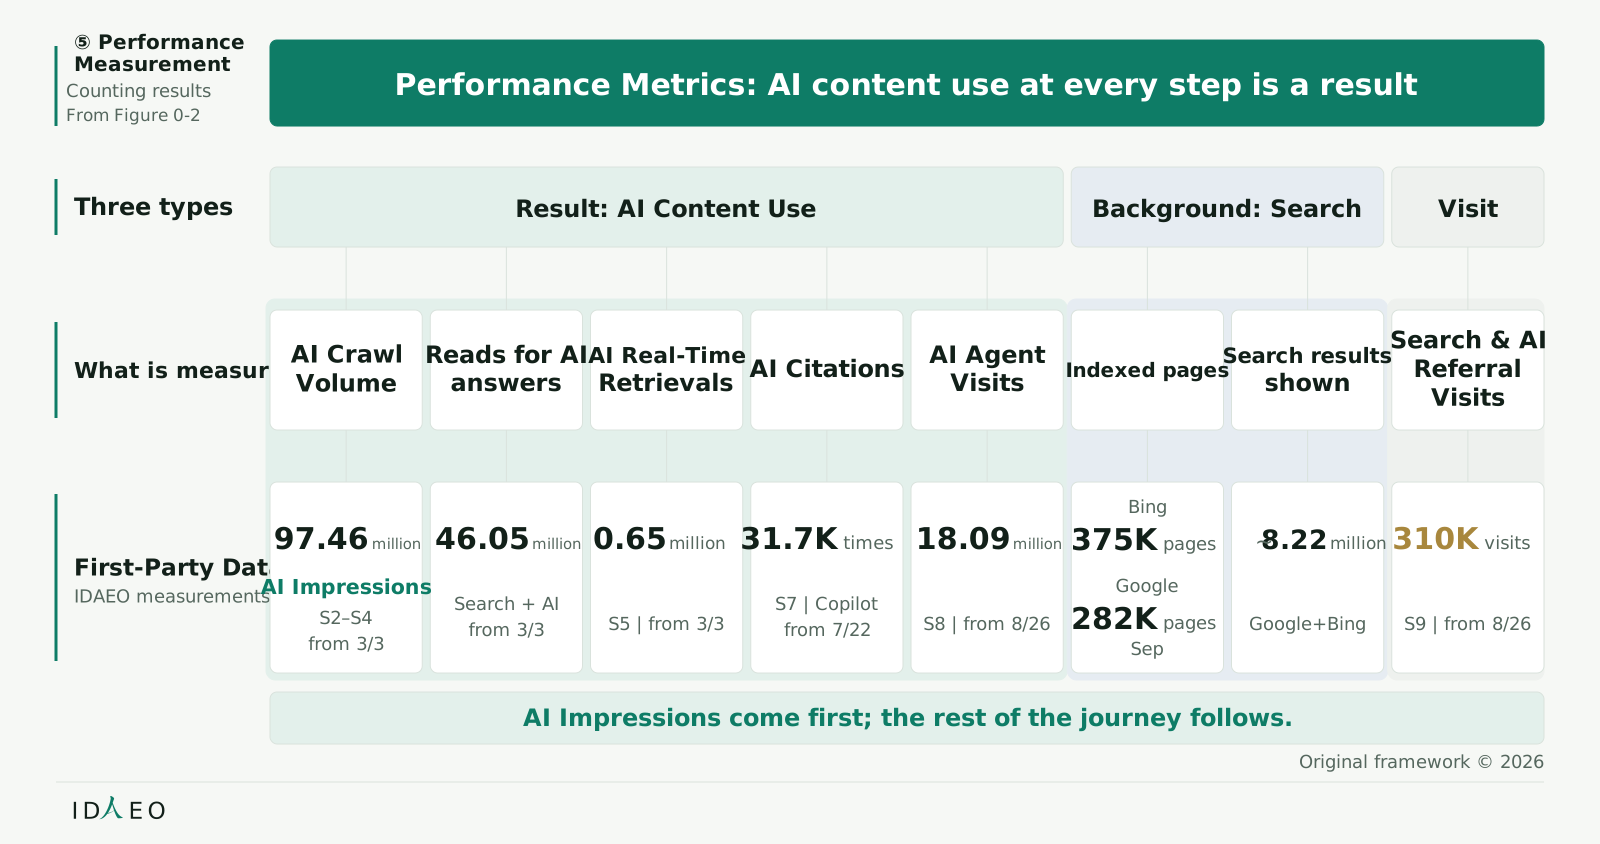
Figure 6-1 Full-Journey Performance Dashboard: Eight Measured Figures and First-Party Data
Each cell lists AI results by step; the bottom row is IDAEO First-Party Data (as of Oct 8, 2026; indexed page counts are for September). The marketing meaning of AI Crawl Volume is AI Impressions. “Reads for AI Answers,” AI Crawl Volume, and AI Real-Time Retrievals cover overlapping ranges; each cell is listed separately by source and unit (requests, times, pages, clicks), and is suited to comparison on the same basis.
View as text
Read down: Performance Metrics, the three categories, measurement targets, and figures; each cell is one kind of result.
⑤ PerformanceMeasurement
Counting results
Performance Metrics: AI content use at every step is a result
Three types
Result: AI Content Use
Background: Search
Visit
What is measured
AI CrawlVolume
Reads for AI
answers
AI Real-Time
Retrievals
AI Citations
AI Agent
Visits
Indexed pages
Search results
shown
Search & AIReferralVisits
First-Party Data
IDAEO measurements
97.46
million
S2–S4
from 3/3
46.05
million
Search + AI
from 3/3
0.65
million
S5 | from 3/3
31.7K
times
S7 | Copilot
from 7/22
18.09
million
S8 | from 8/26
Bing
pages
Google
pages
8.22
million
Google+Bing
310K
visits
S9 | from 8/26
Original framework © 2026
ID
EO
From Figure 0-2
AI Impressions come first; the rest of the journey follows.
AI Impressions
375K
282K
Sep
~
How to readRead down: Performance Metrics, the three categories, measurement targets, and figures; each cell is one kind of result.
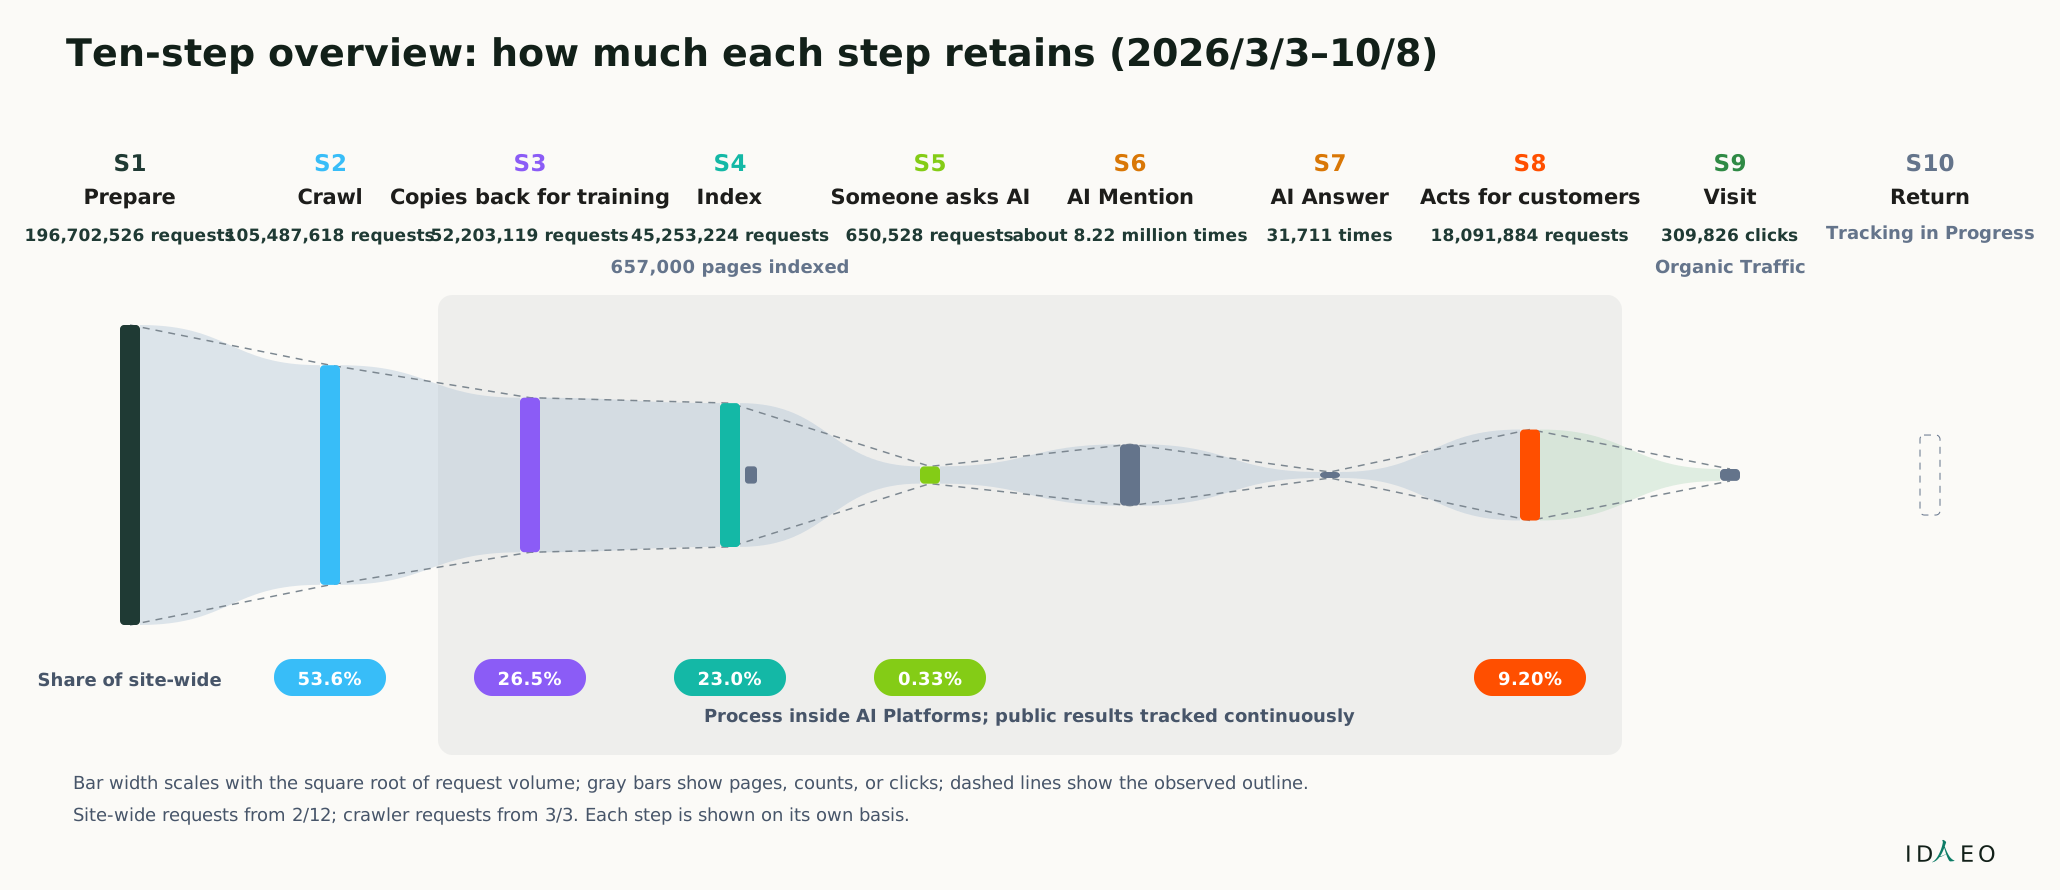
Figure 6-2 Ten-Step Results Overview
View as text
Read the ten steps from left to right; the thicker the bar, the larger the volume. The gray area is inside the AI Platforms, and measured results keep accumulating. S6 in the figure is search impressions (not AI mentions): the number of times search results list you. The mention rate in AI answers will be published later.
Ten-step overview: how much each step retains (2026/3/3–10/8)
Process inside AI Platforms; public results tracked continuously
S1
Prepare
196,702,526 requests
S2
Crawl
105,487,618 requests
S3
Copies back for training
52,203,119 requests
S4
Index
45,253,224 requests
657,000 pages indexed
S5
Someone asks AI
650,528 requests
S6
AI Mention
about 8.22 million times
S7
AI Answer
31,711 times
S8
Acts for customers
18,091,884 requests
S9
Visit
309,826 clicks
Organic Traffic
S10
Return
Tracking in Progress
Share of site-wide
53.6%
26.5%
23.0%
0.33%
9.20%
Bar width scales with the square root of request volume; gray bars show pages, counts, or clicks; dashed lines show the observed outline.
Site-wide requests from 2/12; crawler requests from 3/3. Each step is shown on its own basis.
ID
EO
| Item | Value | Unit |
|---|---|---|
| Prepare | 196,702,526 | requests |
| Crawl | 105,487,618 | requests |
| Copies back for training | 52,203,119 | requests |
| Index | 45,253,224 | requests |
| pages indexed | 657,000 | pages |
| Someone asks AI | 650,528 | requests |
| AI Mention | about 8.22 million | times |
| AI Answer | 31,711 | times |
| Acts for customers | 18,091,884 | requests |
| Visit | 309,826 | clicks |
How to readRead the ten steps from left to right; the thicker the bar, the larger the volume. The gray area is inside the AI Platforms, and measured results keep accumulating. S6 in the figure is search impressions (not AI mentions): the number of times search results list you. The mention rate in AI answers will be published later.
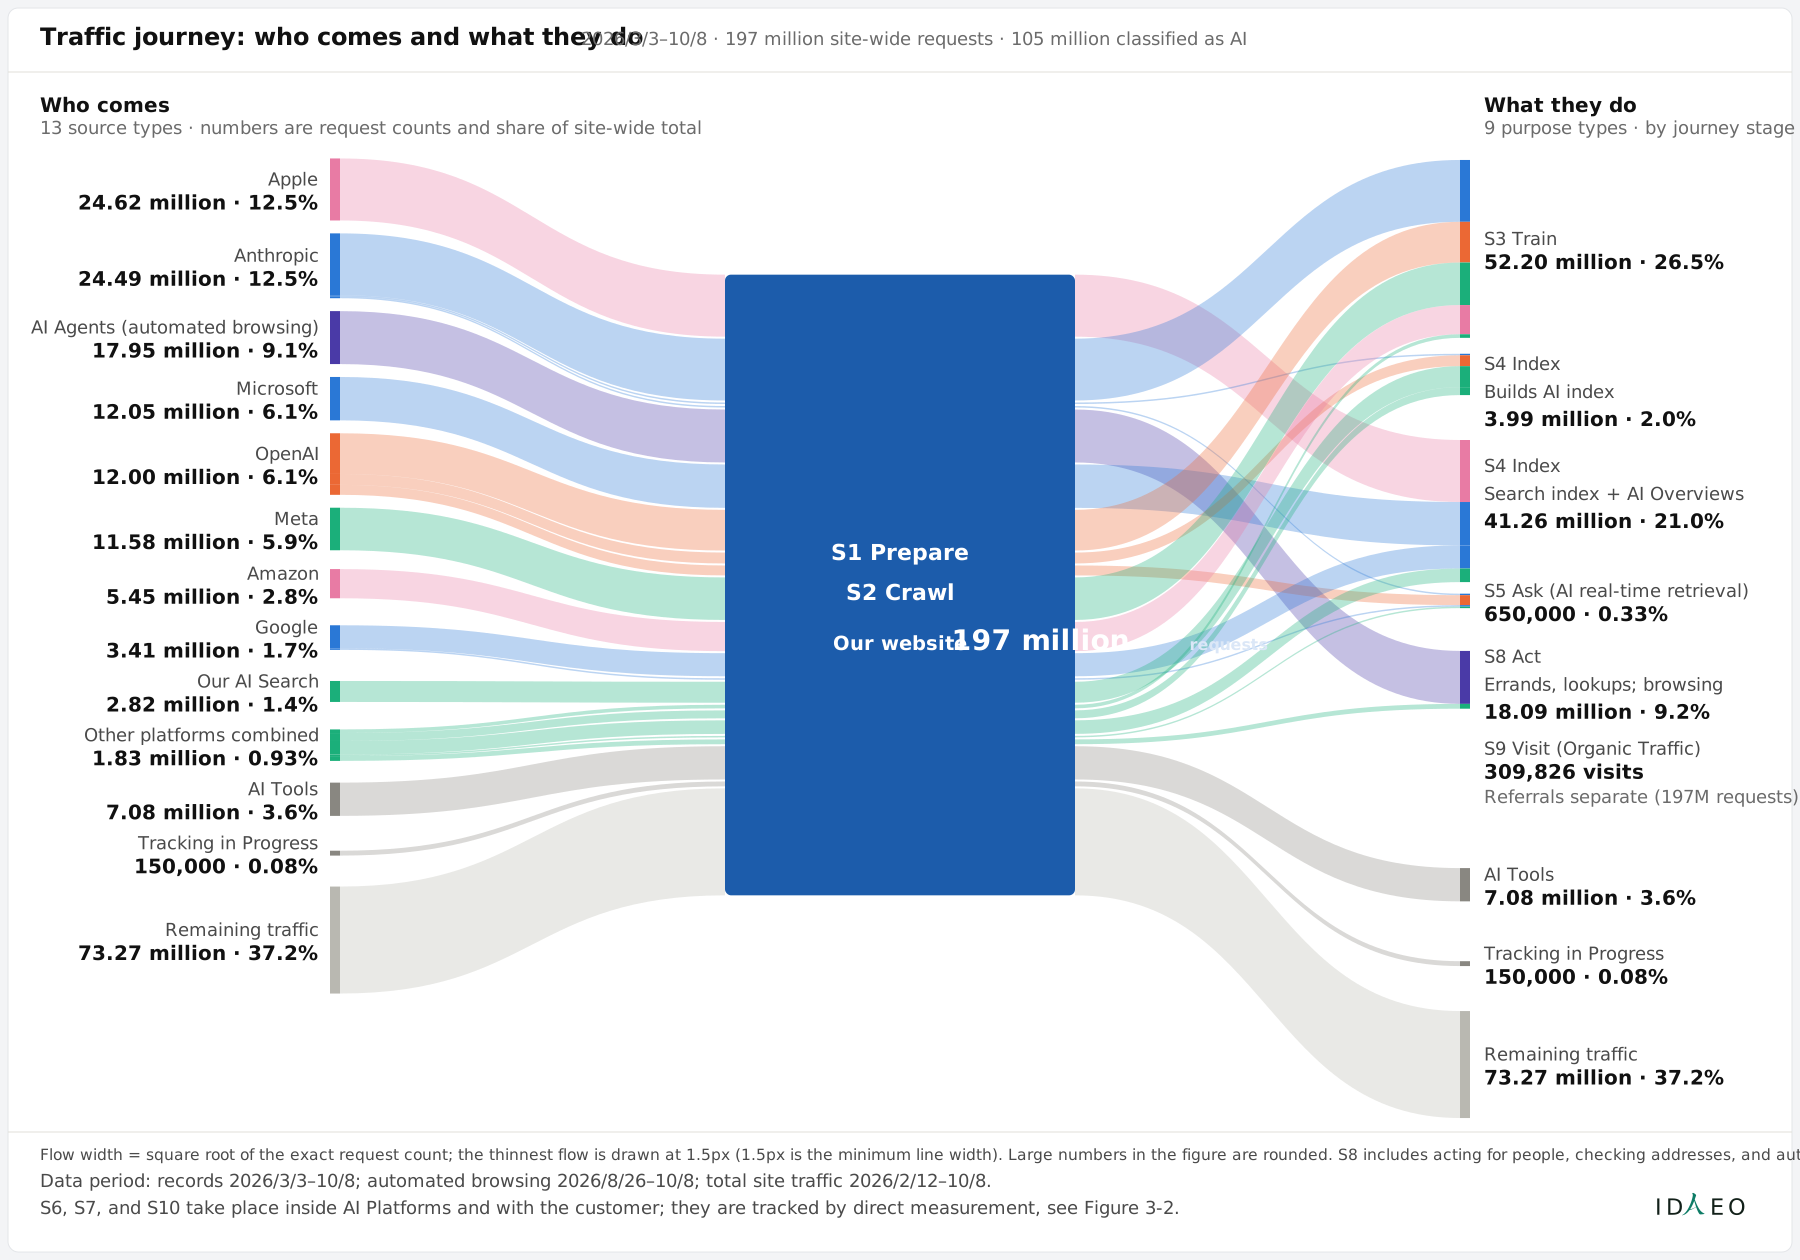
Figure 6-3 AI Visit Structure Map: Who Comes and What They Come to Do
Extended figures: Figure 6-3, “AI Visit Structure Map,” shows who comes and what they come to do; Figure 6-4, “Full-Journey Outcomes Flow Map,” lays out arrivals, indexing, display, citations, and visits along S1–S10.
View as text
Follow the bands: Marketing Audiences on the left, functions on the right; the thicker the band, the larger the volume.
Traffic journey: who comes and what they do
2026/3/3–10/8 · 197 million site-wide requests · 105 million classified as AI
Who comes
13 source types · numbers are request counts and share of site-wide total
What they do
9 purpose types · by journey stage
S1 Prepare
S2 Crawl
Our website 197 million requests
Apple
24.62 million · 12.5%
Anthropic
24.49 million · 12.5%
AI Agents (automated browsing)
17.95 million · 9.1%
Microsoft
12.05 million · 6.1%
OpenAI
12.00 million · 6.1%
Meta
11.58 million · 5.9%
Amazon
5.45 million · 2.8%
Google
3.41 million · 1.7%
Our AI Search
2.82 million · 1.4%
Other platforms combined
1.83 million · 0.93%
AI Tools
7.08 million · 3.6%
Tracking in Progress
150,000 · 0.08%
Remaining traffic
73.27 million · 37.2%
S3 Train
52.20 million · 26.5%
S4 Index
Builds AI index
3.99 million · 2.0%
S4 Index
Search index + AI Overviews
41.26 million · 21.0%
S5 Ask (AI real-time retrieval)
650,000 · 0.33%
S8 Act
Errands, lookups; browsing
18.09 million · 9.2%
S9 Visit (Organic Traffic)
309,826 visits
Referrals separate (197M requests)
AI Tools
7.08 million · 3.6%
Tracking in Progress
150,000 · 0.08%
Remaining traffic
73.27 million · 37.2%
Flow width = square root of the exact request count; the thinnest flow is drawn at 1.5px (1.5px is the minimum line width). Large numbers in the figure are rounded. S8 includes acting for people, checking addresses, and automated browsing.
Data period: records 2026/3/3–10/8; automated browsing 2026/8/26–10/8; total site traffic 2026/2/12–10/8.
S6, S7, and S10 take place inside AI Platforms and with the customer; they are tracked by direct measurement, see Figure 3-2.
ID
EO
| Item | Value |
|---|---|
| Apple | 24.62 million · 12.5% |
| Anthropic | 24.49 million · 12.5% |
| AI Agents (automated browsing) | 17.95 million · 9.1% |
| Microsoft | 12.05 million · 6.1% |
| OpenAI | 12.00 million · 6.1% |
| Meta | 11.58 million · 5.9% |
| Amazon | 5.45 million · 2.8% |
| 3.41 million · 1.7% | |
| Our AI Search | 2.82 million · 1.4% |
| Other platforms combined | 1.83 million · 0.93% |
| AI Tools | 7.08 million · 3.6% |
| Tracking in Progress | 150,000 · 0.08% |
| Remaining traffic | 73.27 million · 37.2% |
| S3 Train | 52.20 million · 26.5% |
| Builds AI index | 3.99 million · 2.0% |
| Search index + AI Overviews | 41.26 million · 21.0% |
| S5 Ask (AI real-time retrieval) | 650,000 · 0.33% |
| S8 Act | 18.09 million · 9.2% |
| S9 Visit (Organic Traffic) | 309,826 visits |
How to readFollow the bands: Marketing Audiences on the left, functions on the right; the thicker the band, the larger the volume.
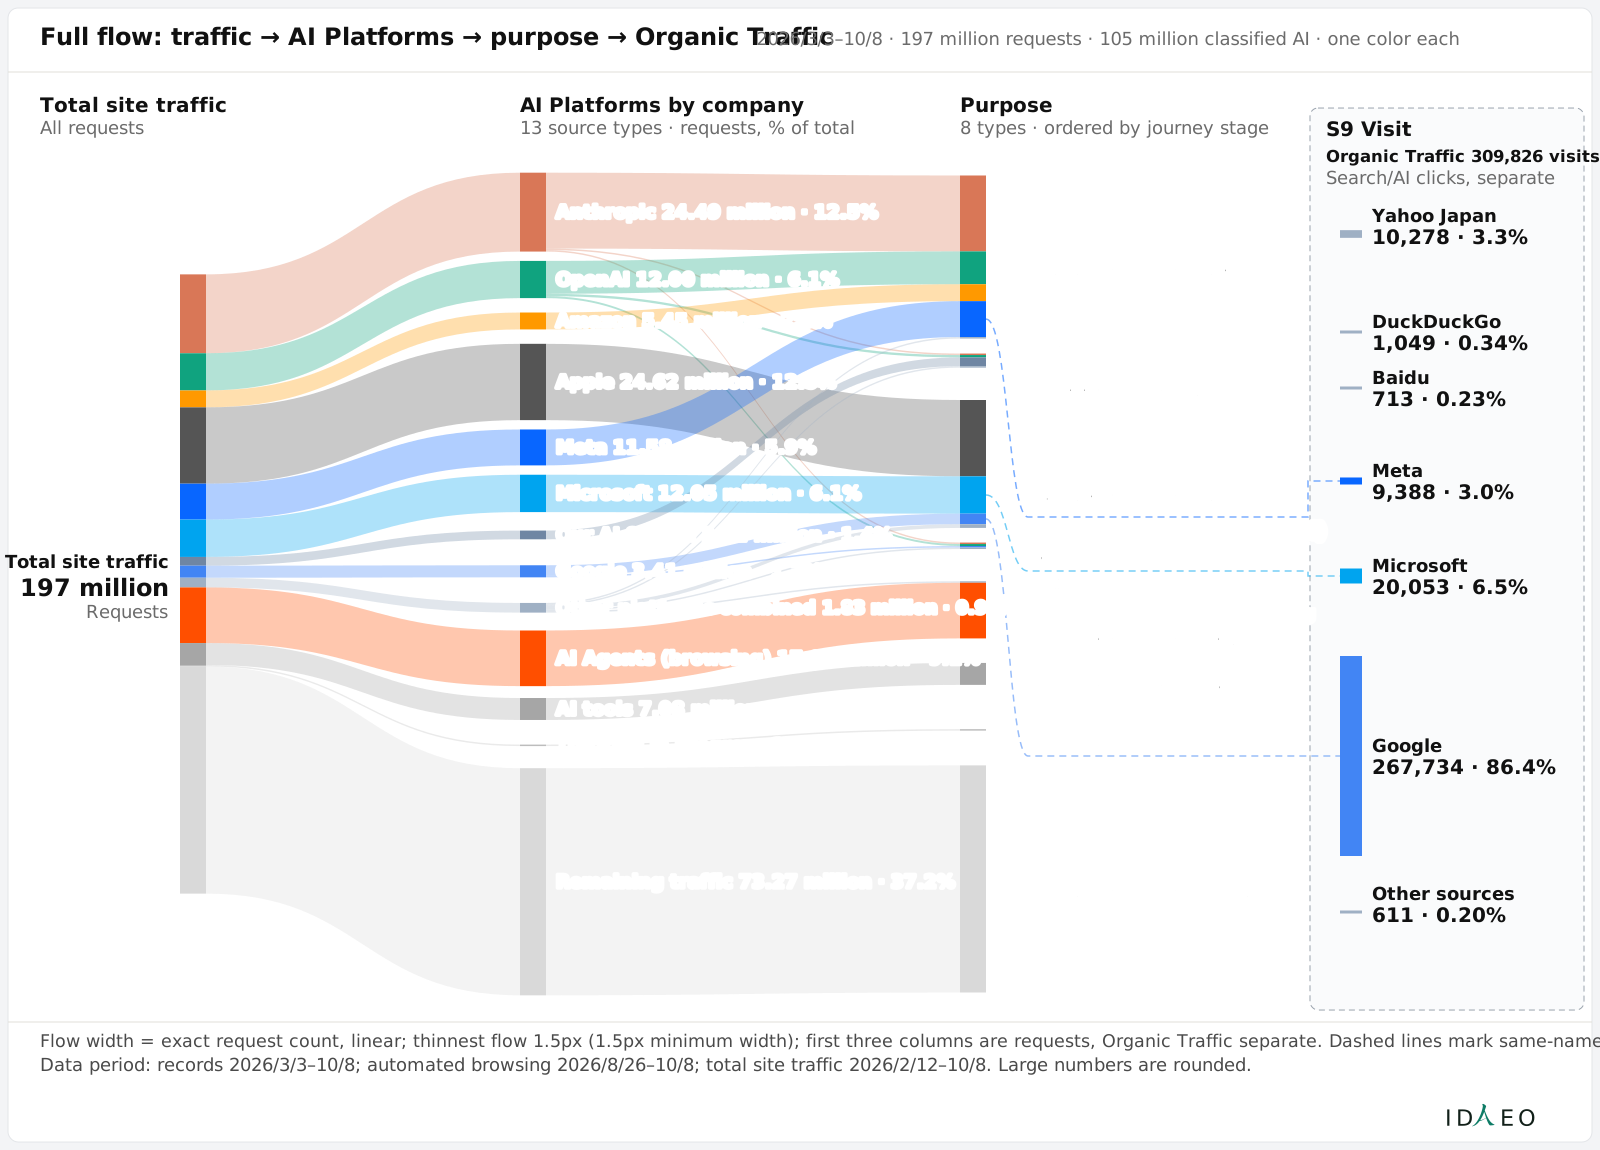
Figure 6-4 Full-Journey Outcomes Flow Map: From AI Exposure to Customer Visits
View as text
Read from left to right: total site traffic → each AI platform → purpose → Organic Traffic; the thicker the band, the larger the volume, and purposes are ordered by journey step.
Full flow: traffic → AI Platforms → purpose → Organic Traffic
2026/3/3–10/8 · 197 million requests · 105 million classified AI · one color each
Total site traffic
All requests
AI Platforms by company
13 source types · requests, % of total
Purpose
8 types · ordered by journey stage
Total site traffic
197 million
Requests
Anthropic 24.49 million · 12.5%
OpenAI 12.00 million · 6.1%
Amazon 5.45 million · 2.8%
Apple 24.62 million · 12.5%
Meta 11.58 million · 5.9%
Microsoft 12.05 million · 6.1%
Our AI Search 2.82 million · 1.4%
Google 3.41 million · 1.7%
Other platforms combined 1.83 million · 0.93%
AI Agents (browsing) 17.95 million · 9.1%
AI tools 7.08 million · 3.6%
Tracking in Progress 150,000 · 0.08%
Remaining traffic 73.27 million · 37.2%
S3 Train
52.20 million · 26.5%
S4 Index
Builds AI index
3.99 million · 2.0%
S4 Index
Search index + AIO
41.26 million · 21.0%
S5 Ask (AI real-time retrieval)
650,000 · 0.33%
S8 Act
Errands, lookups; browsing
18.09 million · 9.2%
AI Tools
7.08 million · 3.6%
Tracking in Progress
150,000 · 0.08%
Remaining traffic
73.27 million · 37.2%
S9 Visit
Organic Traffic 309,826 visits
Search/AI clicks, separate
Yahoo Japan
10,278 · 3.3%
DuckDuckGo
1,049 · 0.34%
Baidu
713 · 0.23%
Meta
9,388 · 3.0%
Microsoft
20,053 · 6.5%
Google
267,734 · 86.4%
Other sources
611 · 0.20%
Flow width = exact request count, linear; thinnest flow 1.5px (1.5px minimum width); first three columns are requests, Organic Traffic separate. Dashed lines mark same-name AI Platforms.
Data period: records 2026/3/3–10/8; automated browsing 2026/8/26–10/8; total site traffic 2026/2/12–10/8. Large numbers are rounded.
ID
EO
| Item | Value |
|---|---|
| Anthropic | 24.49 million · 12.5% |
| OpenAI | 12.00 million · 6.1% |
| Amazon | 5.45 million · 2.8% |
| Apple | 24.62 million · 12.5% |
| Meta | 11.58 million · 5.9% |
| Microsoft | 12.05 million · 6.1% |
| Our AI Search | 2.82 million · 1.4% |
| 3.41 million · 1.7% | |
| Other platforms combined | 1.83 million · 0.93% |
| AI Agents (browsing) | 17.95 million · 9.1% |
| AI tools | 7.08 million · 3.6% |
| Tracking in Progress | 150,000 · 0.08% |
| Remaining traffic | 73.27 million · 37.2% |
| S3 Train | 52.20 million · 26.5% |
| Builds AI index | 3.99 million · 2.0% |
| Search index + AIO | 41.26 million · 21.0% |
| S5 Ask (AI real-time retrieval) | 650,000 · 0.33% |
| S8 Act | 18.09 million · 9.2% |
| Organic Traffic | 309,826 visits |
| Yahoo Japan | 10,278 · 3.3% |
| DuckDuckGo | 1,049 · 0.34% |
| Baidu | 713 · 0.23% |
| Meta | 9,388 · 3.0% |
| Microsoft | 20,053 · 6.5% |
| 267,734 · 86.4% | |
| Other sources | 611 · 0.20% |
How to readRead from left to right: total site traffic → each AI platform → purpose → Organic Traffic; the thicker the band, the larger the volume, and purposes are ordered by journey step.
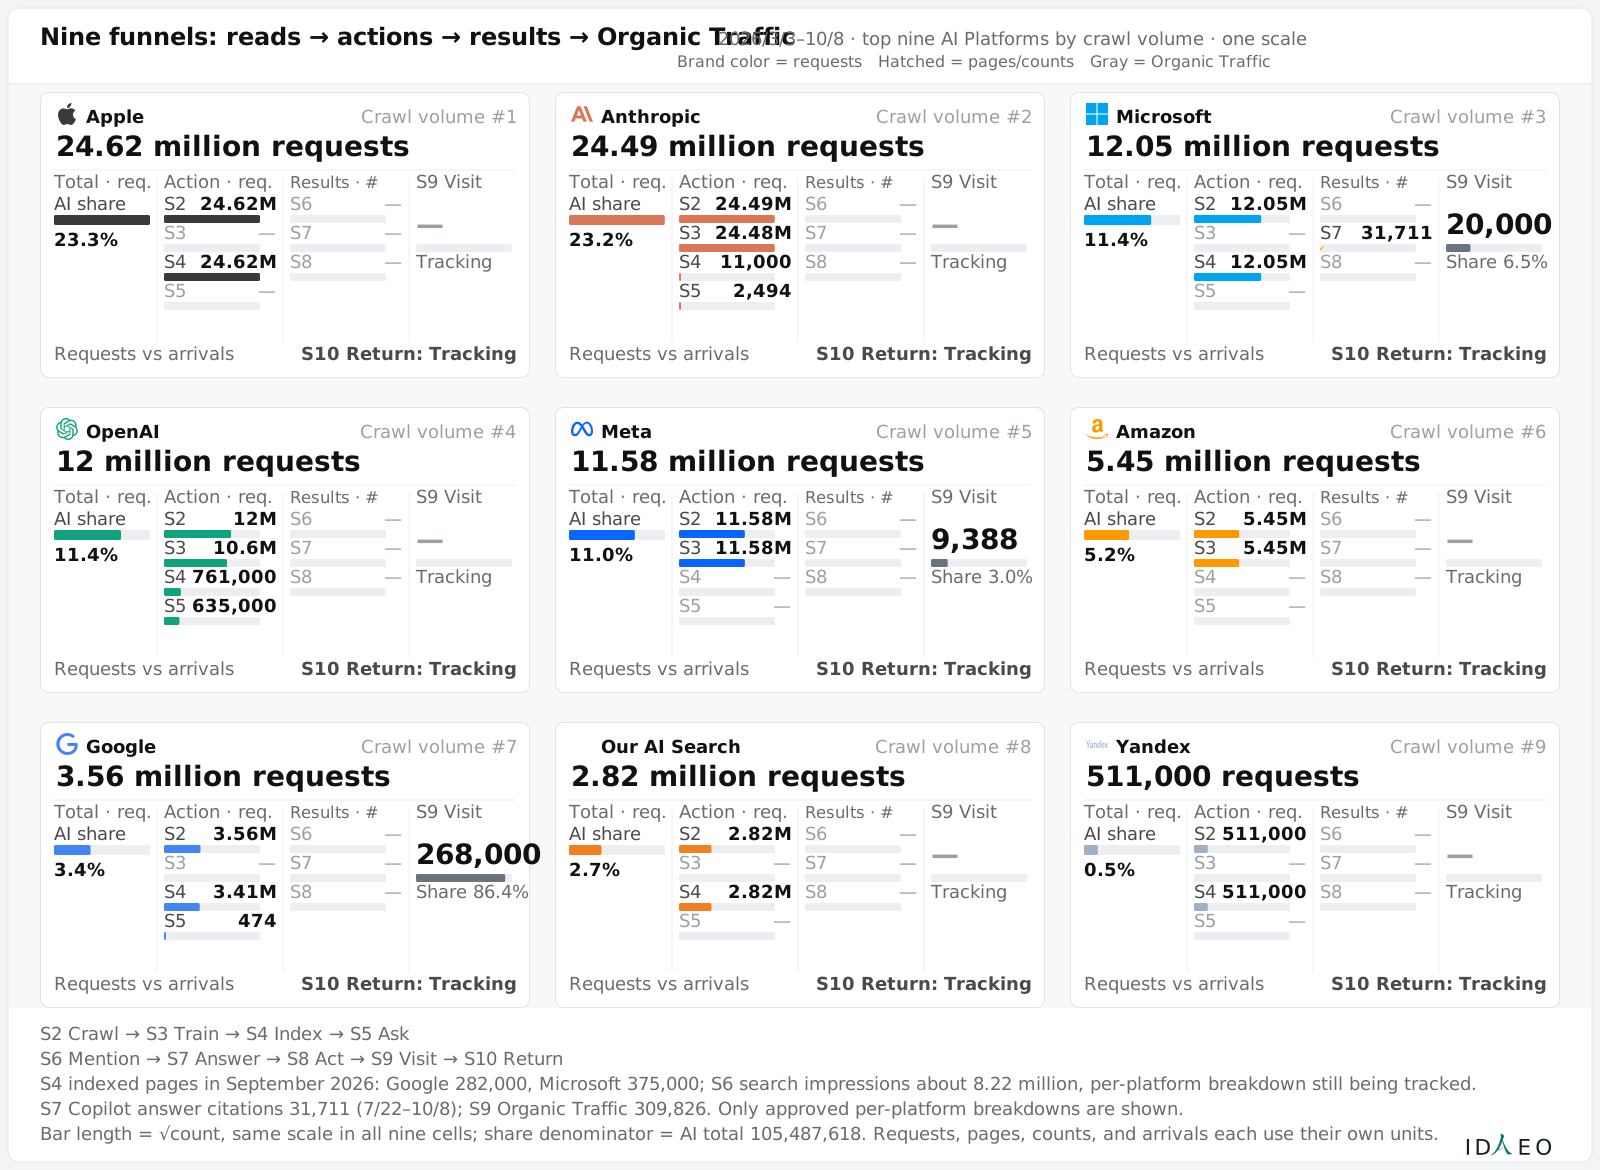
Figure 6-5 Journey Results Comparison of Nine AI Platforms
View as text
One platform per panel; read each step's results from left to right. Compare across panels using the same column and the same unit.
Nine funnels: reads → actions → results → Organic Traffic
2026/3/3–10/8 · top nine AI Platforms by crawl volume · one scale
Brand color = requests Hatched = pages/counts Gray = Organic Traffic
Apple
Crawl volume #1
24.62 million requests
Total · req.
Action · req.
Results · #
S9 Visit
AI share
23.3%
S2
24.62M
S3
—
S4
24.62M
S5
—
S6
—
S7
—
S8
—
—
Tracking
Requests vs arrivals
S10 Return: Tracking
Anthropic
Crawl volume #2
24.49 million requests
Total · req.
Action · req.
Results · #
S9 Visit
AI share
23.2%
S2
24.49M
S3
24.48M
S4
11,000
S5
2,494
S6
—
S7
—
S8
—
—
Tracking
Requests vs arrivals
S10 Return: Tracking
Microsoft
Crawl volume #3
12.05 million requests
Total · req.
Action · req.
Results · #
S9 Visit
AI share
11.4%
S2
12.05M
S3
—
S4
12.05M
S5
—
S6
—
S7
31,711
S8
—
20,000
Share 6.5%
Requests vs arrivals
S10 Return: Tracking
OpenAI
Crawl volume #4
12 million requests
Total · req.
Action · req.
Results · #
S9 Visit
AI share
11.4%
S2
12M
S3
10.6M
S4
761,000
S5
635,000
S6
—
S7
—
S8
—
—
Tracking
Requests vs arrivals
S10 Return: Tracking
Meta
Crawl volume #5
11.58 million requests
Total · req.
Action · req.
Results · #
S9 Visit
AI share
11.0%
S2
11.58M
S3
11.58M
S4
—
S5
—
S6
—
S7
—
S8
—
9,388
Share 3.0%
Requests vs arrivals
S10 Return: Tracking
Amazon
Crawl volume #6
5.45 million requests
Total · req.
Action · req.
Results · #
S9 Visit
AI share
5.2%
S2
5.45M
S3
5.45M
S4
—
S5
—
S6
—
S7
—
S8
—
—
Tracking
Requests vs arrivals
S10 Return: Tracking
Google
Crawl volume #7
3.56 million requests
Total · req.
Action · req.
Results · #
S9 Visit
AI share
3.4%
S2
3.56M
S3
—
S4
3.41M
S5
474
S6
—
S7
—
S8
—
268,000
Share 86.4%
Requests vs arrivals
S10 Return: Tracking
Our AI Search
Crawl volume #8
2.82 million requests
Total · req.
Action · req.
Results · #
S9 Visit
AI share
2.7%
S2
2.82M
S3
—
S4
2.82M
S5
—
S6
—
S7
—
S8
—
—
Tracking
Requests vs arrivals
S10 Return: Tracking
Yandex
Crawl volume #9
511,000 requests
Total · req.
Action · req.
Results · #
S9 Visit
AI share
0.5%
S2
511,000
S3
—
S4
511,000
S5
—
S6
—
S7
—
S8
—
—
Tracking
Requests vs arrivals
S10 Return: Tracking
S2 Crawl → S3 Train → S4 Index → S5 Ask
S6 Mention → S7 Answer → S8 Act → S9 Visit → S10 Return
S4 indexed pages in September 2026: Google 282,000, Microsoft 375,000; S6 search impressions about 8.22 million, per-platform breakdown still being tracked.
S7 Copilot answer citations 31,711 (7/22–10/8); S9 Organic Traffic 309,826. Only approved per-platform breakdowns are shown.
Bar length = √count, same scale in all nine cells; share denominator = AI total 105,487,618. Requests, pages, counts, and arrivals each use their own units.
ID
EO
| Item | Total · req. | S3 | S4 | S5 | S7 | S9 Visit | AI share |
|---|---|---|---|---|---|---|---|
| Apple | 24.62 million requests | — | 24.62M | — | — | — | 23.3% |
| Anthropic | 24.49 million | 24.48M | 11,000 | 2,494 | — | — | 23.2% |
| Microsoft | 12.05 million | — | 12.05M | — | 31,711 | 20,000 | 11.4% |
| OpenAI | 12 million | 10.6M | 761,000 | 635,000 | — | — | 11.4% |
| Meta | 11.58 million | 11.58M | — | — | — | 9,388 | 11.0% |
| Amazon | 5.45 million | 5.45M | — | — | — | — | 5.2% |
| 3.56 million | — | 3.41M | 474 | — | 268,000 | 3.4% | |
| Our AI Search | 2.82 million | — | 2.82M | — | — | — | 2.7% |
| Yandex | 511,000 | — | 511,000 | — | — | — | 0.5% |
How to readOne platform per panel; read each step's results from left to right. Compare across panels using the same column and the same unit.
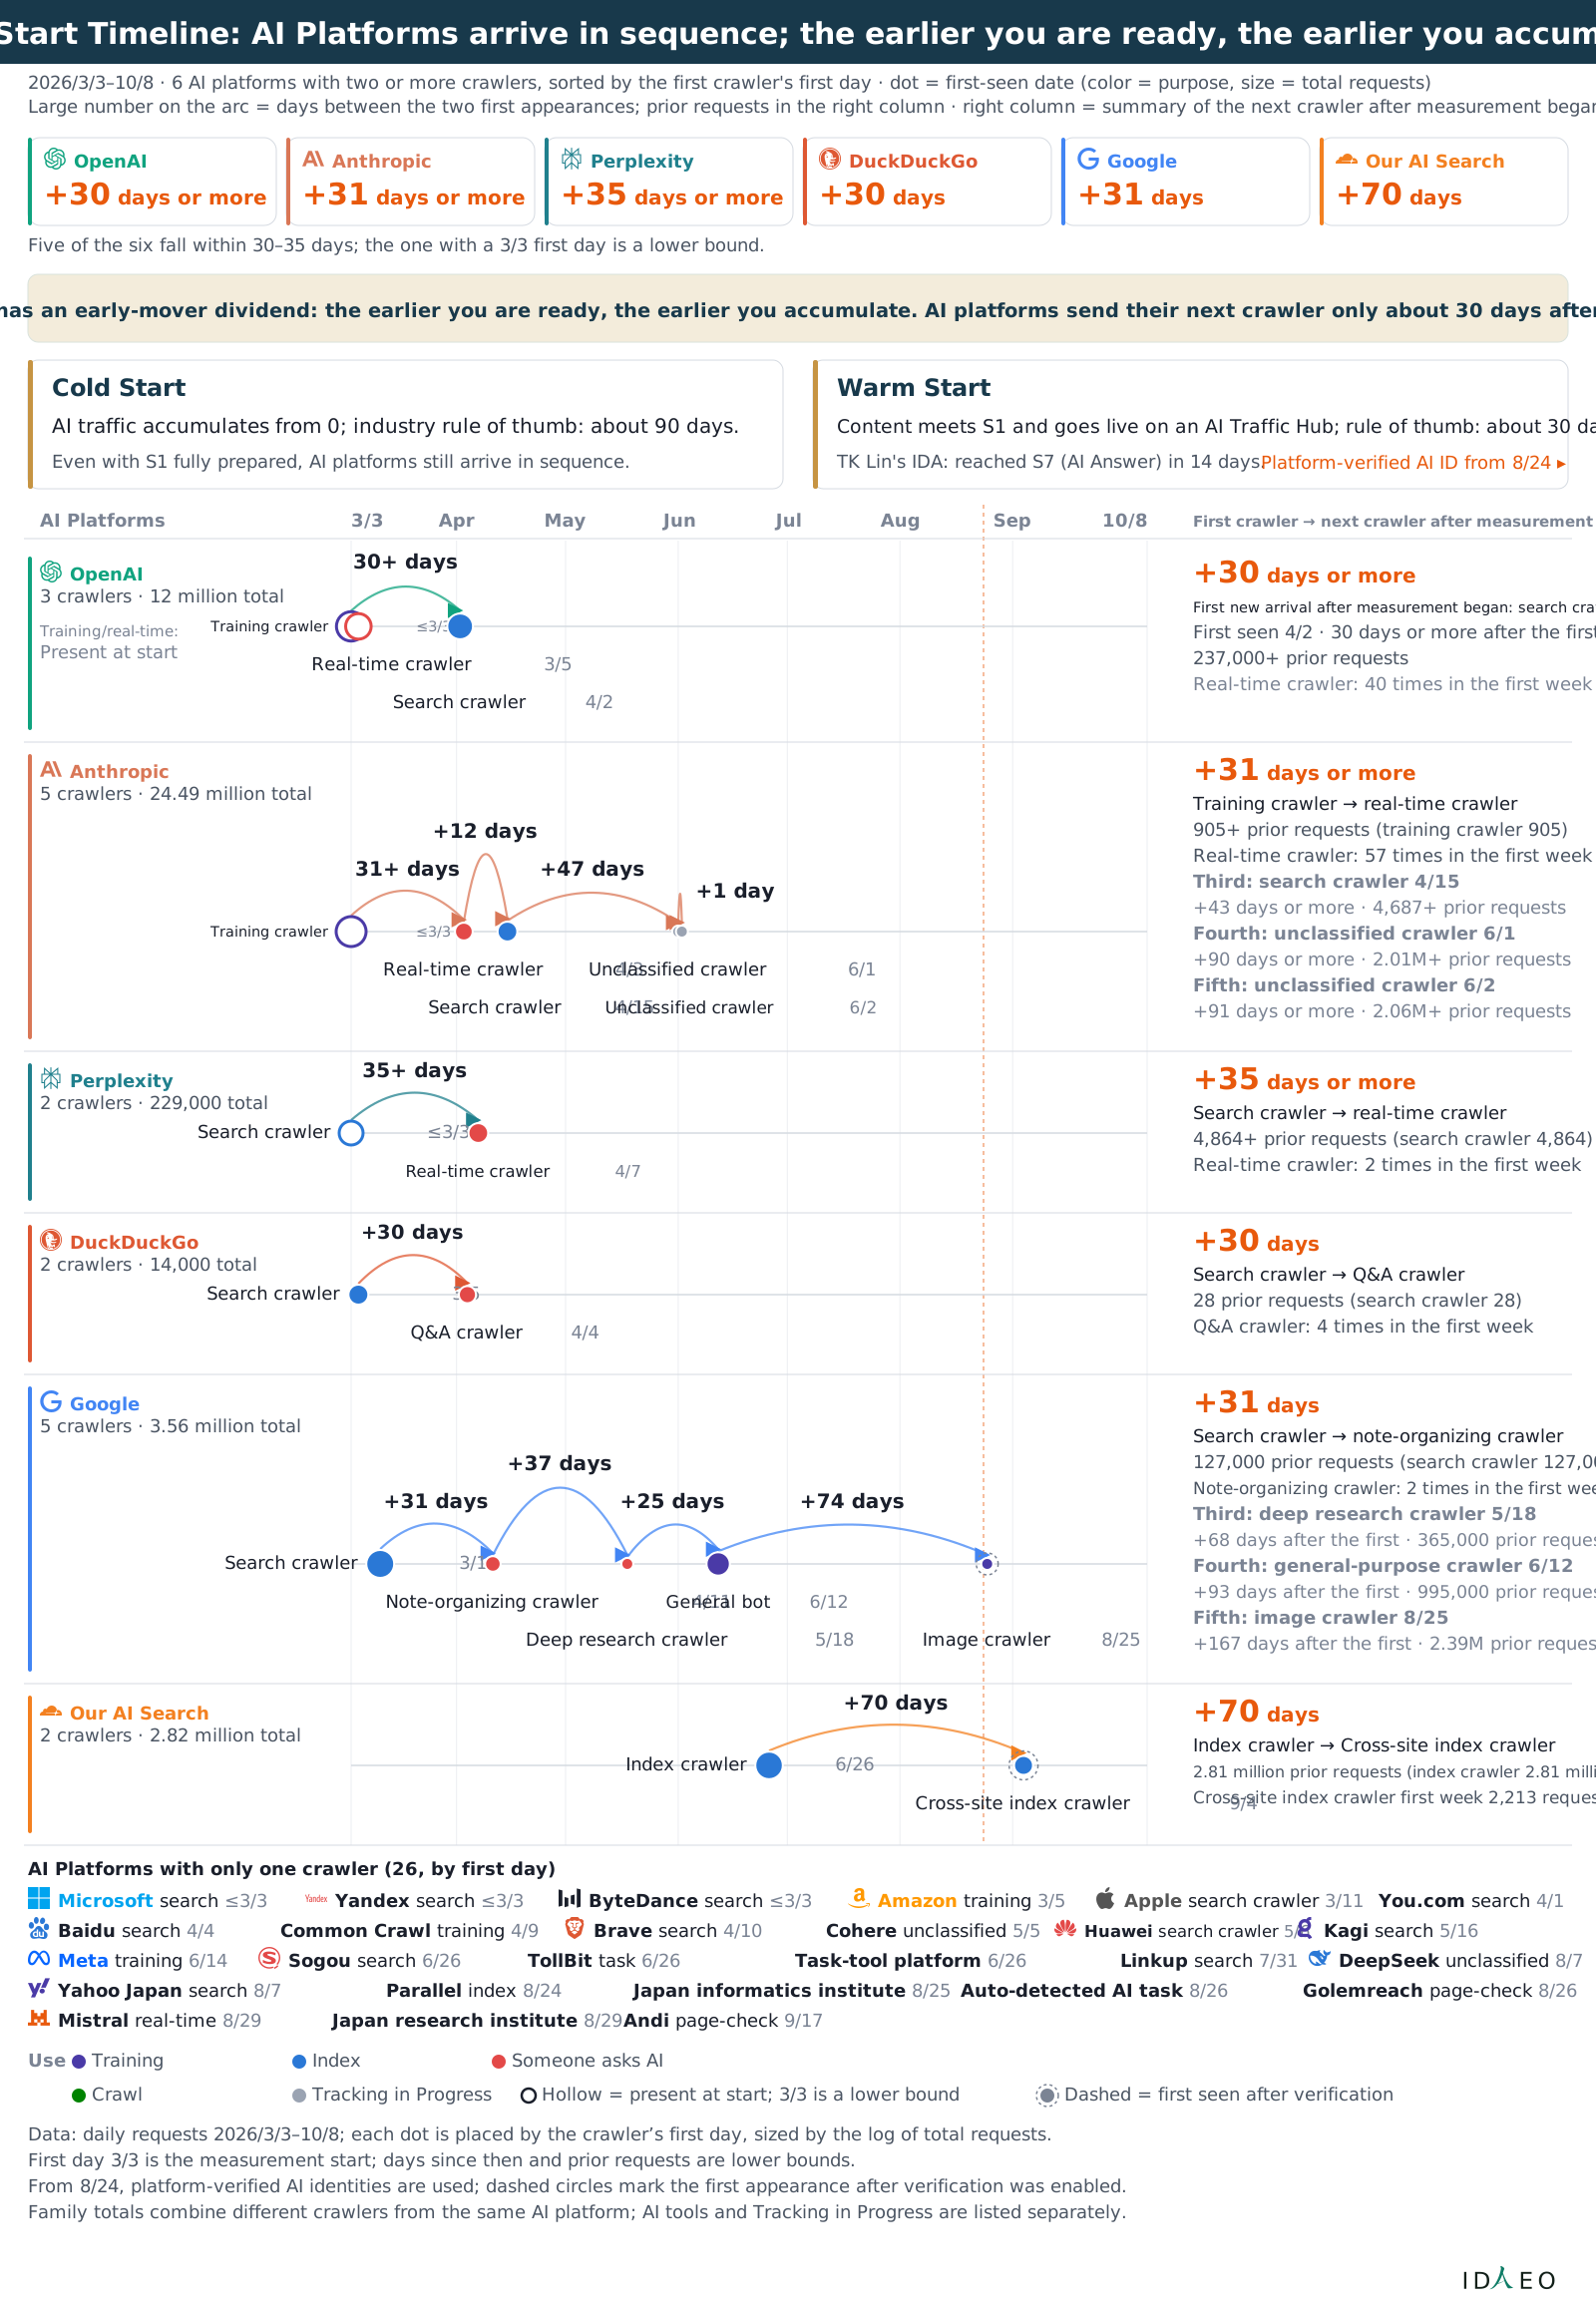
Figure 6-6 Cold Start Timeline: AI Platforms Arriving in Sequence and the Early-Mover Dividend
View as text
Each row is one of the AI Platforms, with time on the horizontal axis. The 30–35 days is the gap between the first crawler and the next from the same platform. This is an observation from a single site; for three platforms, the interval is a lower bound. Figure 7-1, “IDAEO Growth Milestones,” shows this site's cumulative volume. Records before Aug 24 may include duplicate requests. Arrival records are still needed to assess whether earlier readiness leads to earlier accumulation.
Cold Start Timeline: AI Platforms arrive in sequence; the earlier you are ready, the earlier you accumulate
2026/3/3–10/8 · 6 AI platforms with two or more crawlers, sorted by the first crawler's first day · dot = first-seen date (color = purpose, size = total requests)
Large number on the arc = days between the two first appearances; prior requests in the right column · right column = summary of the next crawler after measurement began
OpenAI
+30 days or more
Anthropic
+31 days or more
Perplexity
+35 days or more
DuckDuckGo
+30 days
Google
+31 days
Our AI Search
+70 days
Five of the six fall within 30–35 days; the one with a 3/3 first day is a lower bound.
AI traffic has an early-mover dividend: the earlier you are ready, the earlier you accumulate. AI platforms send their next crawler only about 30 days after the first.
Cold Start
AI traffic accumulates from 0; industry rule of thumb: about 90 days.
Even with S1 fully prepared, AI platforms still arrive in sequence.
Warm Start
Content meets S1 and goes live on an AI Traffic Hub; rule of thumb: about 30 days.
TK Lin's IDA: reached S7 (AI Answer) in 14 days.
AI Platforms
First crawler → next crawler after measurement began
3/3
Apr
May
Jun
Jul
Aug
Sep
10/8
Platform-verified AI ID from 8/24 ▸
OpenAI
3 crawlers · 12 million total
Training/real-time:
Present at start
30+ days
Training crawler ≤3/3
Real-time crawler 3/5
Search crawler 4/2
+30 days or more
First new arrival after measurement began: search crawler
First seen 4/2 · 30 days or more after the first
237,000+ prior requests
Real-time crawler: 40 times in the first week
Anthropic
5 crawlers · 24.49 million total
31+ days
+12 days
+47 days
+1 day
Training crawler ≤3/3
Real-time crawler 4/3
Search crawler 4/15
Unclassified crawler 6/1
Unclassified crawler 6/2
+31 days or more
Training crawler → real-time crawler
905+ prior requests (training crawler 905)
Real-time crawler: 57 times in the first week
Third: search crawler 4/15
+43 days or more · 4,687+ prior requests
Fourth: unclassified crawler 6/1
+90 days or more · 2.01M+ prior requests
Fifth: unclassified crawler 6/2
+91 days or more · 2.06M+ prior requests
Perplexity
2 crawlers · 229,000 total
35+ days
Search crawler ≤3/3
Real-time crawler 4/7
+35 days or more
Search crawler → real-time crawler
4,864+ prior requests (search crawler 4,864)
Real-time crawler: 2 times in the first week
DuckDuckGo
2 crawlers · 14,000 total
+30 days
Search crawler 3/5
Q&A crawler 4/4
+30 days
Search crawler → Q&A crawler
28 prior requests (search crawler 28)
Q&A crawler: 4 times in the first week
Google
5 crawlers · 3.56 million total
+31 days
+37 days
+25 days
+74 days
Search crawler 3/11
Note-organizing crawler 4/11
Deep research crawler 5/18
General bot 6/12
Image crawler 8/25
+31 days
Search crawler → note-organizing crawler
127,000 prior requests (search crawler 127,000)
Note-organizing crawler: 2 times in the first week
Third: deep research crawler 5/18
+68 days after the first · 365,000 prior requests
Fourth: general-purpose crawler 6/12
+93 days after the first · 995,000 prior requests
Fifth: image crawler 8/25
+167 days after the first · 2.39M prior requests
Our AI Search
2 crawlers · 2.82 million total
+70 days
Index crawler 6/26
Cross-site index crawler 9/4
+70 days
Index crawler → Cross-site index crawler
2.81 million prior requests (index crawler 2.81 million)
Cross-site index crawler first week 2,213 requests
AI Platforms with only one crawler (26, by first day)
Microsoft search ≤3/3
Yandex search ≤3/3
ByteDance search ≤3/3
Amazon training 3/5
Apple search crawler 3/11
You.com search 4/1
Baidu search 4/4
Common Crawl training 4/9
Brave search 4/10
Cohere unclassified 5/5
Huawei search crawler 5/6
Kagi search 5/16
Meta training 6/14
Sogou search 6/26
TollBit task 6/26
Task-tool platform 6/26
Linkup search 7/31
DeepSeek unclassified 8/7
Yahoo Japan search 8/7
Parallel index 8/24
Japan informatics institute 8/25
Auto-detected AI task 8/26
Golemreach page-check 8/26
Mistral real-time 8/29
Japan research institute 8/29
Andi page-check 9/17
Use
Training
Index
Someone asks AI
Crawl
Tracking in Progress
Hollow = present at start; 3/3 is a lower bound
Dashed = first seen after verification
Data: daily requests 2026/3/3–10/8; each dot is placed by the crawler’s first day, sized by the log of total requests.
First day 3/3 is the measurement start; days since then and prior requests are lower bounds.
From 8/24, platform-verified AI identities are used; dashed circles mark the first appearance after verification was enabled.
Family totals combine different crawlers from the same AI platform; AI tools and Tracking in Progress are listed separately.
ID
EO
How to readEach row is one of the AI Platforms, with time on the horizontal axis. The 30–35 days is the gap between the first crawler and the next from the same platform. This is an observation from a single site; for three platforms, the interval is a lower bound. Figure 7-1, “IDAEO Growth Milestones,” shows this site's cumulative volume. Records before Aug 24 may include duplicate requests. Arrival records are still needed to assess whether earlier readiness leads to earlier accumulation.
Key Points of This Chapter
| Claim | Why |
|---|---|
| AI Content Use at every stage counts as a result. Results at each stage must be assessed separately; an earlier stage cannot stand in for a later one. | S1–S8 and website visits each reflect different kinds of progress. More reads do not mean more citations or customer actions. Totals from live tests of industry websites: 37,793 Copilot citations from April to September. Bing search clicks totaled 10,177. Both figures come from Microsoft, but their units and reporting periods differ. They should be interpreted separately. |
| An AI Crawl Volume of 97.46 million is what this book calls AI Impressions. This includes reads by search engines for indexing. | Each time AI or a search engine reads your content, this book counts it as one AI impression. This reflects the number of reads. It does not mean the content has been used for training, indexed, mentioned, or cited. This is exposure to AI, not how many people saw it. |
| Reads for AI Answers, 46.05 million, include reads for search indexing and AI answers. | These reads are grouped by purposes related to search and AI answers. This classification does not mean the content has appeared in search results or AI answers. |
| AI Real-Time Retrievals, 650,000, are content use triggered by immediate demand. | AI fetches information on the spot in response to a question; this metric reflects customers' immediate needs. |
| The IDAEO platform's 31,700 AI Citations mean its content was listed as a source in answers. | This is Copilot's citation result for the IDAEO platform since Jul 22. Being listed as a source does not mean customers have made decisions based on the content. |
| AI Agent Visits, 18.09 million, represent the volume of site arrivals. Whether actions were completed on customers' behalf still depends on subsequent results. | AI Agents have begun visiting sites, and their visit volume remains under tracking. Of this, automated browsing accounts for 17.95 million (counted from Aug 26), and named AI Agents for 144,000. Visit volume shows the scale of contact, while task outcomes are read from subsequent actions. |
| Search & AI Referral Visits, 310,000 (search and AI combined; Google 268,000), represent customers arriving at the site via search or AI. | This metric corresponds to S9, linking upstream AI Content Use with customer action. |
| Cold Start: AI traffic accumulates from 0; the industry rule of thumb is about 90 days. | A new website has to wait for AI Platforms to find it one by one. With S1 ready, arriving crawlers have content to read. Figure 7-1, “IDAEO Growth Milestones,” records this site's request volume: 53 requests on the first day, Mar 3 → 635,000 in March → 16.07 million in June → 35.99 million requests in August. Records before Aug 24 may include duplicate requests. September was lower than August; check that counting methods are consistent before comparing months. |
| Warm Start: content meets S1 and goes live on an AI Traffic Hub. The rule of thumb is about 30 days, not a deadline for crawler arrival. A separate Cold Start observation from a single site found a gap of 30–35 days before the next crawler from the same platform (Figure 6-6). For three platforms, this is a lower bound and cannot be used to estimate Warm Start timing. TK Lin's personal IDA case reached S7 (Answer) in 14 days. | Content published on the hub is available for existing crawlers to read. Whether it gets used sooner still requires separate evidence from the records. TK Lin's personal IDA, measured: on launch day, Sep 20, AI citations were 0. On Oct 3, a live test covered 100 questions across five AI models. This IDA appeared in AI search source lists for 84% of answers (four of the five models used the same search interface; the questions named the author himself; a single case). It appeared more often than any other source. |
| The necessary condition for an AI Traffic Hub is accumulating ten million or more AI requests per month. | Existing request volume reflects the scale of reads on the platform. The IDAEO platform (idaeo.ai) is an AI Traffic Hub. The IDAEO platform: 25.97 million in July, 35.99 million in August, 15.79 million in September. September was lower than August. Records before Aug 24 may include duplicate requests; check that counting methods are consistent before comparing months. These are monthly platform totals and cannot predict when new content will be read. |
| The early-mover dividend in AI traffic means preparing information early so arriving crawlers can read it. | When a merchant has its information ready in advance, AI Platforms have content to read when they arrive. Figure 6-6, “Cold Start Timeline,” records arrivals at this site. For five of the six AI Platforms, the gap between the first crawler and the next was 30–35 days. For three platforms, this is a lower bound. It cannot be generalized into an arrival pattern for all websites. If a site goes live early but no crawlers read it, there is no evidence of earlier accumulation. |
| Compounding Lead is currently a hypothesis: whether accumulating AI impressions can widen a lead remains to be verified. | Reads for training or indexing do not mean the content has been used for training or indexed. The cumulative volume in Figure 7-1, “IDAEO Growth Milestones”: 635,000 by the end of March → 21.4 million by the end of June → 99.15 million by the end of September → 105.5 million cumulative as of Oct 8 (including AI, search engines, and Automated Bots; these are platform-site volumes and cannot be compared directly with a single merchant's website). Records before Aug 24 may include duplicate requests. This is the site's cumulative record; it does not prove that its lead has widened. Testing Compounding Lead requires comparing comparable subjects using the same counting method. If content use does not increase and the gap does not widen, the hypothesis is not supported. |
Cold Start and Warm Start
| Cold Start | Warm Start | |
|---|---|---|
| Starting point | AI traffic accumulates from 0. | Content plugs into the existing traffic of an AI Traffic Hub. |
| Prerequisites | S1 data is complete, so AI that arrives can get the content. | Content meets S1; the hub accumulates tens of millions of AI requests every month. |
| How long | Industry rule of thumb: about 90 days. | Rule of thumb: about 30 days; TK Lin’s personal case reached S7 in 14 days. |
| Measured results | Mar 3, day one: 53 requests → 635,000 cumulative by end of March → 21.4 million by end of June → 99.15 million by end of September. Figures before Aug 24 may include duplicate requests. | TK Lin’s personal IDA: launched Sep 20; tested on Oct 3. This IDA appeared in AI search source lists for 84% of answers (a single case). |
| What merchants do | Get S1 ready and go live as early as possible; keep accumulating AI impressions. | Publish content that meets S1 on an AI Traffic Hub. |
| Effect of time | Whether launching earlier can widen the lead remains to be tested. | The hub's existing crawlers can read the content. Actual results still need to be observed. |
Terms
- AI Content Use
- Use of content in AI reading, answer citations, and acting on customers' behalf.
- AI Crawl Volume
- S2–S4 are the steps in which AI and search engines obtain content. They cover crawls for training, AI indexing, and search indexing, totaling 97.46 million. These count only as reads for training or indexing. They do not mean the content has been used in training or indexed. There are also 650,000 real-time retrievals, 144,000 reads by named AI Agents, and 7.23 million by Automated Bots. Together, these total 105.5 million reads by AI, search engines, and Automated Bots. Figures before Aug 24 may include duplicate requests.
- AI Impressions
- Each time AI or a search engine reads your content is one AI impression; AI Impressions are the marketing meaning of AI Crawl Volume. This is exposure to AI—each time AI reads you counts as one, not how many people saw it.
- Reads for AI Answers
- The number of reads that serve search results and AI answers.
- Cold Start
- AI traffic accumulates from 0; the industry rule of thumb is about 90 days.
- Warm Start
- Content meets S1 and goes live on an AI Traffic Hub. Rule of thumb: about 30 days; TK Lin's personal IDA case reached S7 (Answer) in 14 days.
- AI Traffic Hub
- A platform that already has a large volume of AI requests; content connects to existing AI traffic as soon as it goes live. Necessary condition: ten million or more AI requests accumulated per month. The IDAEO platform (idaeo.ai) is an AI Traffic Hub.
- Search & AI Referral Visits
- This book measures it as the number of times customers click through to the website via search or AI.
- Compounding Lead
- Compounding Lead. The hypothesis that accumulated AI impressions may increase subsequent content use and widen the lead. Testing it requires consistent measurement and comparable subjects. An increase in cumulative volume alone does not prove that the lead has widened.
FAQ
Q: What is the difference between the 52.2 million reads crawled for training and real-time retrievals?
A: Training reads are reads for training. They do not mean the content has been used in training. Real-time retrievals respond to a customer's question at that moment. Their triggers and uses differ, so they should be interpreted separately.
Q: Does 97.46 million mean more than ninety million people saw it?
A: The 97.46 million is this book's AI Impressions figure. The unit is reads, counting the number of times AI and search engines read the content. A read means a machine has retrieved the content. It does not mean the content has been used in training, indexed, mentioned, or cited. This is exposure to AI, not a count of people who saw it.
Q: Why are reads for search and for AI answers counted together?
A: “Reads for AI Answers” totals the reads for use in search results and AI answers. It shows the volume of reads, not whether the content has been used in an answer. Compare it with answer citations and customer visits to assess each downstream result separately.
Q: What do the IDAEO platform's AI Citations of 31,700 mean?
A: These are citations of the IDAEO platform by Copilot since Jul 22. Figures from other platforms will be published later. Each platform discloses figures for its own scope and period, so citation volume has to be read together with its source.
Q: How long does a new website wait for AI?
A: The rule of thumb for a Warm Start is about 30 days; the industry rule of thumb for a Cold Start is about 90 days. These estimates are not deadlines for crawler arrivals. A separate single-site Cold Start observation found intervals of 30–35 days before the next crawler from the same AI platform arrived. The figures for three platforms are lower bounds and cannot be used to estimate Warm Start timing. TK Lin's personal IDA case reached S7 in 14 days. It went live on Sep 20 and was tested on Oct 3 across 100 questions and five AI models. The day count includes both the launch date and the test date. This IDA appeared in AI search source lists for 84% of answers; this is a single case. A Cold Start accumulates from 0, waiting for AI platforms to arrive one after another. A Warm Start puts content live on an AI Traffic Hub, where existing crawlers can read it. Actual arrival times still need to be observed.
Q: What kind of platform counts as an AI Traffic Hub?
A: The necessary condition listed in this book is ten million or more AI requests accumulated per month. The IDAEO platform (idaeo.ai) is an AI Traffic Hub. The IDAEO platform: 25.97 million in July, 35.99 million in August, 15.79 million in September. September was lower than August. Figures before Aug 24 may include duplicate requests, so comparisons across months require checking the counting methods. These are platform-wide monthly totals and cannot directly predict when crawlers will reach new content.
Q: How do you keep performance assessment close to business results?
A: Look at impressions, mentions, trusted answers, and S9 Visit together, and watch for returns. Goodhart's Law in Figure 8-2 “IDAEO Theoretical Foundations Map” states that once a single metric becomes the target, it gets distorted; only by cross-referencing multiple results do you get a complete judgment.
Q: What can a merchant do first during a Cold Start?
A: Get S1 ready first and go live as early as possible, so visiting AI can read the content. Whether reads increase subsequent content use remains to be seen; Compounding Lead is currently a hypothesis. You can also put the prepared content live on an AI Traffic Hub for existing crawlers to read. See Figure 7-1 for cumulative volume. The total includes AI, search engines, and Automated Bots. Figures before Aug 24 may include duplicate requests. This is a platform site's cumulative record and cannot be compared directly with a single merchant's website.
This Chapter in Three Sentences
- Reads, citations, and customer visits are outcomes at different stages.
- Before comparing figures, align the subjects, periods, and units.
- A Cold Start and a Warm Start have different starting points. Timelines from individual cases are not guarantees.
Three Things You Can Do This Week
- Check that your website's information is complete. Fill in any gaps and publish the updates.
- Label your performance records with their sources, periods, and units.
- Organize records of reads, answer citations, customer visits, and return visits separately.
Next ChapterThe next chapter presents records from the IDAEO site and early field-test merchants. It also explains how to understand what the statistics cover.
Self-CheckWhich journey steps do the eight measured figures in Figure 6-1 “Full-Journey Performance Dashboard” correspond to? Explain the marketing meaning of AI Impressions, AI Citations, and Search & AI Referral Visits; compare the starting point, prerequisites, and time required for a Cold Start and a Warm Start, and explain why AI Agent Visits are tracked.
Free to download, updated monthly

Cite this book
IDAEO: Marketing in the Age of AI · 林毅祥(TK Lin) · 1st edition, 9th revision · · https://km.idaeo.ai/idaeo/textbook?lang=en · CC BY 4.0