IDAEOKnowledge Basekm.idaeo.ai

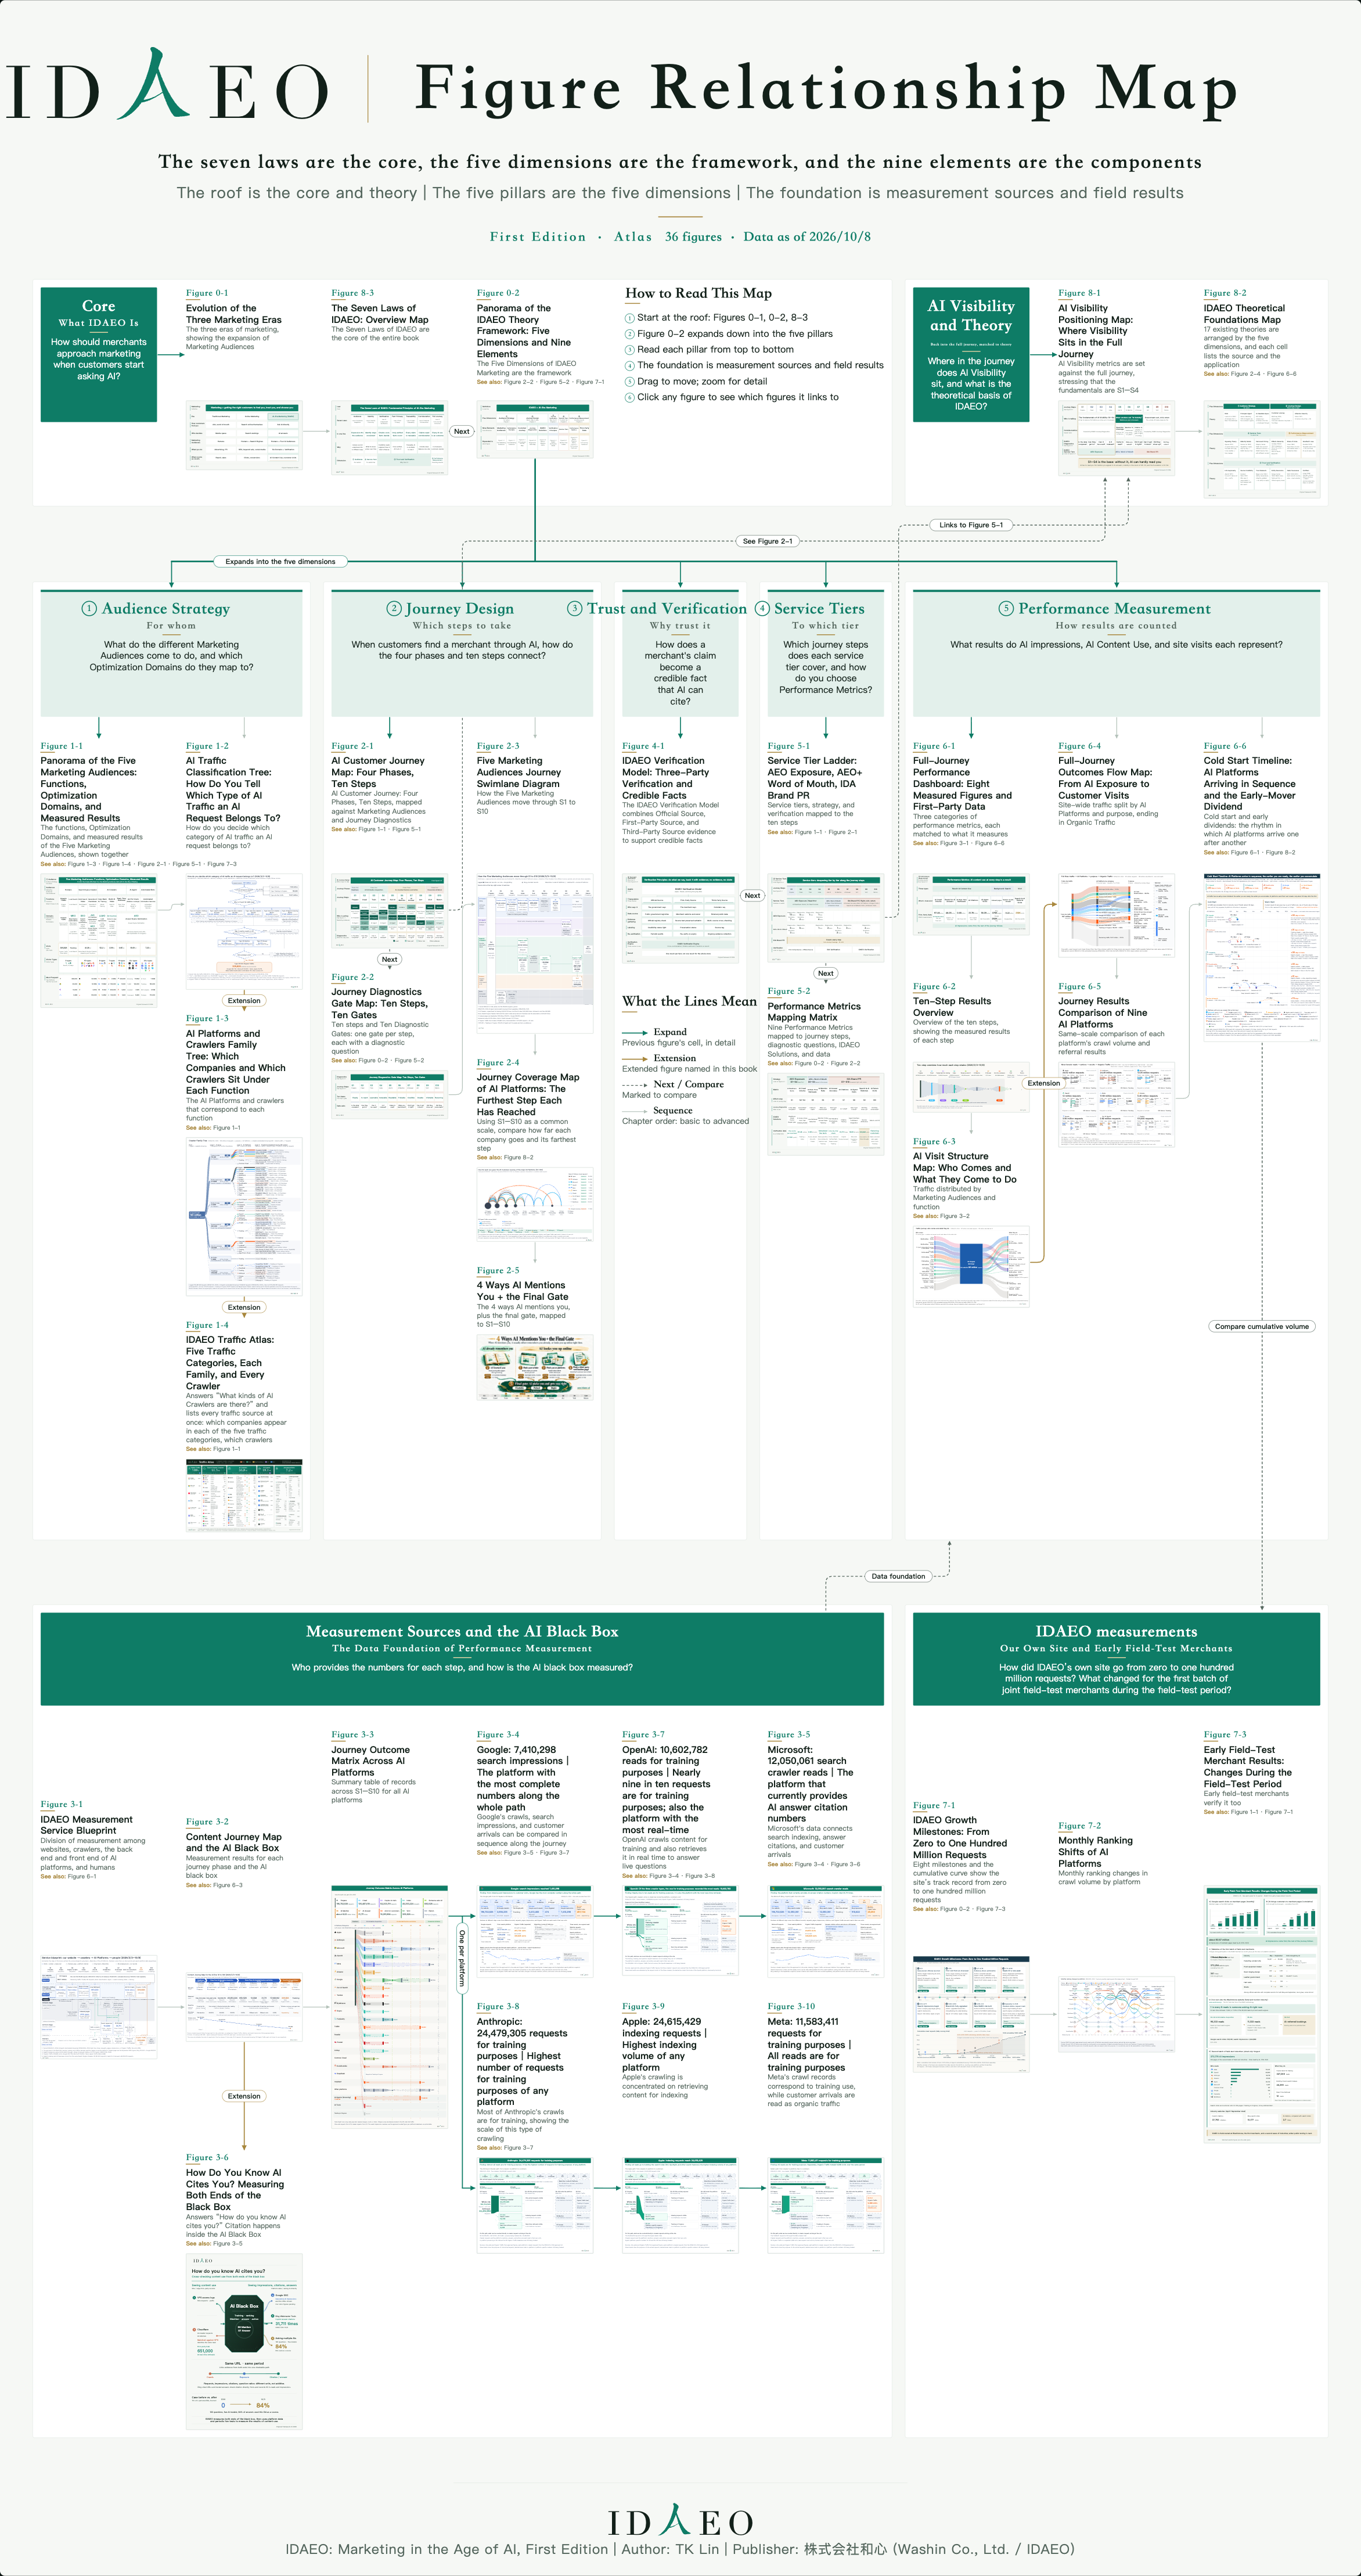
IDAEO Atlas

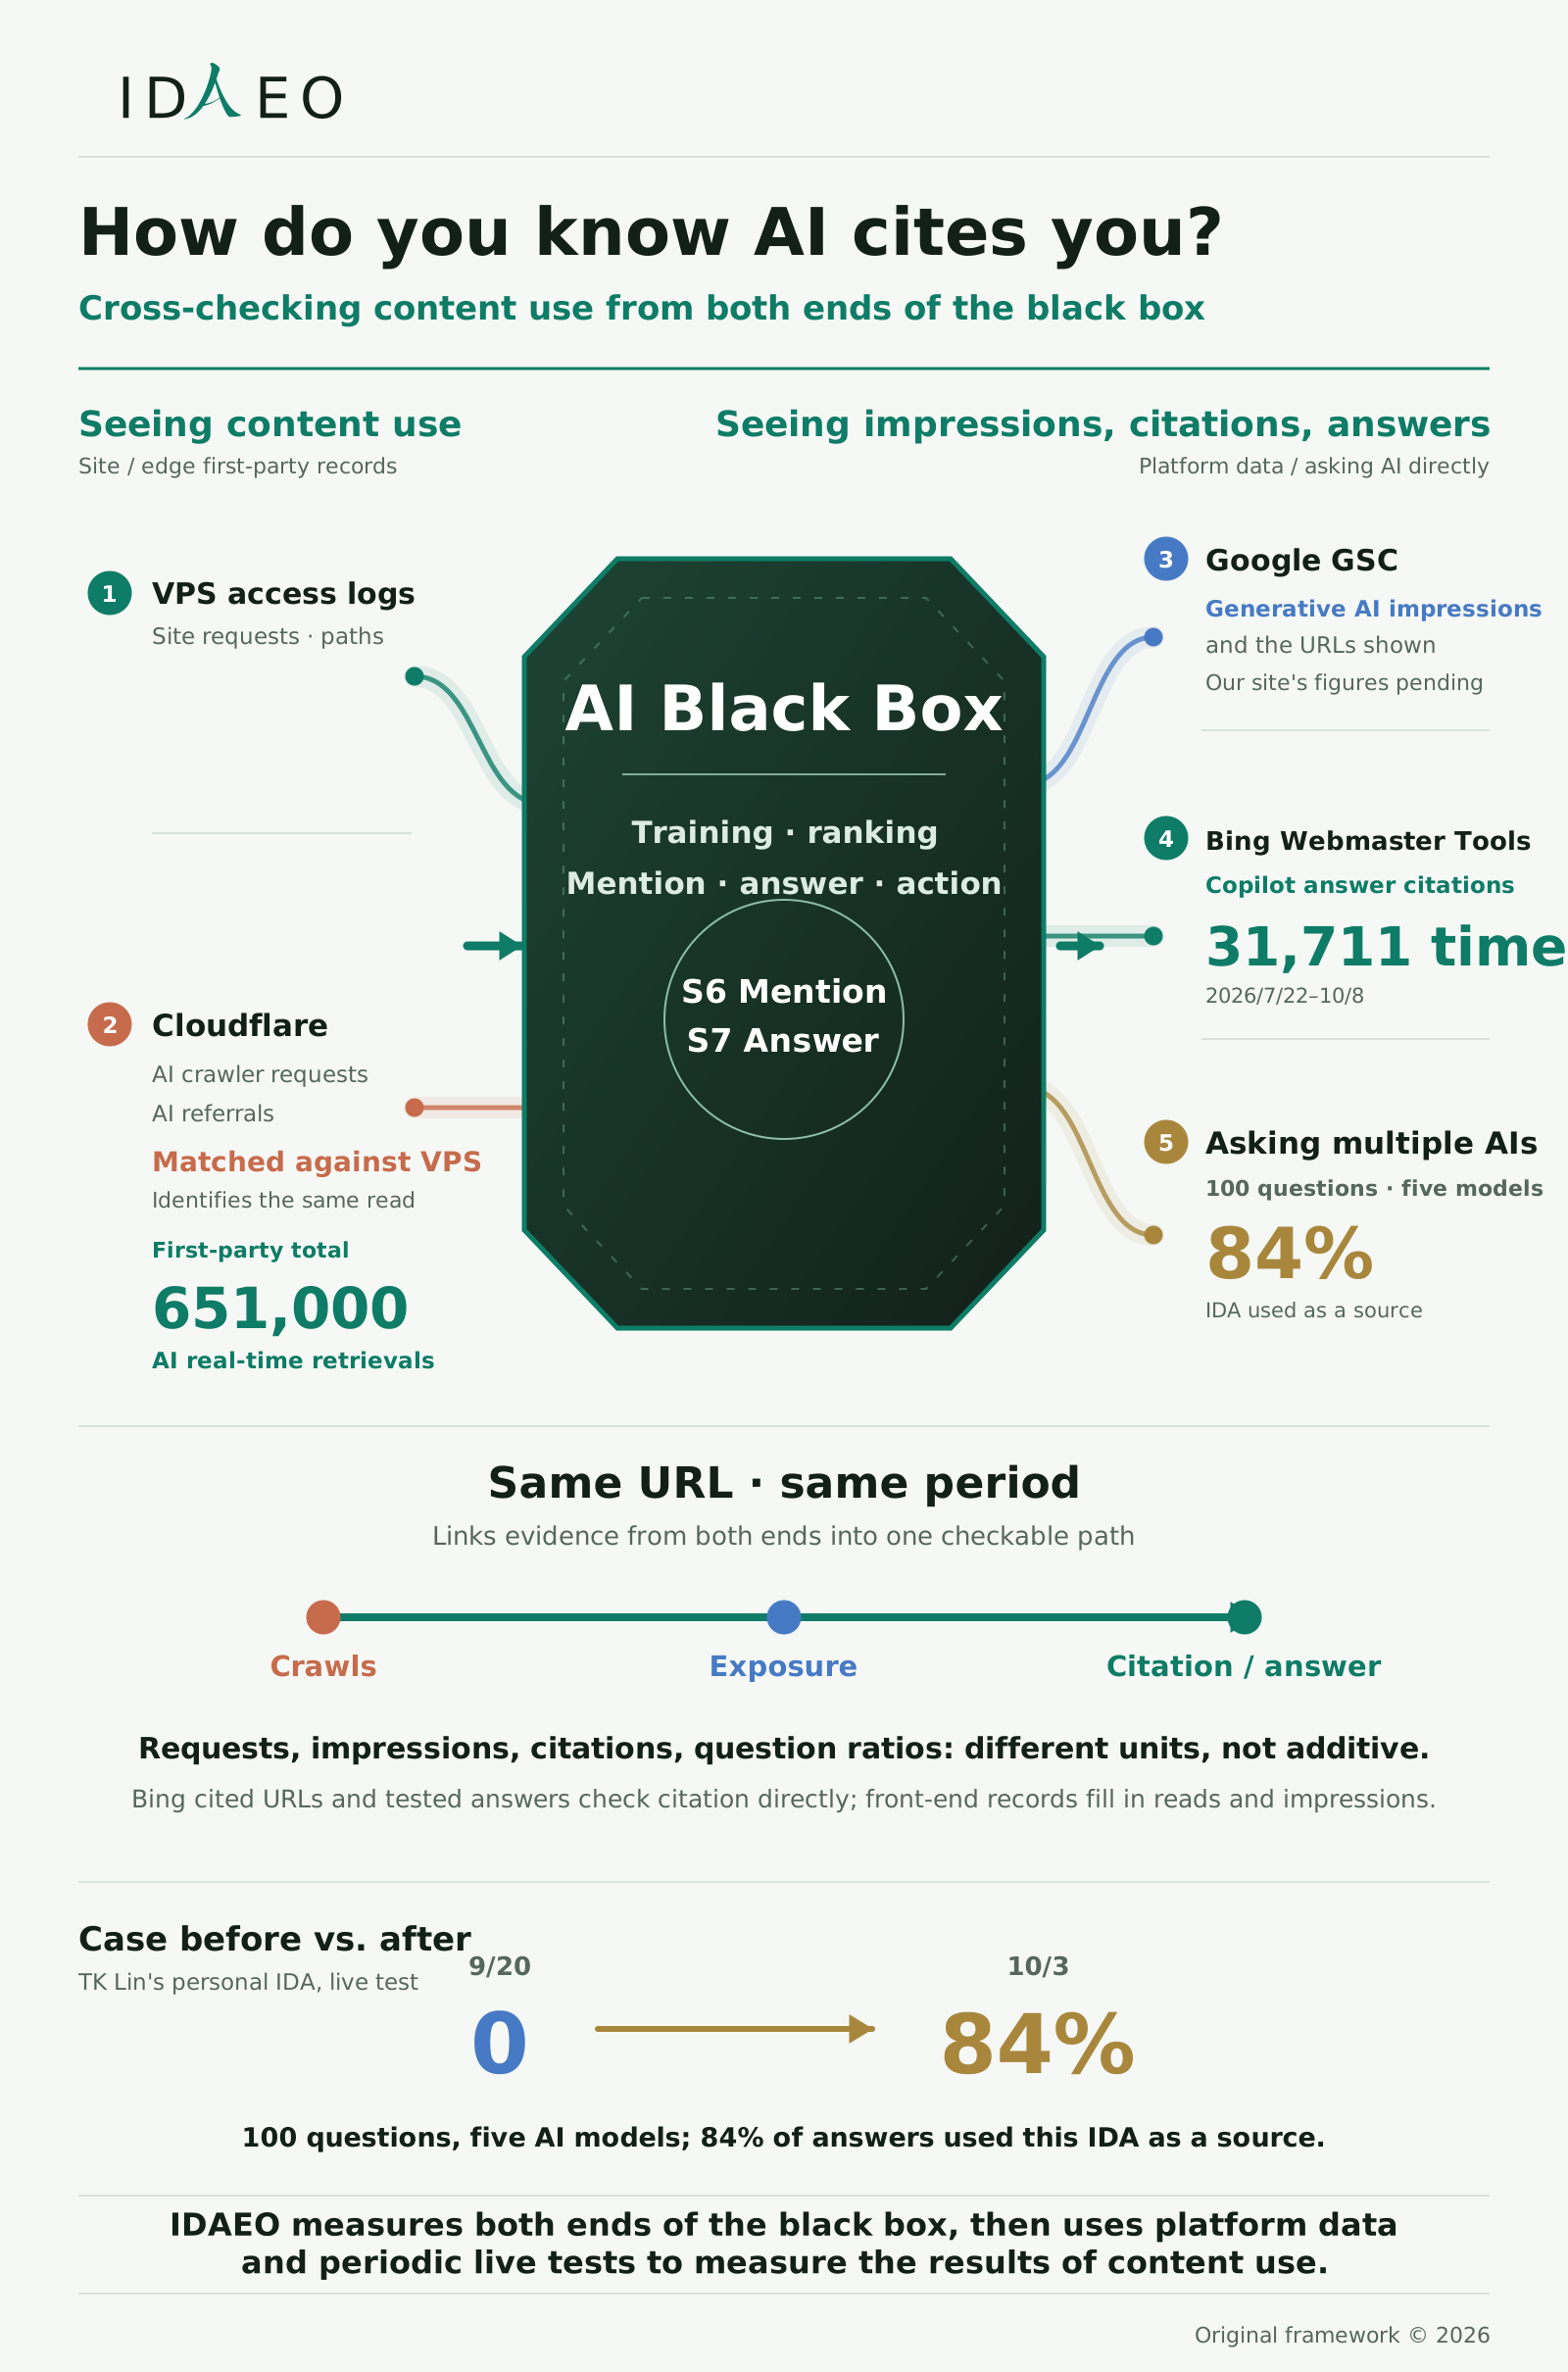
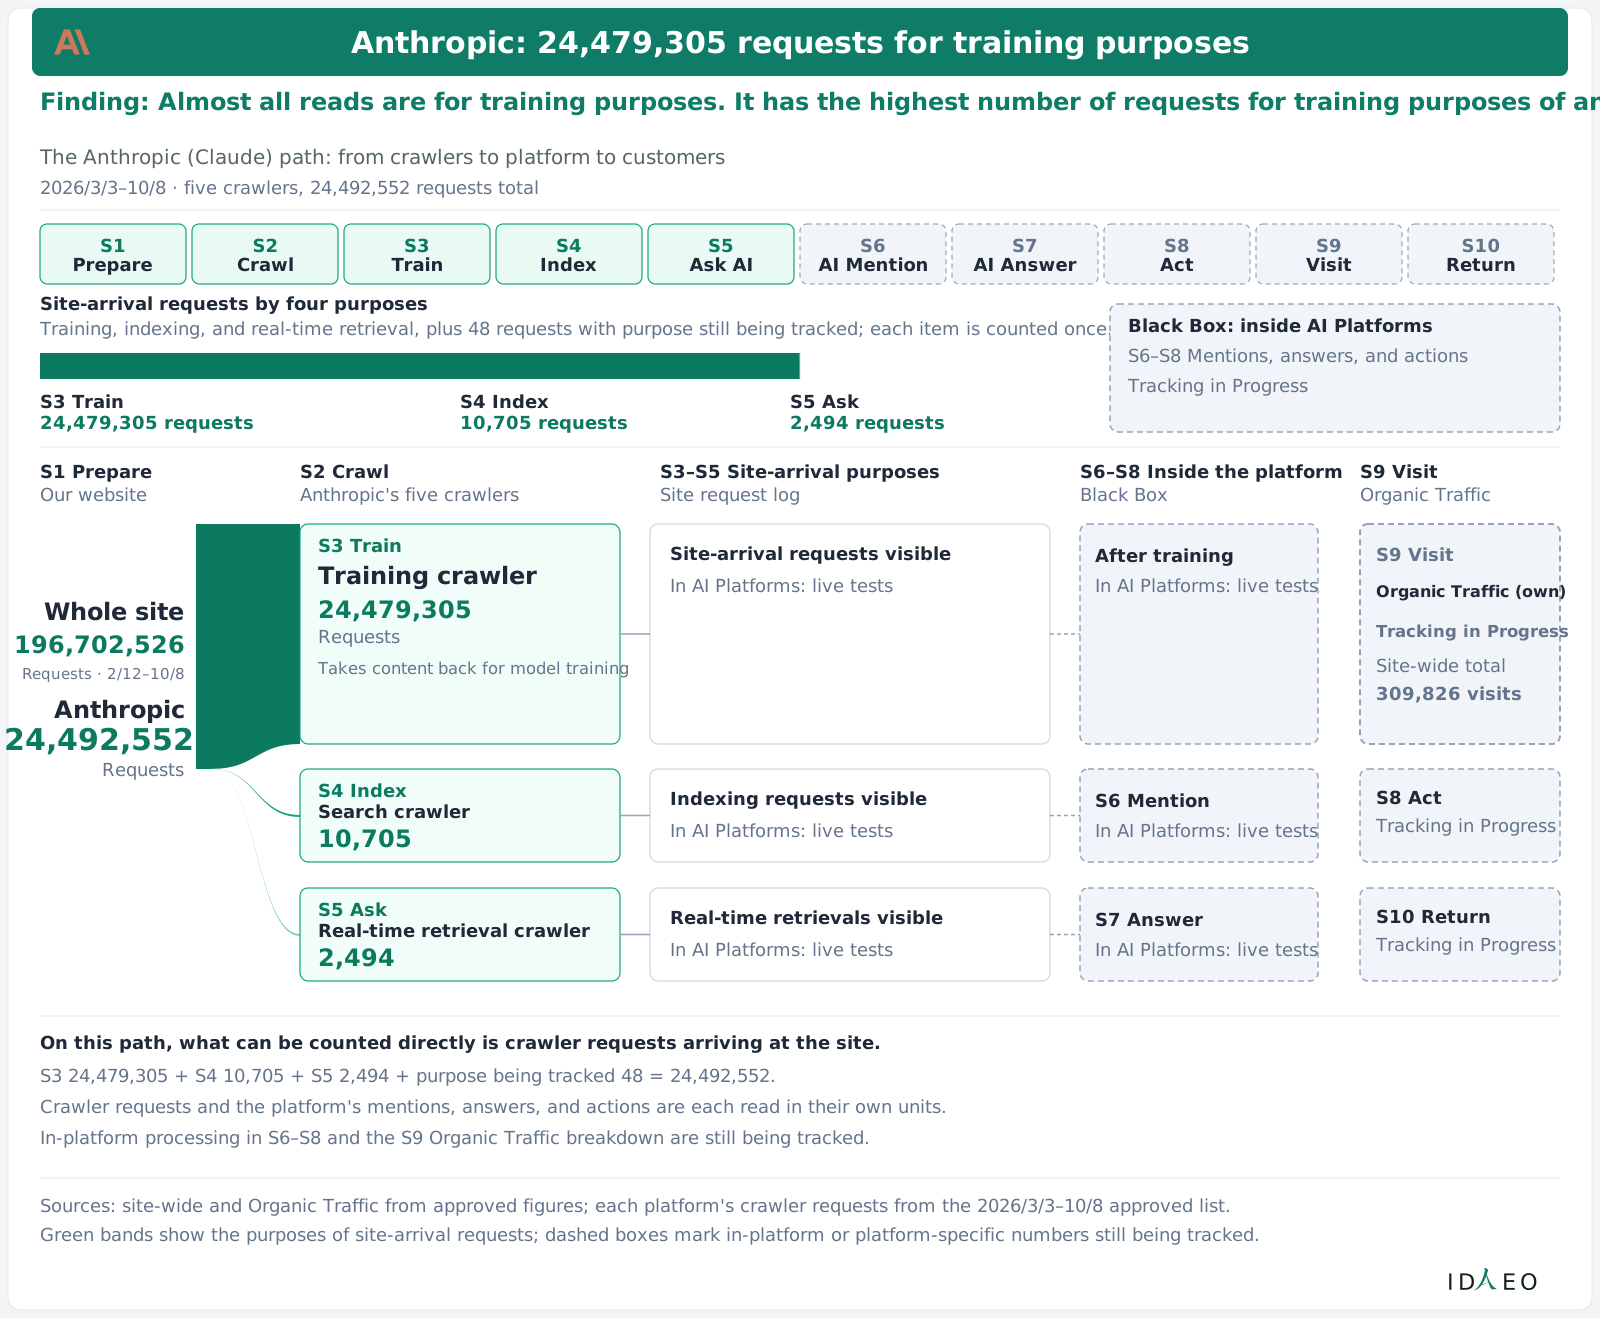
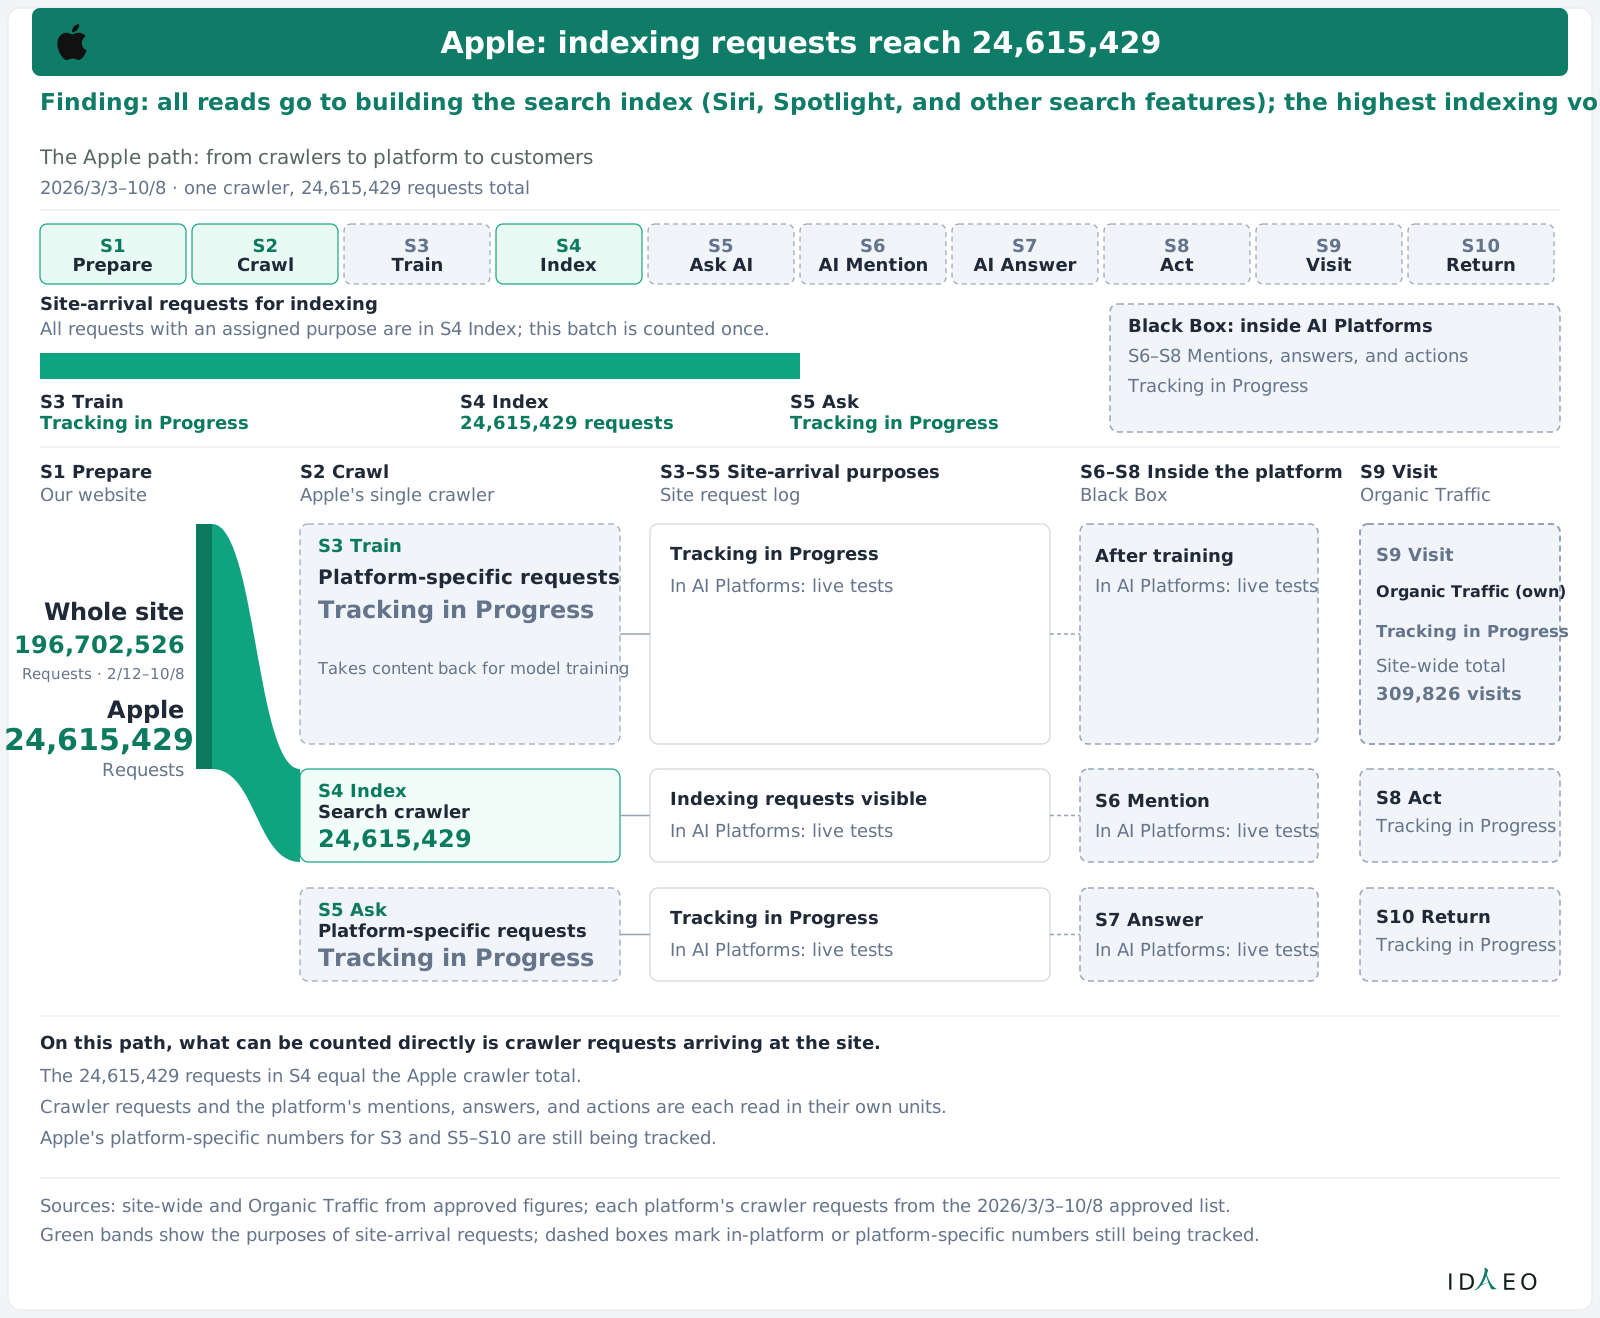
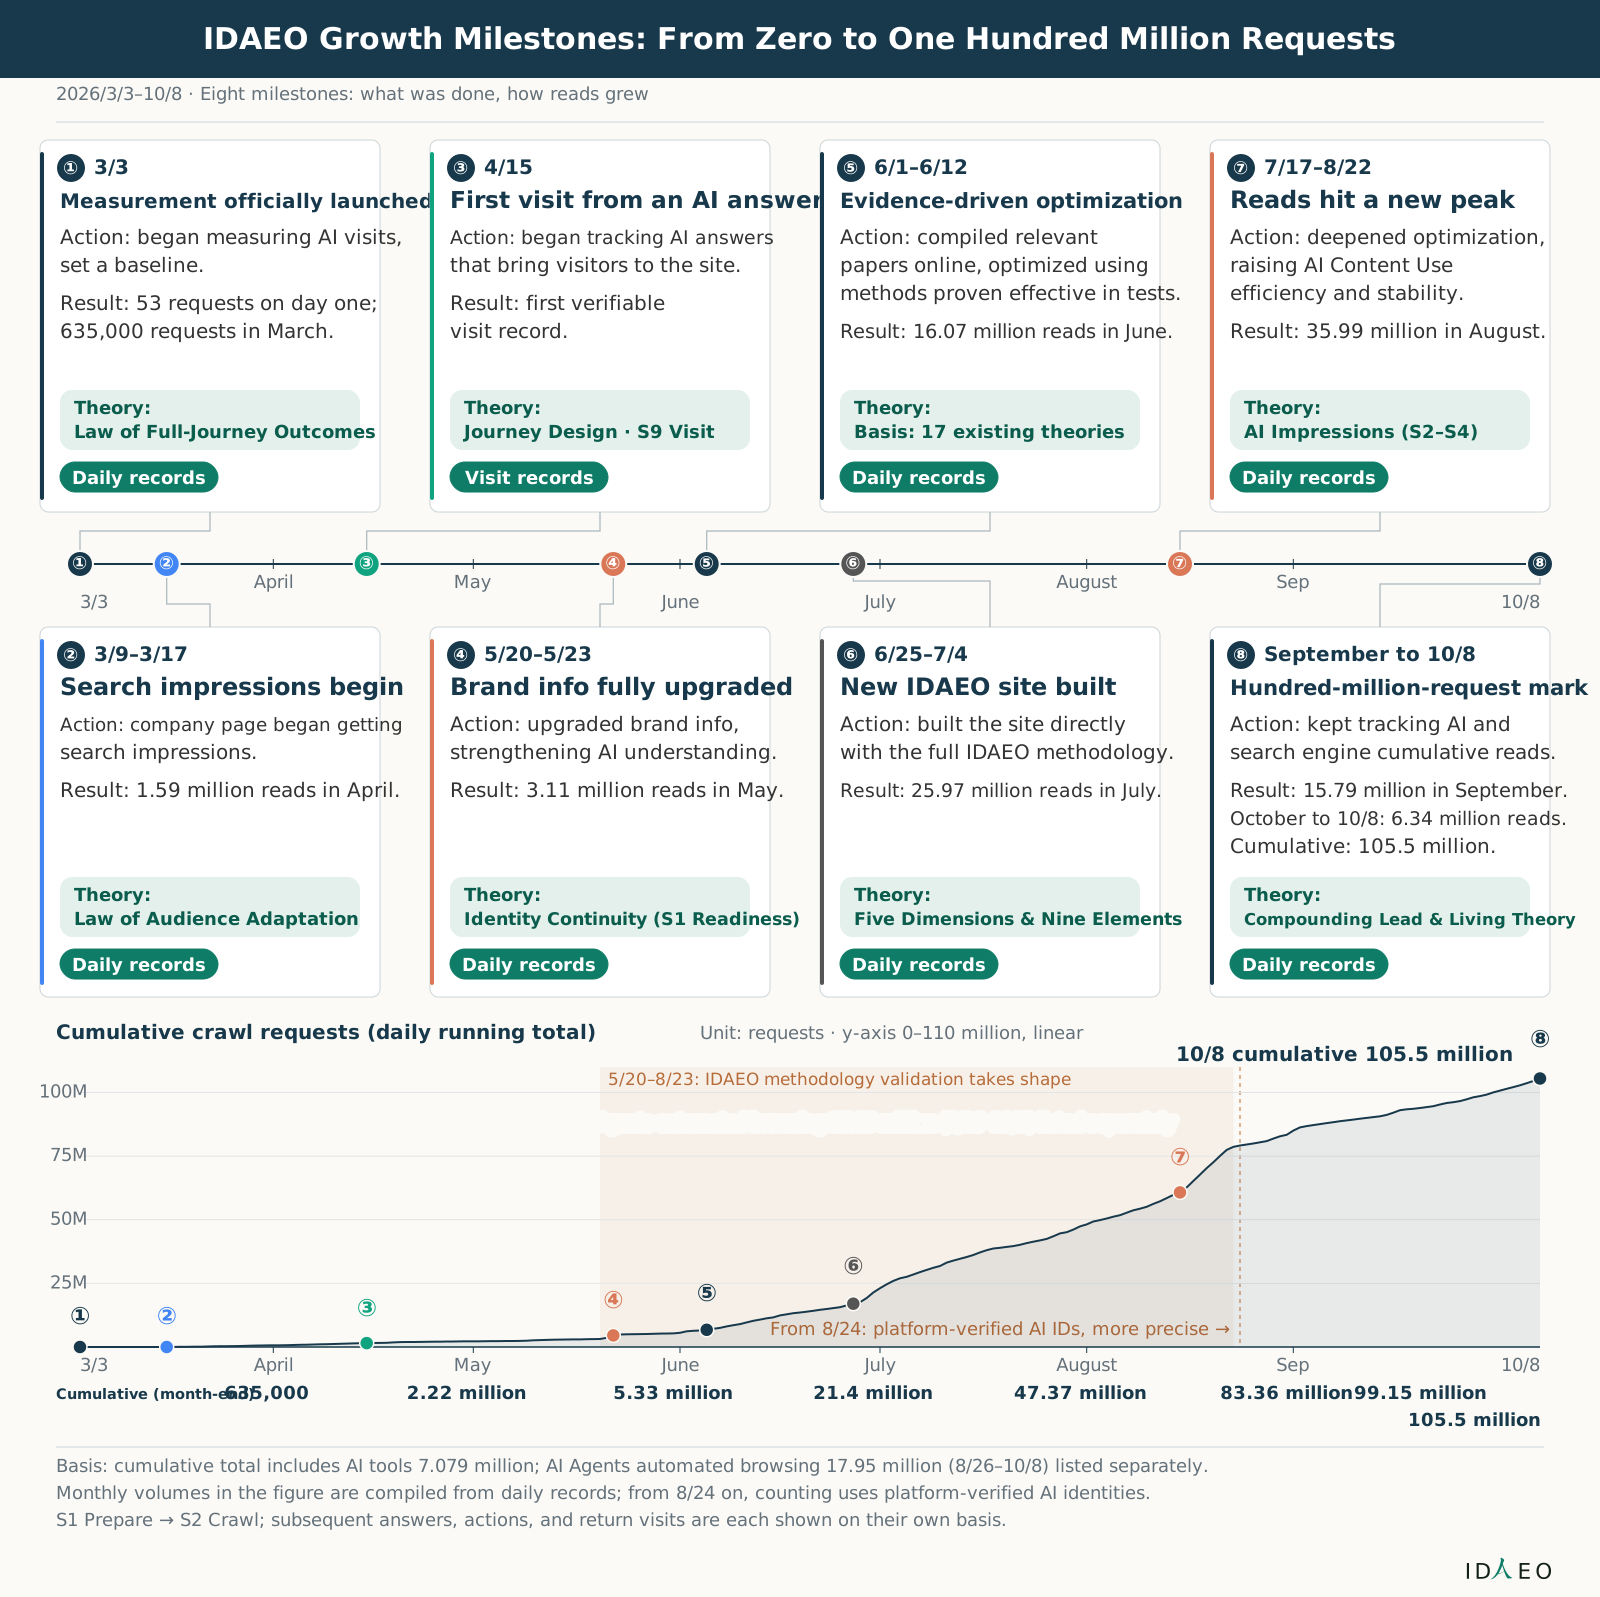
Figure Relationship Map

The seven laws are the core, the five dimensions are the framework, and the nine elements are the components

36 figures · 9 sections⬇ Download full AtlasPNG

Tap any figure to see it full size with notes

The roof is the core and theory

Core

What IDAEO Is

3
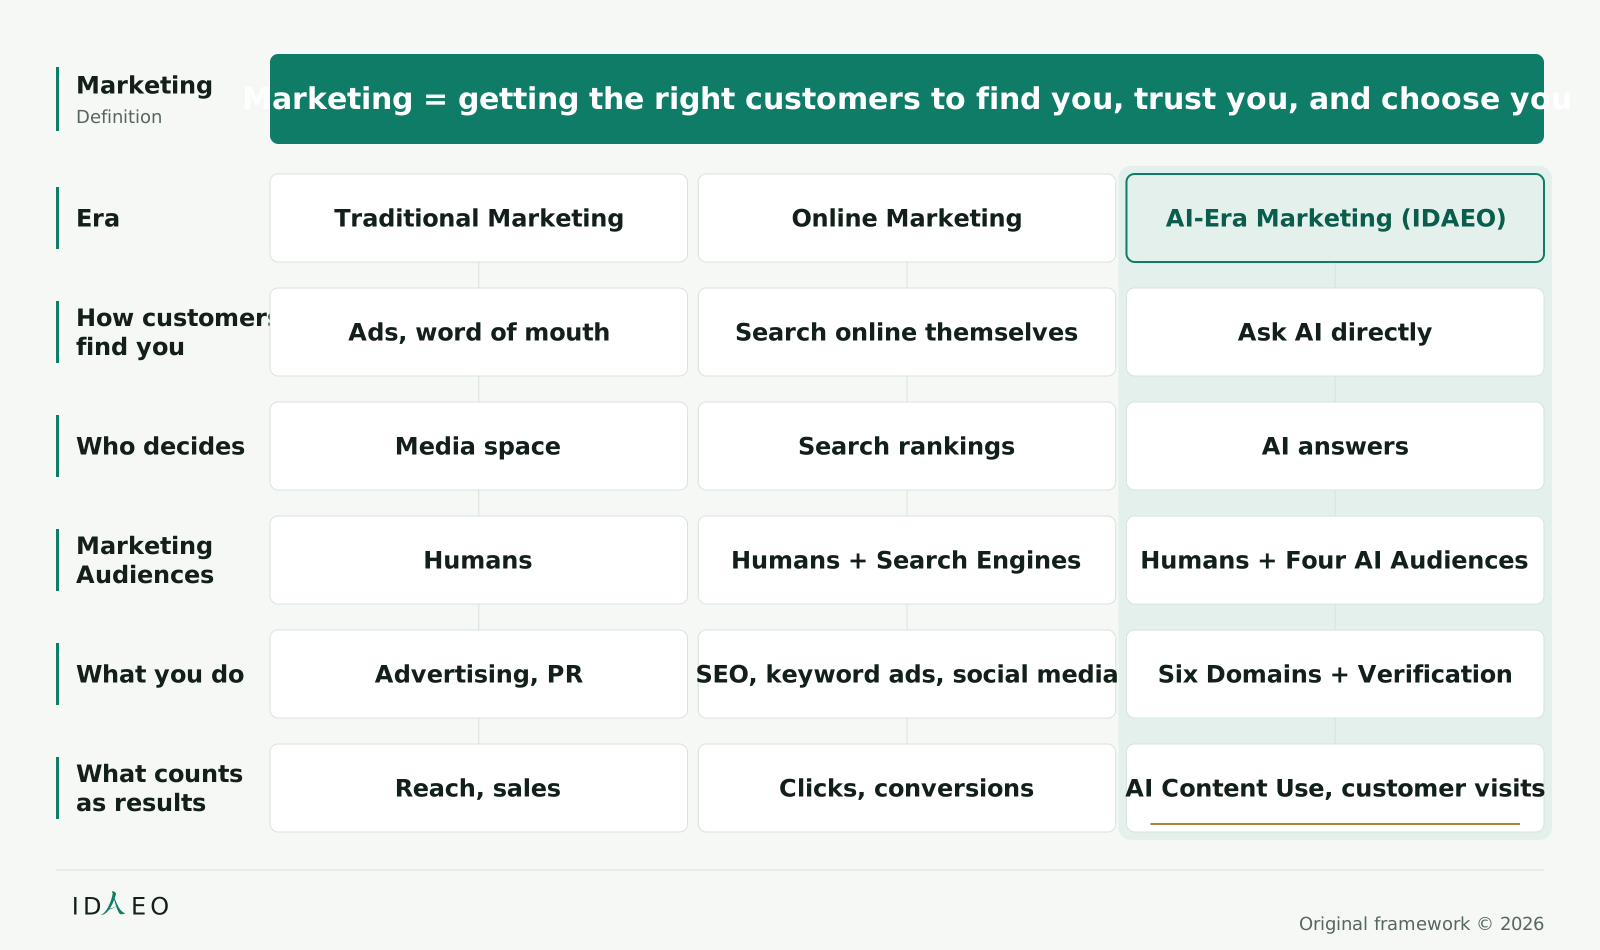
Evolution of the Three Marketing Eras The three eras of marketing, showing the expansion of Marketing Audiences

The three eras of marketing, showing the expansion of Marketing Audiences

Read the three eras from left to right and compare the five characteristics from top to bottom; the rightmost column is IDAEO.

  • Marketing
  • Definition
  • Marketing = getting the right customers to find you, trust you, and choose you
  • Era
  • Traditional Marketing
  • Online Marketing
  • AI-Era Marketing (IDAEO)
  • How customersfind you
  • Ads, word of mouth
  • Search online themselves
  • Ask AI directly
  • Who decides
  • Media space
  • Search rankings
  • AI answers
  • MarketingAudiences
  • Humans
  • Humans + Search Engines
  • Humans + Four AI Audiences
  • What you do
  • Advertising, PR
  • SEO, keyword ads, social media
  • Six Domains + Verification
  • What countsas results
  • Reach, sales
  • Clicks, conversions
  • AI Content Use, customer visits
  • ID
  • EO
  • Original framework © 2026

Related figures:Figure 8-3
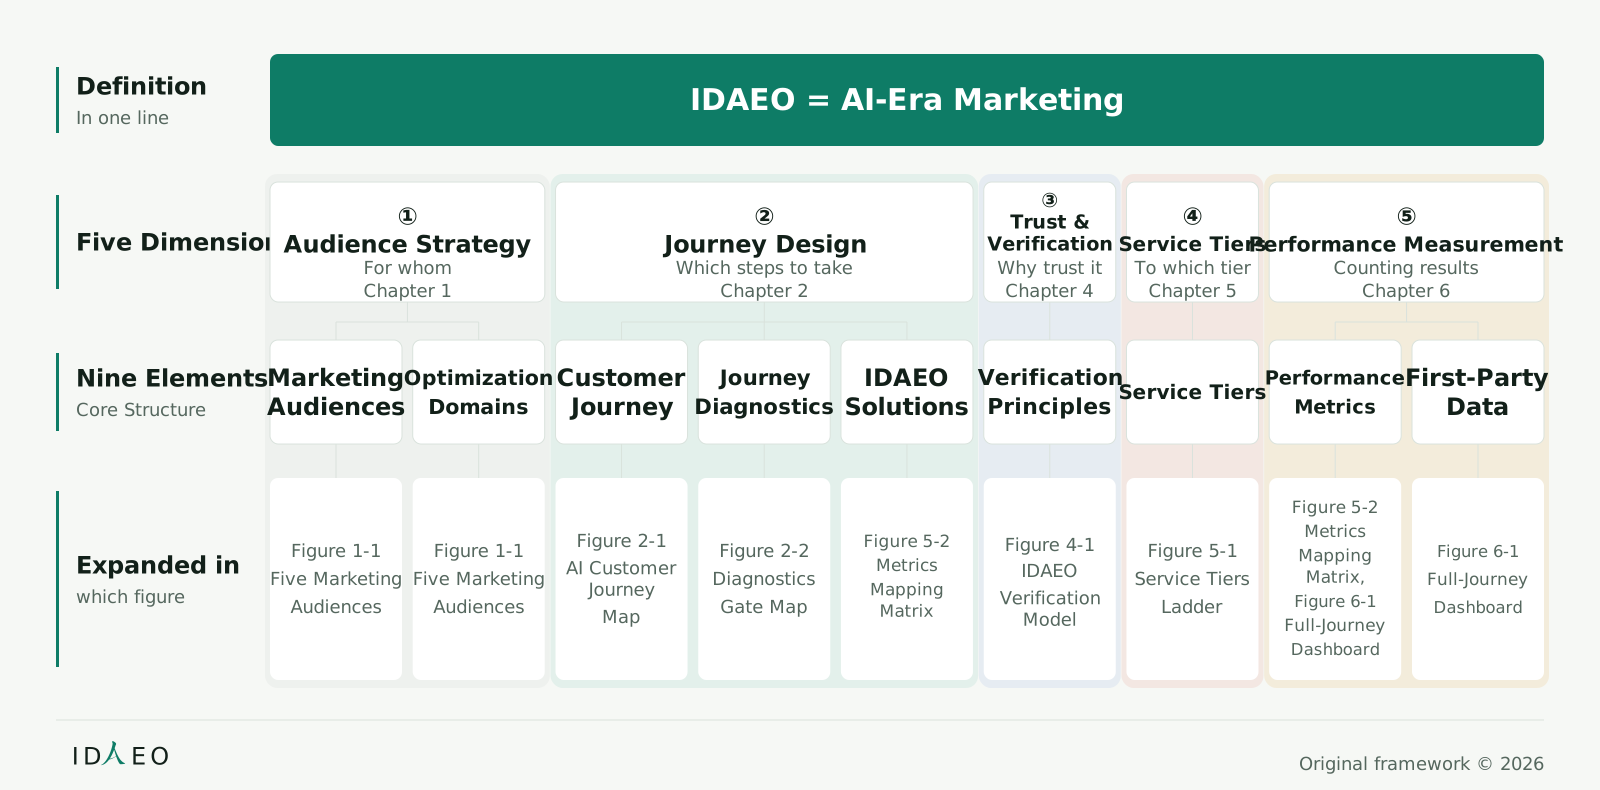
Figure 0-1Evolution of the Three Marketing Eras
Panorama of the IDAEO Theory Framework: Five Dimensions and Nine Elements The Five Dimensions of IDAEO Marketing are the framework

The Five Dimensions of IDAEO Marketing are the framework

Read from top to bottom: the one-line definition, the five dimensions, and the nine elements; each cell corresponds to the dimension above it, and the bottom row marks, by figure number and figure name, where each element is expanded.

  • Definition
  • In one line
  • IDAEO = AI-Era Marketing
  • Five Dimensions
  • ①
  • Audience Strategy
  • For whom
  • Chapter 1
  • ②
  • Journey Design
  • Which steps to take
  • Chapter 2
  • ③
  • Trust &Verification
  • Why trust it
  • Chapter 4
  • ④
  • Service Tiers
  • To which tier
  • Chapter 5
  • ⑤
  • Performance Measurement
  • Counting results
  • Chapter 6
  • Nine Elements
  • Core Structure
  • MarketingAudiences
  • OptimizationDomains
  • CustomerJourney
  • JourneyDiagnostics
  • IDAEO
  • Solutions
  • VerificationPrinciples
  • Service Tiers
  • PerformanceMetrics
  • First-Party
  • Data
  • Expanded in
  • which figure
  • Figure 1-1
  • Five Marketing
  • Audiences
  • Figure 1-1
  • Five Marketing
  • Audiences
  • Figure 2-1
  • AI CustomerJourney
  • Map
  • Figure 2-2
  • Diagnostics
  • Gate Map
  • Figure 5-2
  • Metrics
  • MappingMatrix
  • Figure 4-1
  • IDAEO
  • VerificationModel
  • Figure 5-1
  • Service Tiers
  • Ladder
  • Figure 5-2
  • Metrics
  • MappingMatrix,
  • Figure 6-1
  • Full-Journey
  • Dashboard
  • Figure 6-1
  • Full-Journey
  • Dashboard
  • ID
  • EO
  • Original framework © 2026

Related figures:Figure 8-3、Figure 1-1、Figure 2-1、Figure 4-1、Figure 5-1、Figure 6-1、Figure 2-2、Figure 5-2、Figure 7-1
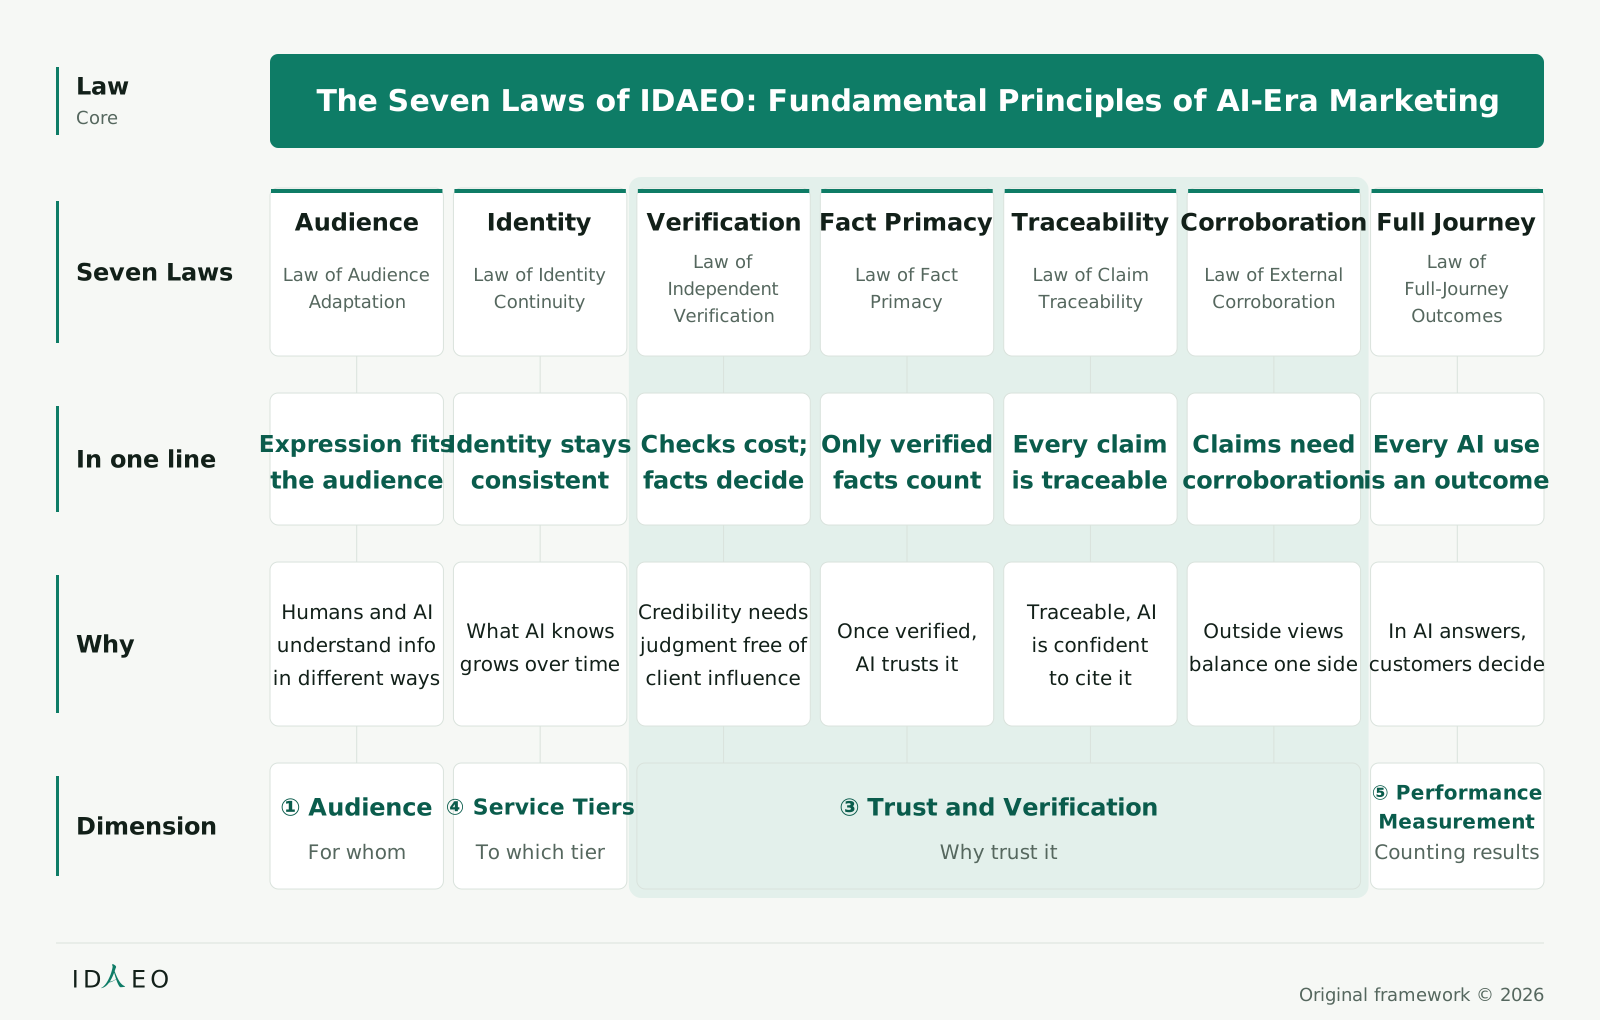
Figure 0-2Panorama of the IDAEO Theory Framework: Five Dimensions and Nine Elements
The Seven Laws of IDAEO: Overview Map The Seven Laws of IDAEO are the core of the entire book

The Seven Laws of IDAEO are the core of the entire book

Read from top to bottom: law name, one-line summary, why, and corresponding dimension. The bottom row connects to Figure 0-2, “Panorama of the IDAEO Theory Framework,” linking the core principles to the framework. All seven laws land on the ten steps. Journey Design is where the seven laws are put into practice together, so the bottom row of Figure 8-3 does not list it separately. Services stack up tier by tier on the same entity, so the Law of Identity Continuity corresponds to Service Tiers. When cross-checking the same entity across sources, see whether AI links different content back to that entity. If consistent identity information still leads to misidentification, revisit this law.

  • Law
  • Core
  • The Seven Laws of IDAEO: Fundamental Principles of AI-Era Marketing
  • Seven Laws
  • Audience
  • Law of Audience
  • Adaptation
  • Identity
  • Law of Identity
  • Continuity
  • Verification
  • Law of
  • Independent
  • Verification
  • Fact Primacy
  • Law of Fact
  • Primacy
  • Traceability
  • Law of Claim
  • Traceability
  • Corroboration
  • Law of External
  • Corroboration
  • Full Journey
  • Law of
  • Full-Journey
  • Outcomes
  • In one line
  • Expression fits
  • the audience
  • Identity stays
  • consistent
  • Checks cost;
  • facts decide
  • Only verified
  • facts count
  • Every claim
  • is traceable
  • Claims need
  • corroboration
  • Every AI use
  • is an outcome
  • Why
  • Humans and AI
  • understand info
  • in different ways
  • What AI knows
  • grows over time
  • Credibility needs
  • judgment free of
  • client influence
  • Once verified,
  • AI trusts it
  • Traceable, AI
  • is confident
  • to cite it
  • Outside views
  • balance one side
  • In AI answers,
  • customers decide
  • Dimension
  • ① Audience
  • For whom
  • ④ Service Tiers
  • To which tier
  • ③ Trust and Verification
  • Why trust it
  • ⑤ PerformanceMeasurement
  • Counting results
  • ID
  • EO
  • Original framework © 2026

Related figures:Figure 0-1、Figure 0-2
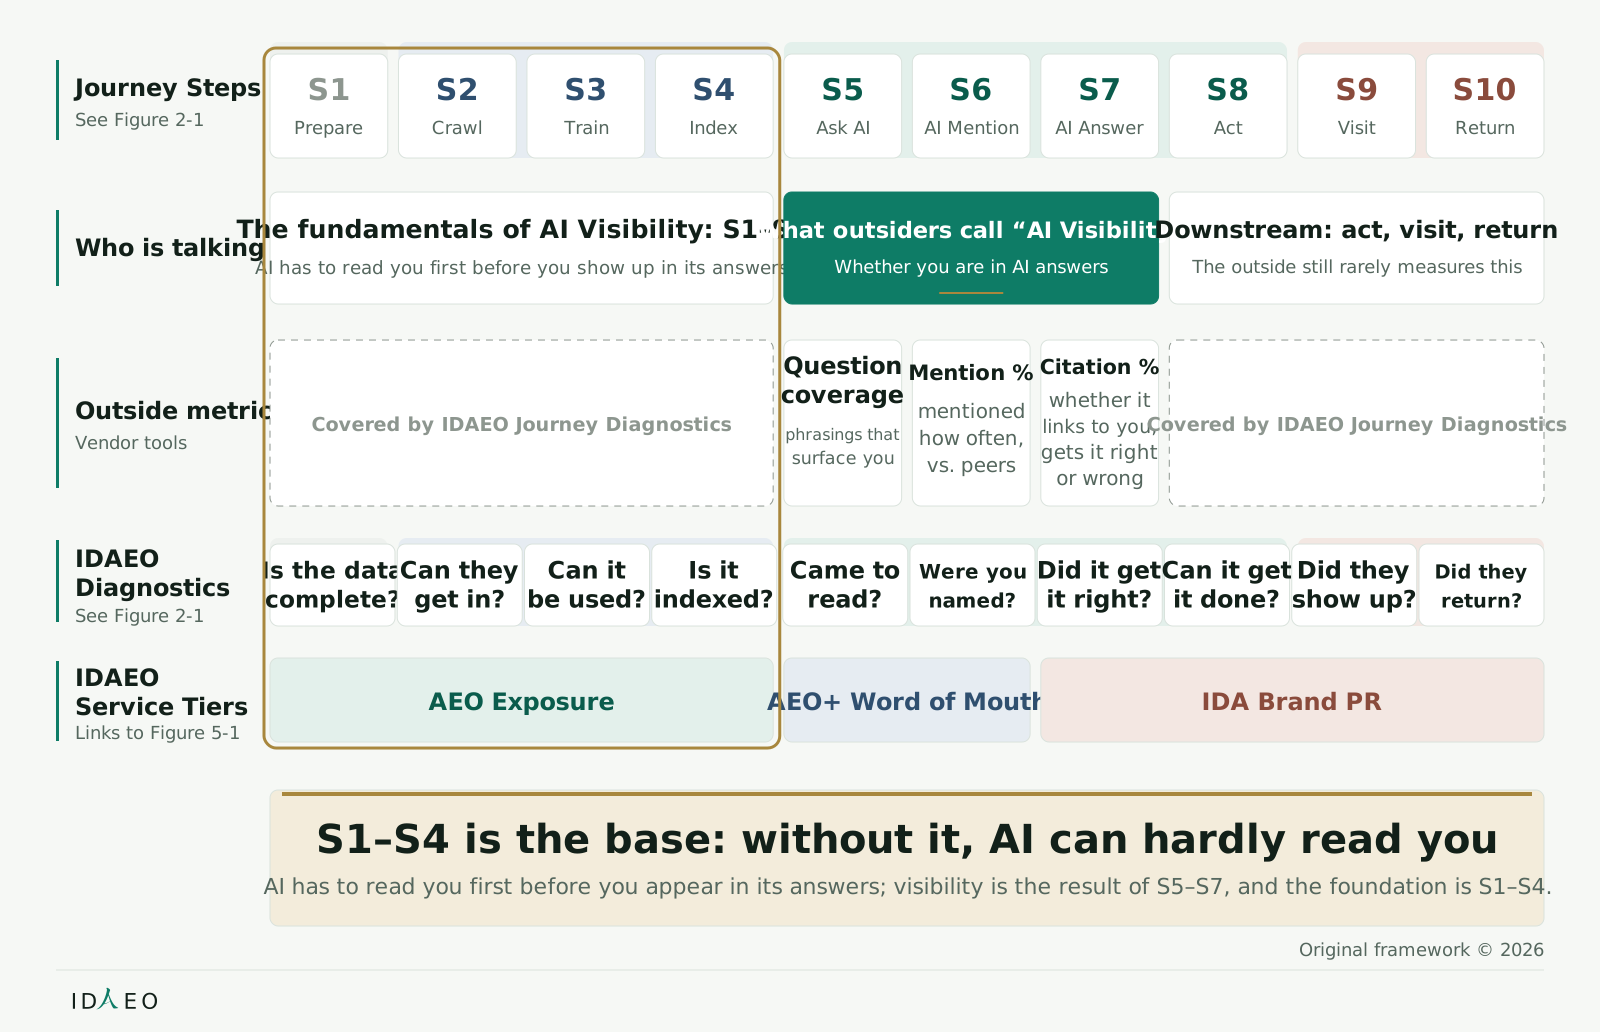
Figure 8-3The Seven Laws of IDAEO: Overview Map

AI Visibility and Theory

Back into the full journey, matched to theory

2
AI Visibility Positioning Map: Where Visibility Sits in the Full Journey AI Visibility metrics are set against the full journey, stressing that the fundamentals are S1–S4

AI Visibility metrics are set against the full journey, stressing that the fundamentals are S1–S4

Read from top to bottom: the ten steps, industry topics, industry metrics, IDAEO Journey Diagnostics, and Service Tiers; each column is the same step.

  • Journey Steps
  • See Figure 2-1
  • S1
  • Prepare
  • S2
  • Crawl
  • S3
  • Train
  • S4
  • Index
  • S5
  • Ask AI
  • S6
  • AI Mention
  • S7
  • AI Answer
  • S8
  • Act
  • S9
  • Visit
  • S10
  • Return
  • Who is talking
  • The fundamentals of AI Visibility: S1–S4
  • AI has to read you first before you show up in its answers
  • What outsiders call “AI Visibility”
  • Whether you are in AI answers
  • Downstream: act, visit, return
  • The outside still rarely measures this
  • Outside metrics
  • Vendor tools
  • Covered by IDAEO Journey Diagnostics
  • Question
  • coverage
  • phrasings that
  • surface you
  • Mention %
  • mentioned
  • how often,
  • vs. peers
  • Citation %
  • whether it
  • links to you,
  • gets it right
  • or wrong
  • Covered by IDAEO Journey Diagnostics
  • IDAEO
  • Diagnostics
  • See Figure 2-1
  • Is the datacomplete?
  • Can theyget in?
  • Can itbe used?
  • Is itindexed?
  • Came toread?
  • Were younamed?
  • Did it getit right?
  • Can it getit done?
  • Did theyshow up?
  • Did theyreturn?
  • IDAEO
  • Service Tiers
  • Links to Figure 5-1
  • AEO Exposure
  • AEO+ Word of Mouth
  • IDA Brand PR
  • S1–S4 is the base: without it, AI can hardly read you
  • AI has to read you first before you appear in its answers; visibility is the result of S5–S7, and the foundation is S1–S4.
  • ID
  • EO
  • Original framework © 2026

Related figures:Figure 8-2、Figure 2-1、Figure 5-1

Figure 8-1AI Visibility Positioning Map: Where Visibility Sits in the Full Journey
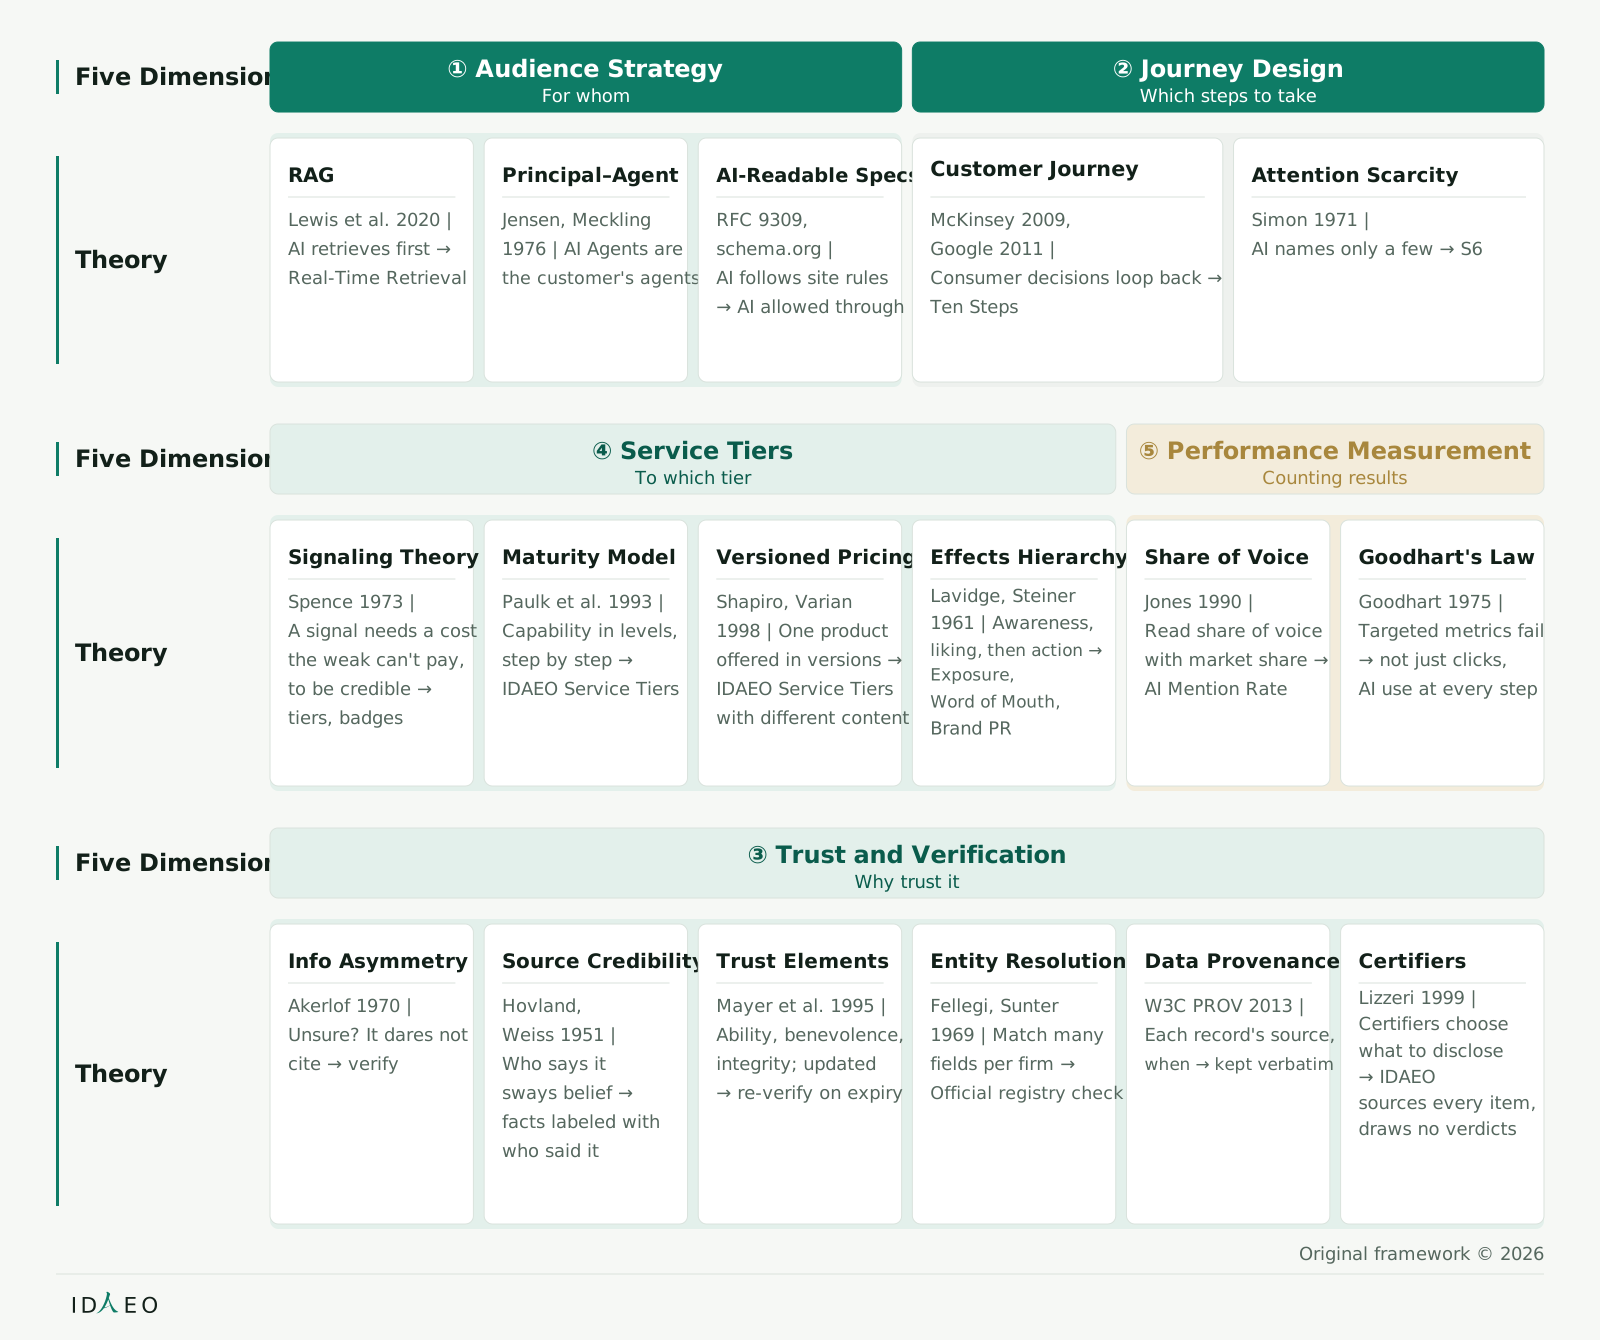
IDAEO Theoretical Foundations Map 17 existing theories are arranged by the five dimensions, and each cell lists the source and the application

17 existing theories are arranged by the five dimensions, and each cell lists the source and the application

In each cell, look at the author, year, and theory first, then follow the arrow to the corresponding IDAEO design. The arrows show analogies. They do not mean that the theory proves IDAEO's validity.

  • Five Dimensions
  • ① Audience Strategy
  • For whom
  • ② Journey Design
  • Which steps to take
  • Theory
  • RAG
  • Lewis et al. 2020 |
  • AI retrieves first →
  • Real-Time Retrieval
  • Principal–Agent
  • Jensen, Meckling
  • 1976 | AI Agents are
  • the customer's agents
  • AI-Readable Specs
  • RFC 9309,
  • schema.org |
  • AI follows site rules
  • → AI allowed through
  • Customer Journey
  • McKinsey 2009,
  • Google 2011 |
  • Consumer decisions loop back →
  • Ten Steps
  • Attention Scarcity
  • Simon 1971 |
  • AI names only a few → S6
  • Five Dimensions
  • ④ Service Tiers
  • To which tier
  • ⑤ Performance Measurement
  • Counting results
  • Theory
  • Signaling Theory
  • Spence 1973 |
  • A signal needs a cost
  • the weak can't pay,
  • to be credible →
  • tiers, badges
  • Maturity Model
  • Paulk et al. 1993 |
  • Capability in levels,
  • step by step →
  • IDAEO Service Tiers
  • Versioned Pricing
  • Shapiro, Varian
  • 1998 | One product
  • offered in versions →
  • IDAEO Service Tiers
  • with different content
  • Effects Hierarchy
  • Lavidge, Steiner
  • 1961 | Awareness,
  • liking, then action →
  • Exposure,Word of Mouth,
  • Brand PR
  • Share of Voice
  • Jones 1990 |
  • Read share of voice
  • with market share →
  • AI Mention Rate
  • Goodhart's Law
  • Goodhart 1975 |
  • Targeted metrics fail
  • → not just clicks,
  • AI use at every step
  • Five Dimensions
  • ③ Trust and Verification
  • Why trust it
  • Theory
  • Info Asymmetry
  • Akerlof 1970 |
  • Unsure? It dares not
  • cite → verify
  • Source Credibility
  • Hovland,
  • Weiss 1951 |
  • Who says it
  • sways belief →
  • facts labeled with
  • who said it
  • Trust Elements
  • Mayer et al. 1995 |
  • Ability, benevolence,
  • integrity; updated
  • → re-verify on expiry
  • Entity Resolution
  • Fellegi, Sunter
  • 1969 | Match many
  • fields per firm →
  • Official registry check
  • Data Provenance
  • W3C PROV 2013 |
  • Each record's source,
  • when → kept verbatim
  • Certifiers
  • Lizzeri 1999 |
  • Certifiers choose
  • what to disclose→ IDAEO
  • sources every item,
  • draws no verdicts
  • ID
  • EO
  • Original framework © 2026

Related figures:Figure 8-1、Figure 2-4、Figure 6-6

Figure 8-2IDAEO Theoretical Foundations Map

The five pillars are the five dimensions

Audience Strategy

For whom

4
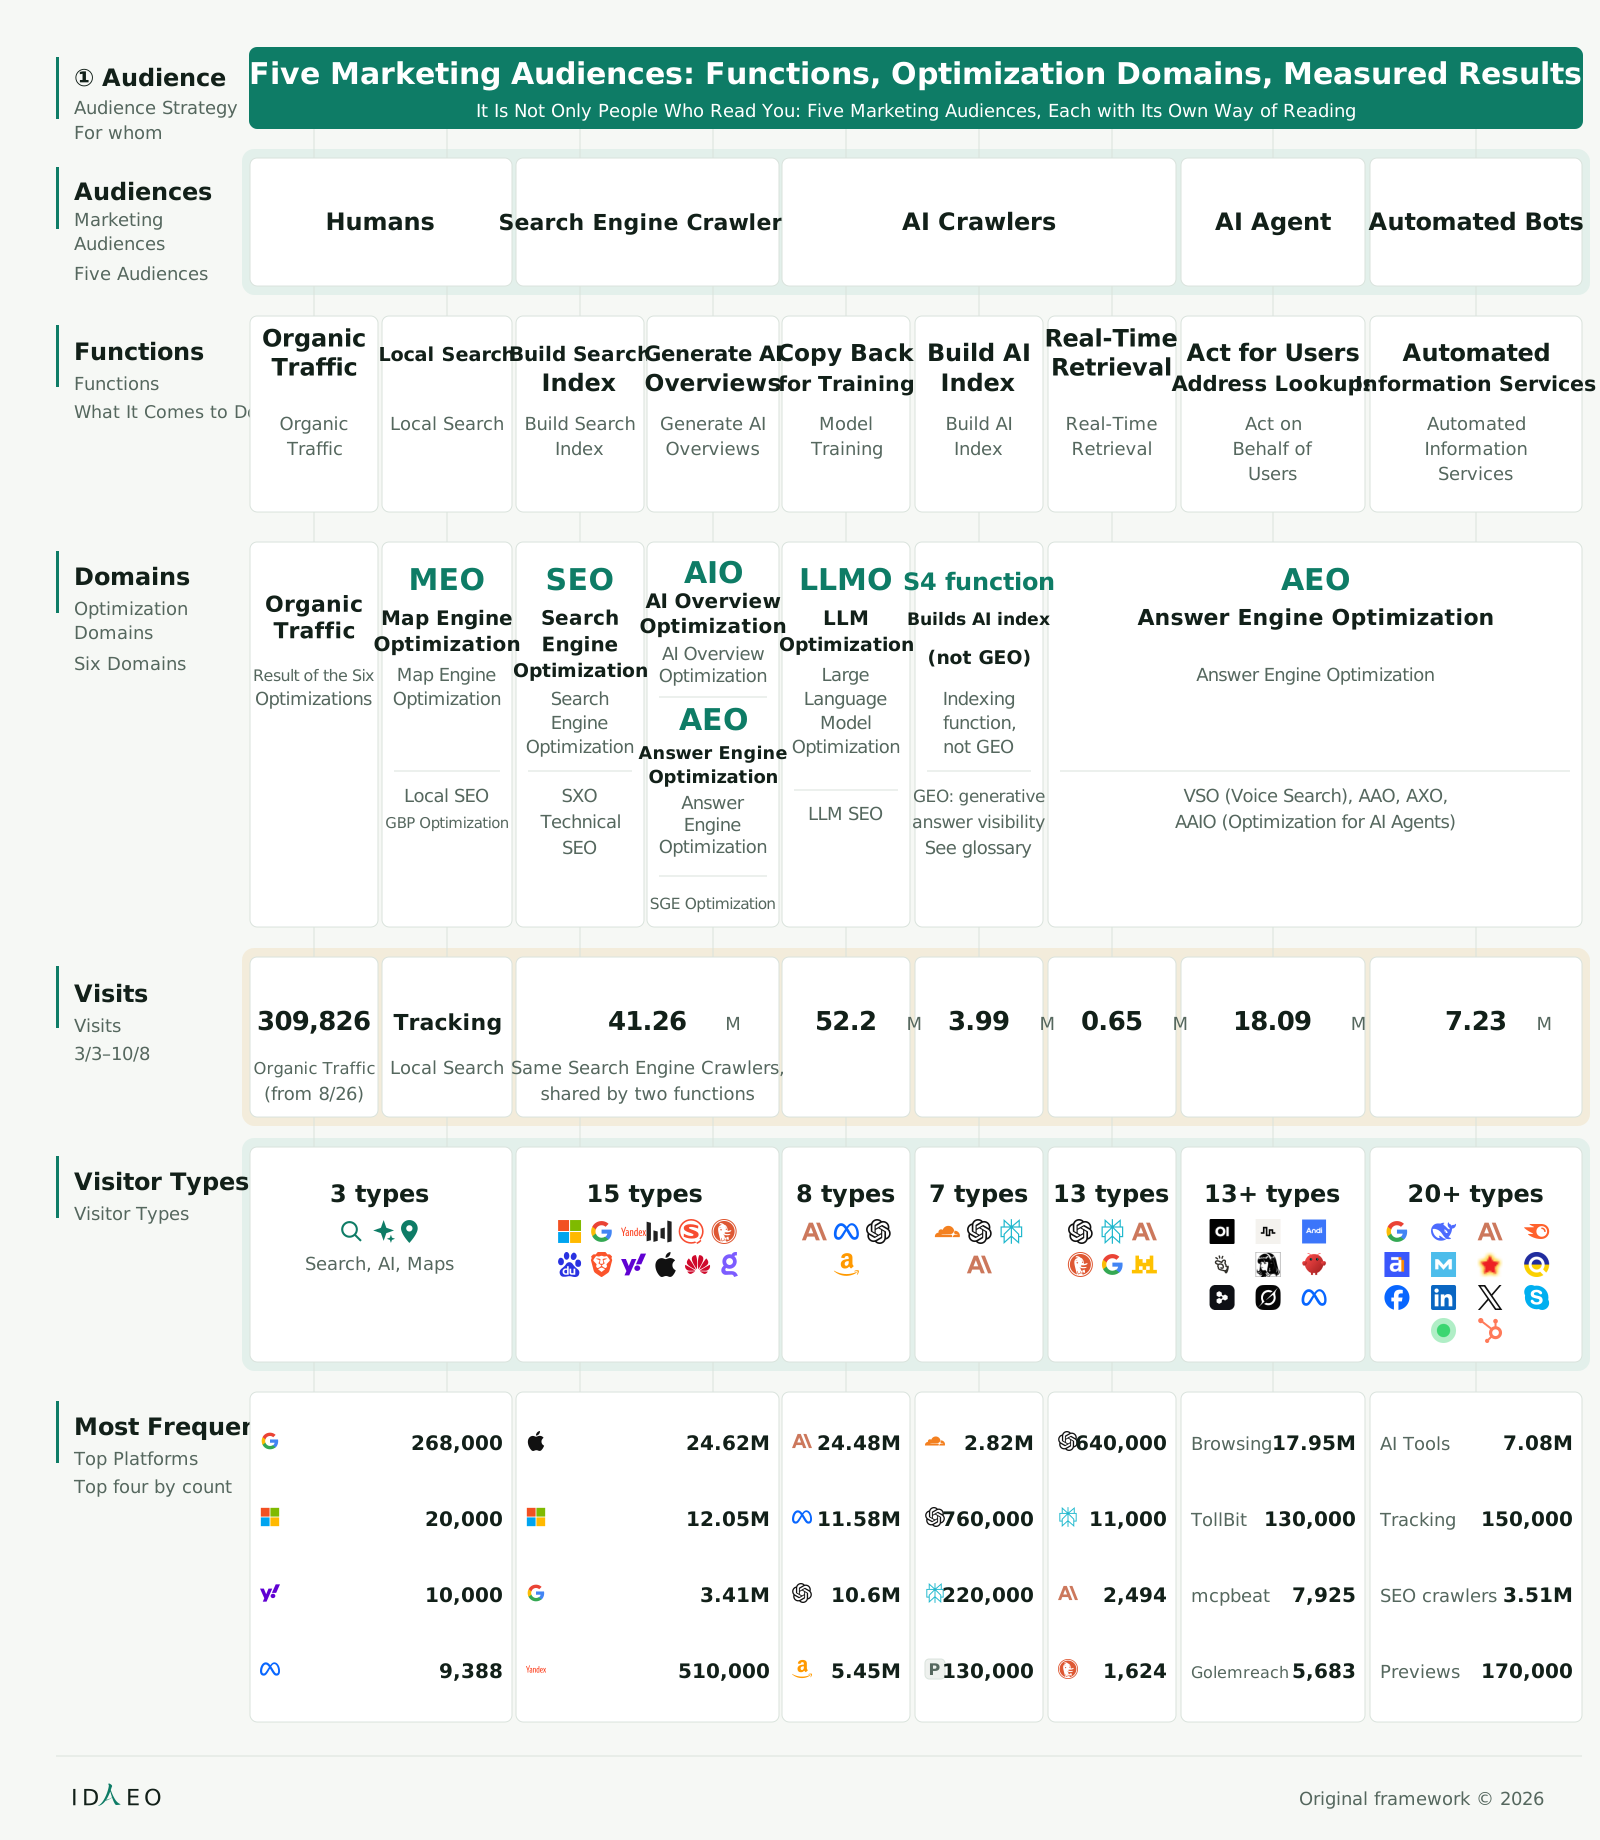
Panorama of the Five Marketing Audiences: Functions, Optimization Domains, and Measured Results The functions, Optimization Domains, and measured results of the Five Marketing Audiences, shown together

The functions, Optimization Domains, and measured results of the Five Marketing Audiences, shown together

Read top to bottom: Audience Strategy, Marketing Audiences, function, Optimization Domains, visit counts, visitor types, and the top four.

  • ① Audience
  • For whom
  • Five Marketing Audiences: Functions, Optimization Domains, Measured Results
  • It Is Not Only People Who Read You: Five Marketing Audiences, Each with Its Own Way of Reading
  • Audiences
  • Five Audiences
  • Humans
  • Humans
  • Search Engine Crawlers
  • Search Engine Crawlers
  • AI Crawlers
  • AI Crawlers
  • AI Agent
  • AI Agents
  • Automated Bots
  • Automated
  • Bots
  • Functions
  • What It Comes to Do
  • OrganicTraffic
  • Organic
  • Traffic
  • Local Search
  • Local Search
  • Build Search
  • Index
  • Build Search
  • Index
  • Generate AI
  • Overviews
  • Generate AI
  • Overviews
  • Copy Back
  • for Training
  • Model
  • Training
  • Build AI
  • Index
  • Build AI
  • Index
  • Real-TimeRetrieval
  • Real-Time
  • Retrieval
  • Act for Users
  • Address Lookups
  • Act on
  • Behalf of
  • Users
  • Automated
  • Information Services
  • Automated
  • Information
  • Services
  • Domains
  • Six Domains
  • Visits
  • 3/3–10/8
  • Visitor Types
  • 3 types
  • Search, AI, Maps
  • 15 types
  • 8 types
  • 7 types
  • 13 types
  • 13+ types
  • 20+ types
  • Most Frequent
  • Top four by count
  • 268,000
  • 20,000
  • 10,000
  • 9,388
  • 24.62M
  • 12.05M
  • 3.41M
  • 510,000
  • 24.48M
  • 11.58M
  • 10.6M
  • 5.45M
  • P
  • 2.82M
  • 760,000
  • 220,000
  • 130,000
  • 640,000
  • 11,000
  • 2,494
  • 1,624
  • Browsing
  • 17.95M
  • TollBit
  • 130,000
  • mcpbeat
  • 7,925
  • 5,683
  • Golemreach
  • AI Tools
  • 7.08M
  • Tracking
  • 150,000
  • SEO crawlers
  • 3.51M
  • Previews
  • 170,000
  • ID
  • EO
  • Original framework © 2026
  • Audience Strategy
  • Marketing
  • Audiences
  • Functions
  • Optimization
  • Domains
  • Visits
  • Visitor Types
  • Top Platforms
  • Organic Traffic
  • (from 8/26)
  • Local Search
  • Same Search Engine Crawlers,
  • shared by two functions
  • OrganicTraffic
  • Result of the Six
  • Optimizations
  • MEO
  • Map Engine
  • Optimization
  • Local SEO
  • GBP Optimization
  • SEO
  • SearchEngine
  • Optimization
  • SXO
  • Technical
  • SEO
  • AIO
  • AI Overview
  • Optimization
  • AEO
  • Answer Engine
  • Optimization
  • SGE Optimization
  • LLMO
  • LLM
  • Optimization
  • LLM SEO
  • S4 function
  • Builds AI index
  • (not GEO)
  • GEO: generative
  • answer visibility
  • See glossary
  • AEO
  • Answer Engine Optimization
  • Answer Engine Optimization
  • VSO (Voice Search), AAO, AXO,
  • AAIO (Optimization for AI Agents)
  • 309,826
  • 41.26M
  • 52.2M
  • 3.99M
  • 0.65M
  • 18.09M
  • 7.23M
  • Map Engine
  • Optimization
  • Search
  • Engine
  • Optimization
  • AI Overview
  • Optimization
  • Large
  • Language
  • Model
  • Optimization
  • Indexing
  • function,
  • not GEO
  • Answer
  • Engine
  • Optimization
  • Tracking

Related figures:Figure 1-2、Figure 0-2、Figure 5-1、Figure 2-1、Figure 7-3、Figure 1-3、Figure 1-4

Figure 1-1Panorama of the Five Marketing Audiences: Functions, Optimization Domains, and Measured Results
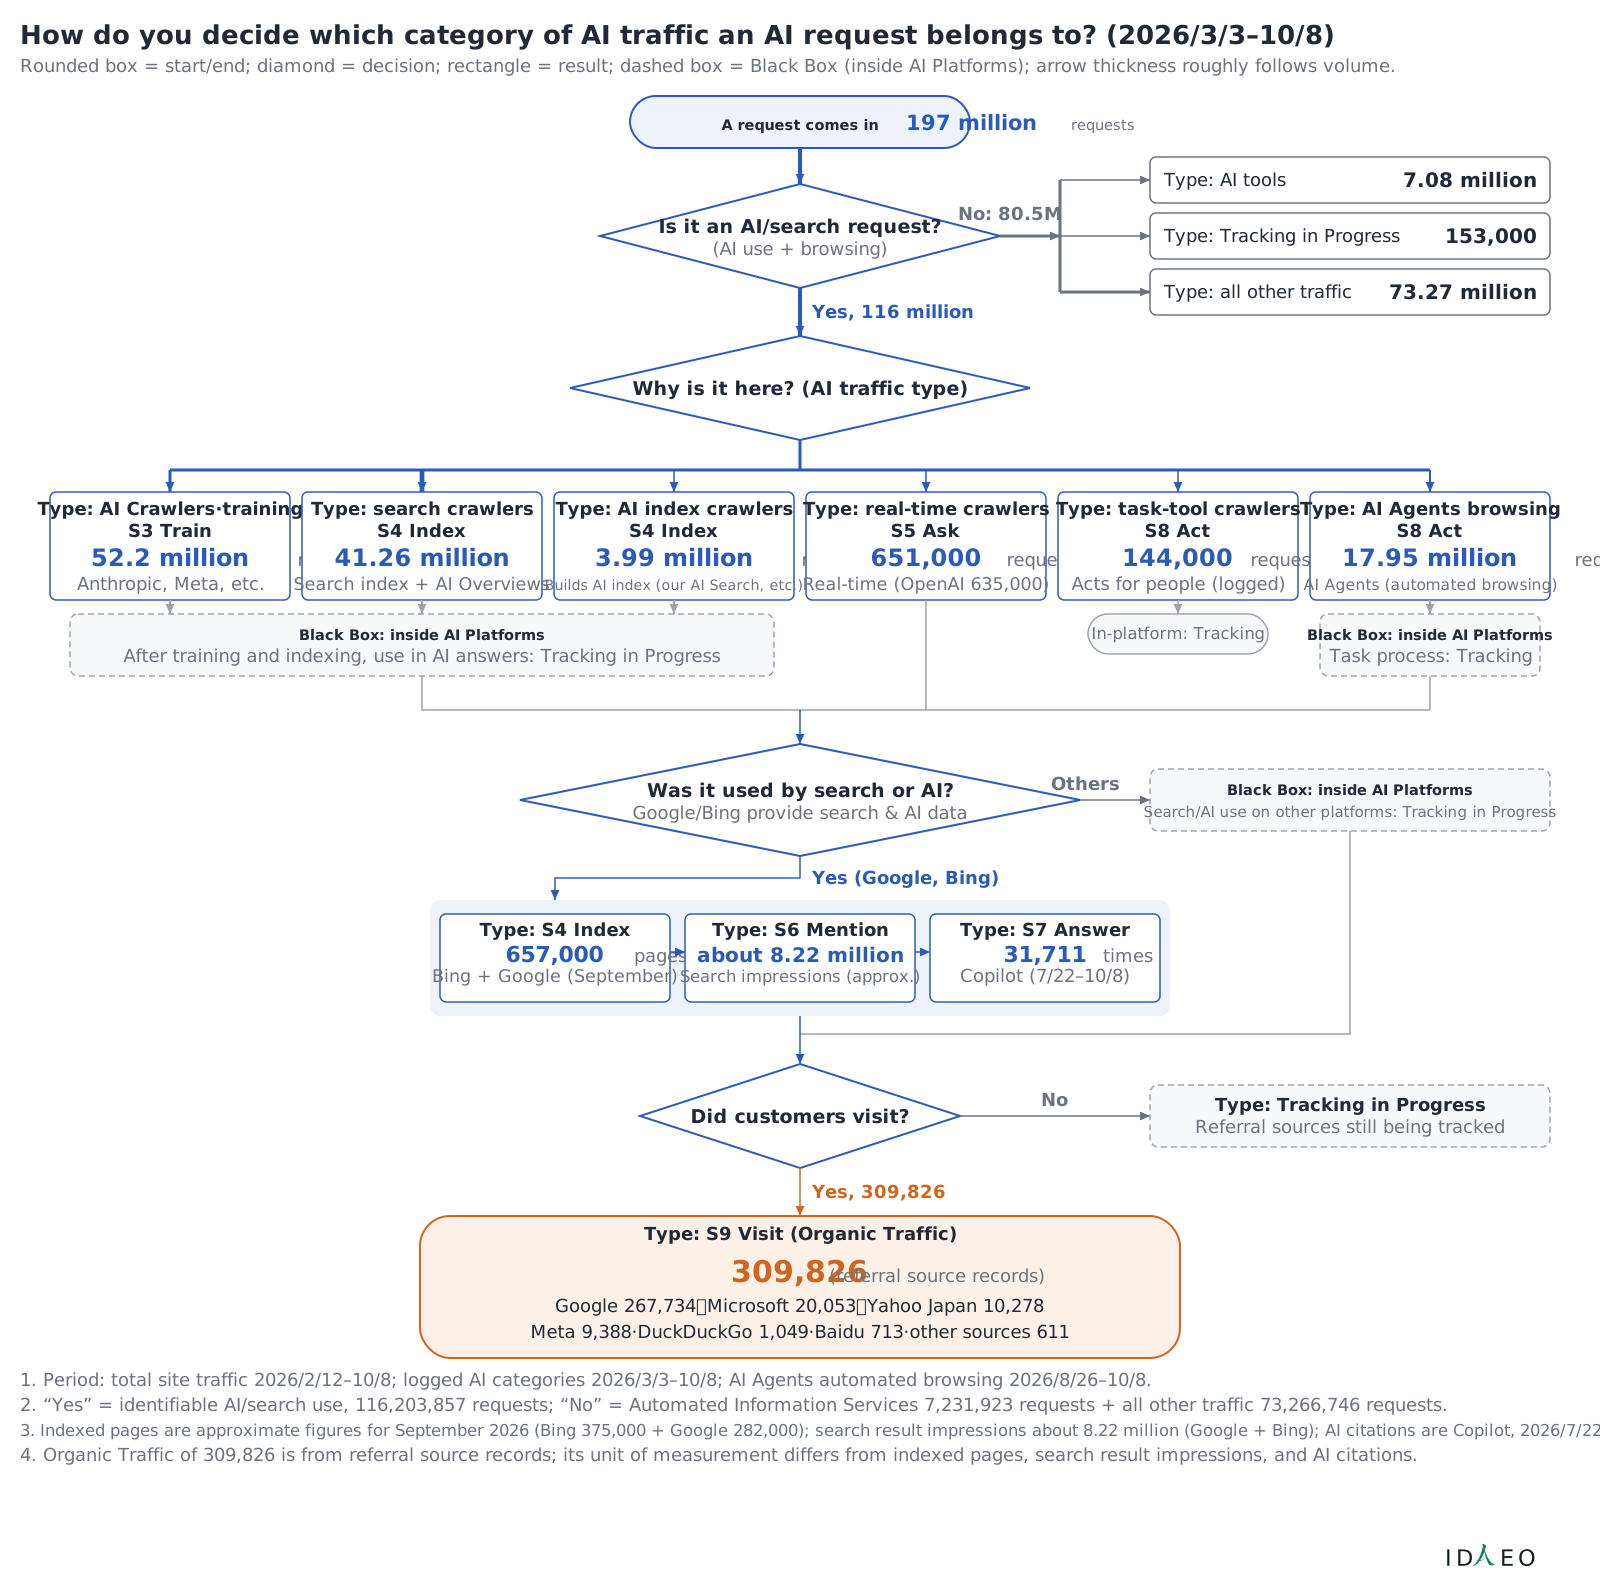
AI Traffic Classification Tree: How Do You Tell Which Type of AI Traffic an AI Request Belongs To? How do you decide which category of AI traffic an AI request belongs to?

How do you decide which category of AI traffic an AI request belongs to?

Start from the request at the top and read down through the classification basis and function; the end point is which of the Marketing Audiences it belongs to.

  • How do you decide which category of AI traffic an AI request belongs to? (2026/3/3–10/8)
  • Rounded box = start/end; diamond = decision; rectangle = result; dashed box = Black Box (inside AI Platforms); arrow thickness roughly follows volume.
  • A request comes in 197 million requests
  • Is it an AI/search request?
  • (AI use + browsing)
  • No: 80.5M
  • Type: AI tools
  • 7.08 million
  • Type: Tracking in Progress
  • 153,000
  • Type: all other traffic
  • 73.27 million
  • Yes, 116 million
  • Why is it here? (AI traffic type)
  • Type: AI Crawlers·training
  • S3 Train
  • 52.2 million requests
  • Anthropic, Meta, etc.
  • Type: search crawlers
  • S4 Index
  • 41.26 million requests
  • Search index + AI Overviews
  • Type: AI index crawlers
  • S4 Index
  • 3.99 million requests
  • Builds AI index (our AI Search, etc.)
  • Type: real-time crawlers
  • S5 Ask
  • 651,000 requests
  • Real-time (OpenAI 635,000)
  • Type: task-tool crawlers
  • S8 Act
  • 144,000 requests
  • Acts for people (logged)
  • Type: AI Agents browsing
  • S8 Act
  • 17.95 million requests
  • AI Agents (automated browsing)
  • In-platform: Tracking
  • Black Box: inside AI Platforms
  • After training and indexing, use in AI answers: Tracking in Progress
  • Black Box: inside AI Platforms
  • Task process: Tracking
  • Was it used by search or AI?
  • Google/Bing provide search & AI data
  • Others
  • Black Box: inside AI Platforms
  • Search/AI use on other platforms: Tracking in Progress
  • Yes (Google, Bing)
  • Type: S4 Index
  • 657,000 pages
  • Bing + Google (September)
  • Type: S6 Mention
  • about 8.22 million times
  • Search impressions (approx.)
  • Type: S7 Answer
  • 31,711 times
  • Copilot (7/22–10/8)
  • Did customers visit?
  • No
  • Type: Tracking in Progress
  • Referral sources still being tracked
  • Yes, 309,826
  • Type: S9 Visit (Organic Traffic)
  • 309,826 (referral source records)
  • Google 267,734・Microsoft 20,053・Yahoo Japan 10,278
  • 1. Period: total site traffic 2026/2/12–10/8; logged AI categories 2026/3/3–10/8; AI Agents automated browsing 2026/8/26–10/8.
  • 2. “Yes” = identifiable AI/search use, 116,203,857 requests; “No” = Automated Information Services 7,231,923 requests + all other traffic 73,266,746 requests.
  • 3. Indexed pages are approximate figures for September 2026 (Bing 375,000 + Google 282,000); search result impressions about 8.22 million (Google + Bing); AI citations are Copilot, 2026/7/22–10/8.
  • 4. Organic Traffic of 309,826 is from referral source records; its unit of measurement differs from indexed pages, search result impressions, and AI citations.
  • Meta 9,388·DuckDuckGo 1,049·Baidu 713·other sources 611
  • ID
  • EO

Related figures:Figure 1-1、Figure 1-3

AI Traffic Classification Tree: How Do You Tell Which Type of AI Traffic an AI Request Belongs To?
ItemValue
Type: AI tools7.08 million
Type: Tracking in Progress153,000
Type: all other traffic73.27 million
Type: AI Crawlers·training52.2 million
Type: search crawlers41.26 million
Type: AI index crawlers3.99 million
Type: real-time crawlers651,000
Type: task-tool crawlers144,000
Type: AI Agents browsing17.95 million
CSV
Figure 1-2AI Traffic Classification Tree: How Do You Tell Which Type of AI Traffic an AI Request Belongs To?
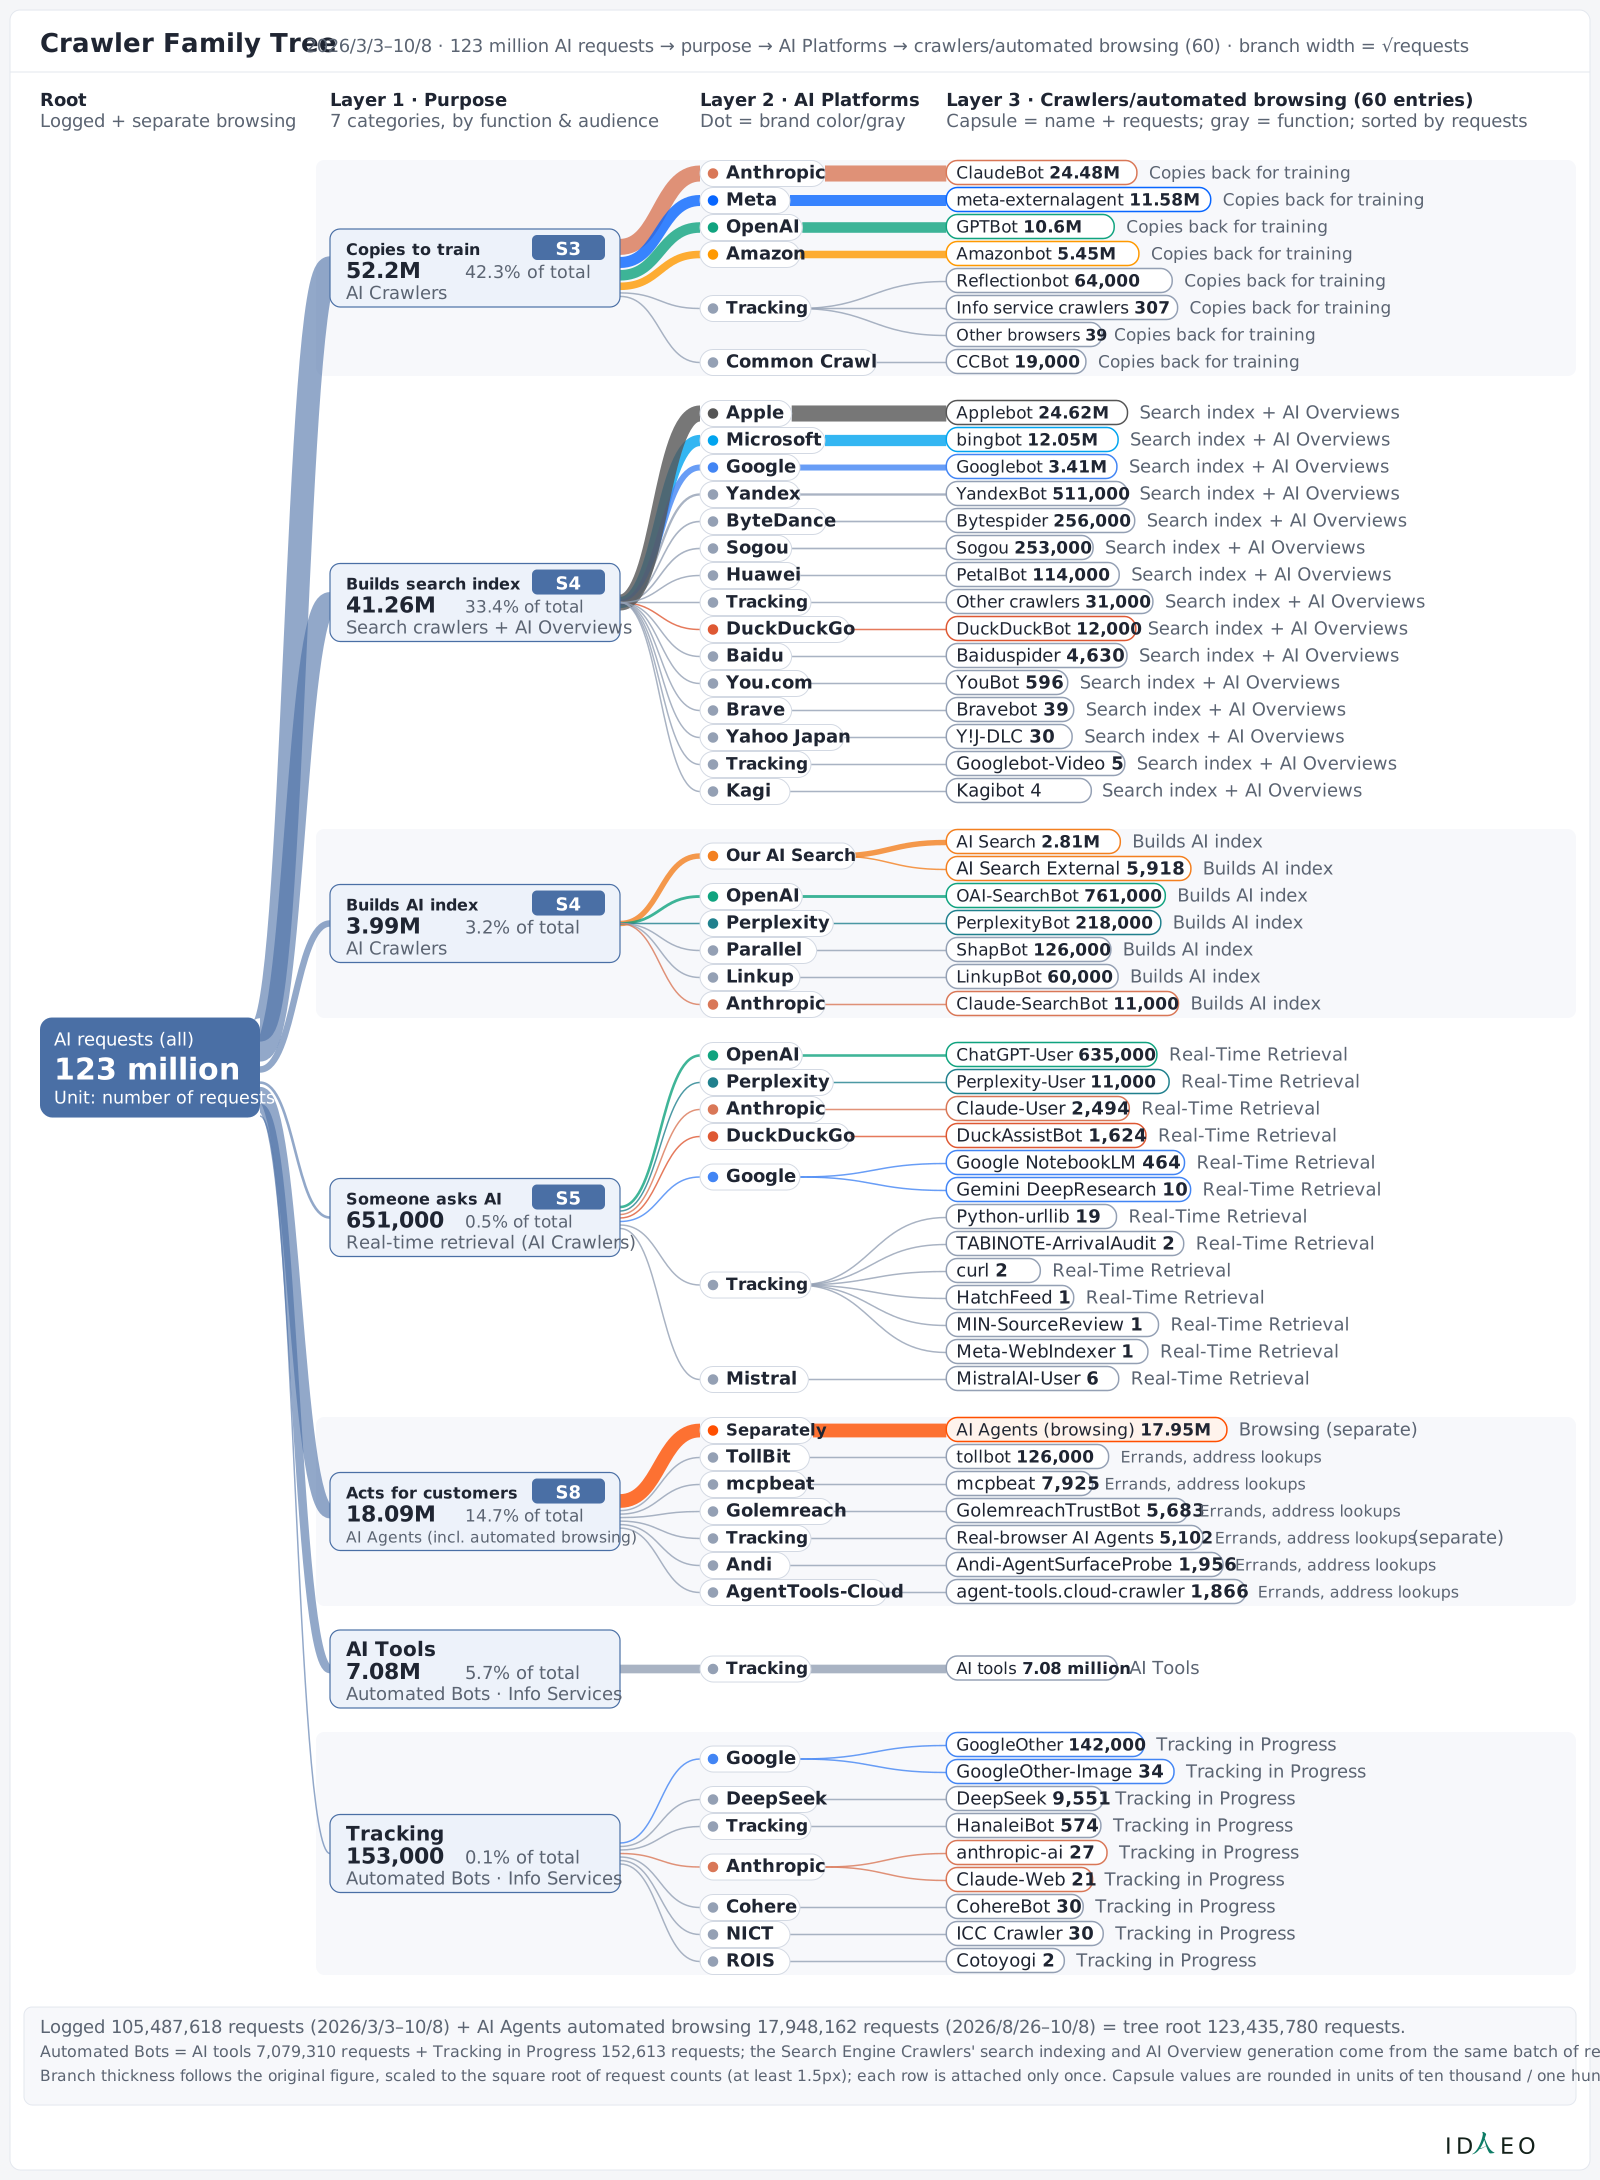
AI Platforms and Crawlers Family Tree: Which Companies and Which Crawlers Sit Under Each Function The AI Platforms and crawlers that correspond to each function

The AI Platforms and crawlers that correspond to each function

Read from root to branch: function, AI Platforms, and crawlers; the same company on different branches means it takes part in different functions.

  • Crawler Family Tree
  • 2026/3/3–10/8 · 123 million AI requests → purpose → AI Platforms → crawlers/automated browsing (60) · branch width = √requests
  • Root
  • Logged + separate browsing
  • Layer 1 · Purpose
  • 7 categories, by function & audience
  • Layer 2 · AI Platforms
  • Dot = brand color/gray
  • Layer 3 · Crawlers/automated browsing (60 entries)
  • Capsule = name + requests; gray = function; sorted by requests
  • AI requests (all)
  • 123 million
  • Unit: number of requests
  • Copies to train
  • S3
  • 52.2M
  • 42.3% of total
  • AI Crawlers
  • Builds search index
  • S4
  • 41.26M
  • 33.4% of total
  • Search crawlers + AI Overviews
  • Builds AI index
  • S4
  • 3.99M
  • 3.2% of total
  • AI Crawlers
  • Someone asks AI
  • S5
  • 651,000
  • 0.5% of total
  • Real-time retrieval (AI Crawlers)
  • Acts for customers
  • S8
  • 18.09M
  • 14.7% of total
  • AI Agents (incl. automated browsing)
  • AI Tools
  • 7.08M
  • 5.7% of total
  • Automated Bots · Info Services
  • Tracking
  • 153,000
  • 0.1% of total
  • Automated Bots · Info Services
  • Anthropic
  • Meta
  • OpenAI
  • Amazon
  • Tracking
  • Common Crawl
  • Microsoft
  • Google
  • Yandex
  • ByteDance
  • Sogou
  • Tracking
  • DuckDuckGo
  • Baidu
  • Brave
  • Yahoo Japan
  • Apple
  • Our AI Search
  • OpenAI
  • Perplexity
  • Parallel
  • Huawei
  • Linkup
  • Anthropic
  • You.com
  • Tracking
  • Kagi
  • OpenAI
  • Perplexity
  • Anthropic
  • DuckDuckGo
  • Google
  • Tracking
  • Mistral
  • Separately
  • TollBit
  • mcpbeat
  • Golemreach
  • Tracking
  • Andi
  • AgentTools-Cloud
  • Tracking
  • Google
  • DeepSeek
  • Tracking
  • Anthropic
  • Cohere
  • NICT
  • ROIS
  • ClaudeBot 24.48M
  • Copies back for training
  • meta-externalagent 11.58M
  • Copies back for training
  • GPTBot 10.6M
  • Copies back for training
  • Amazonbot 5.45M
  • Copies back for training
  • Reflectionbot 64,000
  • Copies back for training
  • Info service crawlers 307
  • Copies back for training
  • Other browsers 39
  • Copies back for training
  • CCBot 19,000
  • Copies back for training
  • bingbot 12.05M
  • Search index + AI Overviews
  • Googlebot 3.41M
  • Search index + AI Overviews
  • YandexBot 511,000
  • Search index + AI Overviews
  • Bytespider 256,000
  • Search index + AI Overviews
  • Sogou 253,000
  • Search index + AI Overviews
  • Other crawlers 31,000
  • Search index + AI Overviews
  • DuckDuckBot 12,000
  • Search index + AI Overviews
  • Baiduspider 4,630
  • Search index + AI Overviews
  • Bravebot 39
  • Search index + AI Overviews
  • Y!J-DLC 30
  • Search index + AI Overviews
  • Applebot 24.62M
  • Search index + AI Overviews
  • AI Search 2.81M
  • Builds AI index
  • AI Search External 5,918
  • Builds AI index
  • OAI-SearchBot 761,000
  • Builds AI index
  • PerplexityBot 218,000
  • Builds AI index
  • ShapBot 126,000
  • Builds AI index
  • PetalBot 114,000
  • Search index + AI Overviews
  • LinkupBot 60,000
  • Builds AI index
  • Claude-SearchBot 11,000
  • Builds AI index
  • YouBot 596
  • Search index + AI Overviews
  • Googlebot-Video 5
  • Search index + AI Overviews
  • Kagibot 4
  • Search index + AI Overviews
  • ChatGPT-User 635,000
  • Real-Time Retrieval
  • Perplexity-User 11,000
  • Real-Time Retrieval
  • Claude-User 2,494
  • Real-Time Retrieval
  • DuckAssistBot 1,624
  • Real-Time Retrieval
  • Google NotebookLM 464
  • Real-Time Retrieval
  • Gemini DeepResearch 10
  • Real-Time Retrieval
  • Python-urllib 19
  • Real-Time Retrieval
  • TABINOTE-ArrivalAudit 2
  • Real-Time Retrieval
  • curl 2
  • Real-Time Retrieval
  • HatchFeed 1
  • Real-Time Retrieval
  • MIN-SourceReview 1
  • Real-Time Retrieval
  • Meta-WebIndexer 1
  • Real-Time Retrieval
  • MistralAI-User 6
  • Real-Time Retrieval
  • AI Agents (browsing) 17.95M
  • Browsing (separate)
  • tollbot 126,000
  • Errands, address lookups
  • mcpbeat 7,925
  • Errands, address lookups
  • GolemreachTrustBot 5,683
  • Errands, address lookups
  • Real-browser AI Agents 5,102
  • Errands, address lookups
  • (separate)
  • Andi-AgentSurfaceProbe 1,956
  • Errands, address lookups
  • agent-tools.cloud-crawler 1,866
  • Errands, address lookups
  • AI tools 7.08 million
  • AI Tools
  • GoogleOther 142,000
  • Tracking in Progress
  • GoogleOther-Image 34
  • Tracking in Progress
  • DeepSeek 9,551
  • Tracking in Progress
  • HanaleiBot 574
  • Tracking in Progress
  • anthropic-ai 27
  • Tracking in Progress
  • Claude-Web 21
  • Tracking in Progress
  • CohereBot 30
  • Tracking in Progress
  • ICC Crawler 30
  • Tracking in Progress
  • Cotoyogi 2
  • Tracking in Progress
  • Logged 105,487,618 requests (2026/3/3–10/8) + AI Agents automated browsing 17,948,162 requests (2026/8/26–10/8) = tree root 123,435,780 requests.
  • Automated Bots = AI tools 7,079,310 requests + Tracking in Progress 152,613 requests; the Search Engine Crawlers' search indexing and AI Overview generation come from the same batch of requests.
  • Branch thickness follows the original figure, scaled to the square root of request counts (at least 1.5px); each row is attached only once. Capsule values are rounded in units of ten thousand / one hundred million.
  • ID
  • EO

Related figures:Figure 1-2、Figure 1-4、Figure 1-1

AI Platforms and Crawlers Family Tree: Which Companies and Which Crawlers Sit Under Each Function
ItemValue
ClaudeBot24.48M
meta-externalagent11.58M
GPTBot10.6M
Amazonbot5.45M
Reflectionbot64,000
Info service crawlers307
Other browsers39
CCBot19,000
bingbot12.05M
Googlebot3.41M
YandexBot511,000
Bytespider256,000
Sogou253,000
Other crawlers31,000
DuckDuckBot12,000
Baiduspider4,630
Bravebot39
Y!J-DLC30
Applebot24.62M
AI Search2.81M
AI Search External5,918
OAI-SearchBot761,000
PerplexityBot218,000
ShapBot126,000
PetalBot114,000
LinkupBot60,000
Claude-SearchBot11,000
YouBot596
Googlebot-Video5
Kagibot4
ChatGPT-User635,000
Perplexity-User11,000
Claude-User2,494
DuckAssistBot1,624
Google NotebookLM464
Gemini DeepResearch10
Python-urllib19
TABINOTE-ArrivalAudit2
curl2
HatchFeed1
MIN-SourceReview1
Meta-WebIndexer1
MistralAI-User6
AI Agents (browsing)17.95M
tollbot126,000
mcpbeat7,925
GolemreachTrustBot5,683
Real-browser AI Agents5,102
Andi-AgentSurfaceProbe1,956
agent-tools.cloud-crawler1,866
AI tools7.08M
GoogleOther142,000
GoogleOther-Image34
DeepSeek9,551
HanaleiBot574
anthropic-ai27
Claude-Web21
CohereBot30
ICC Crawler30
Cotoyogi2
CSV
Figure 1-3AI Platforms and Crawlers Family Tree: Which Companies and Which Crawlers Sit Under Each Function
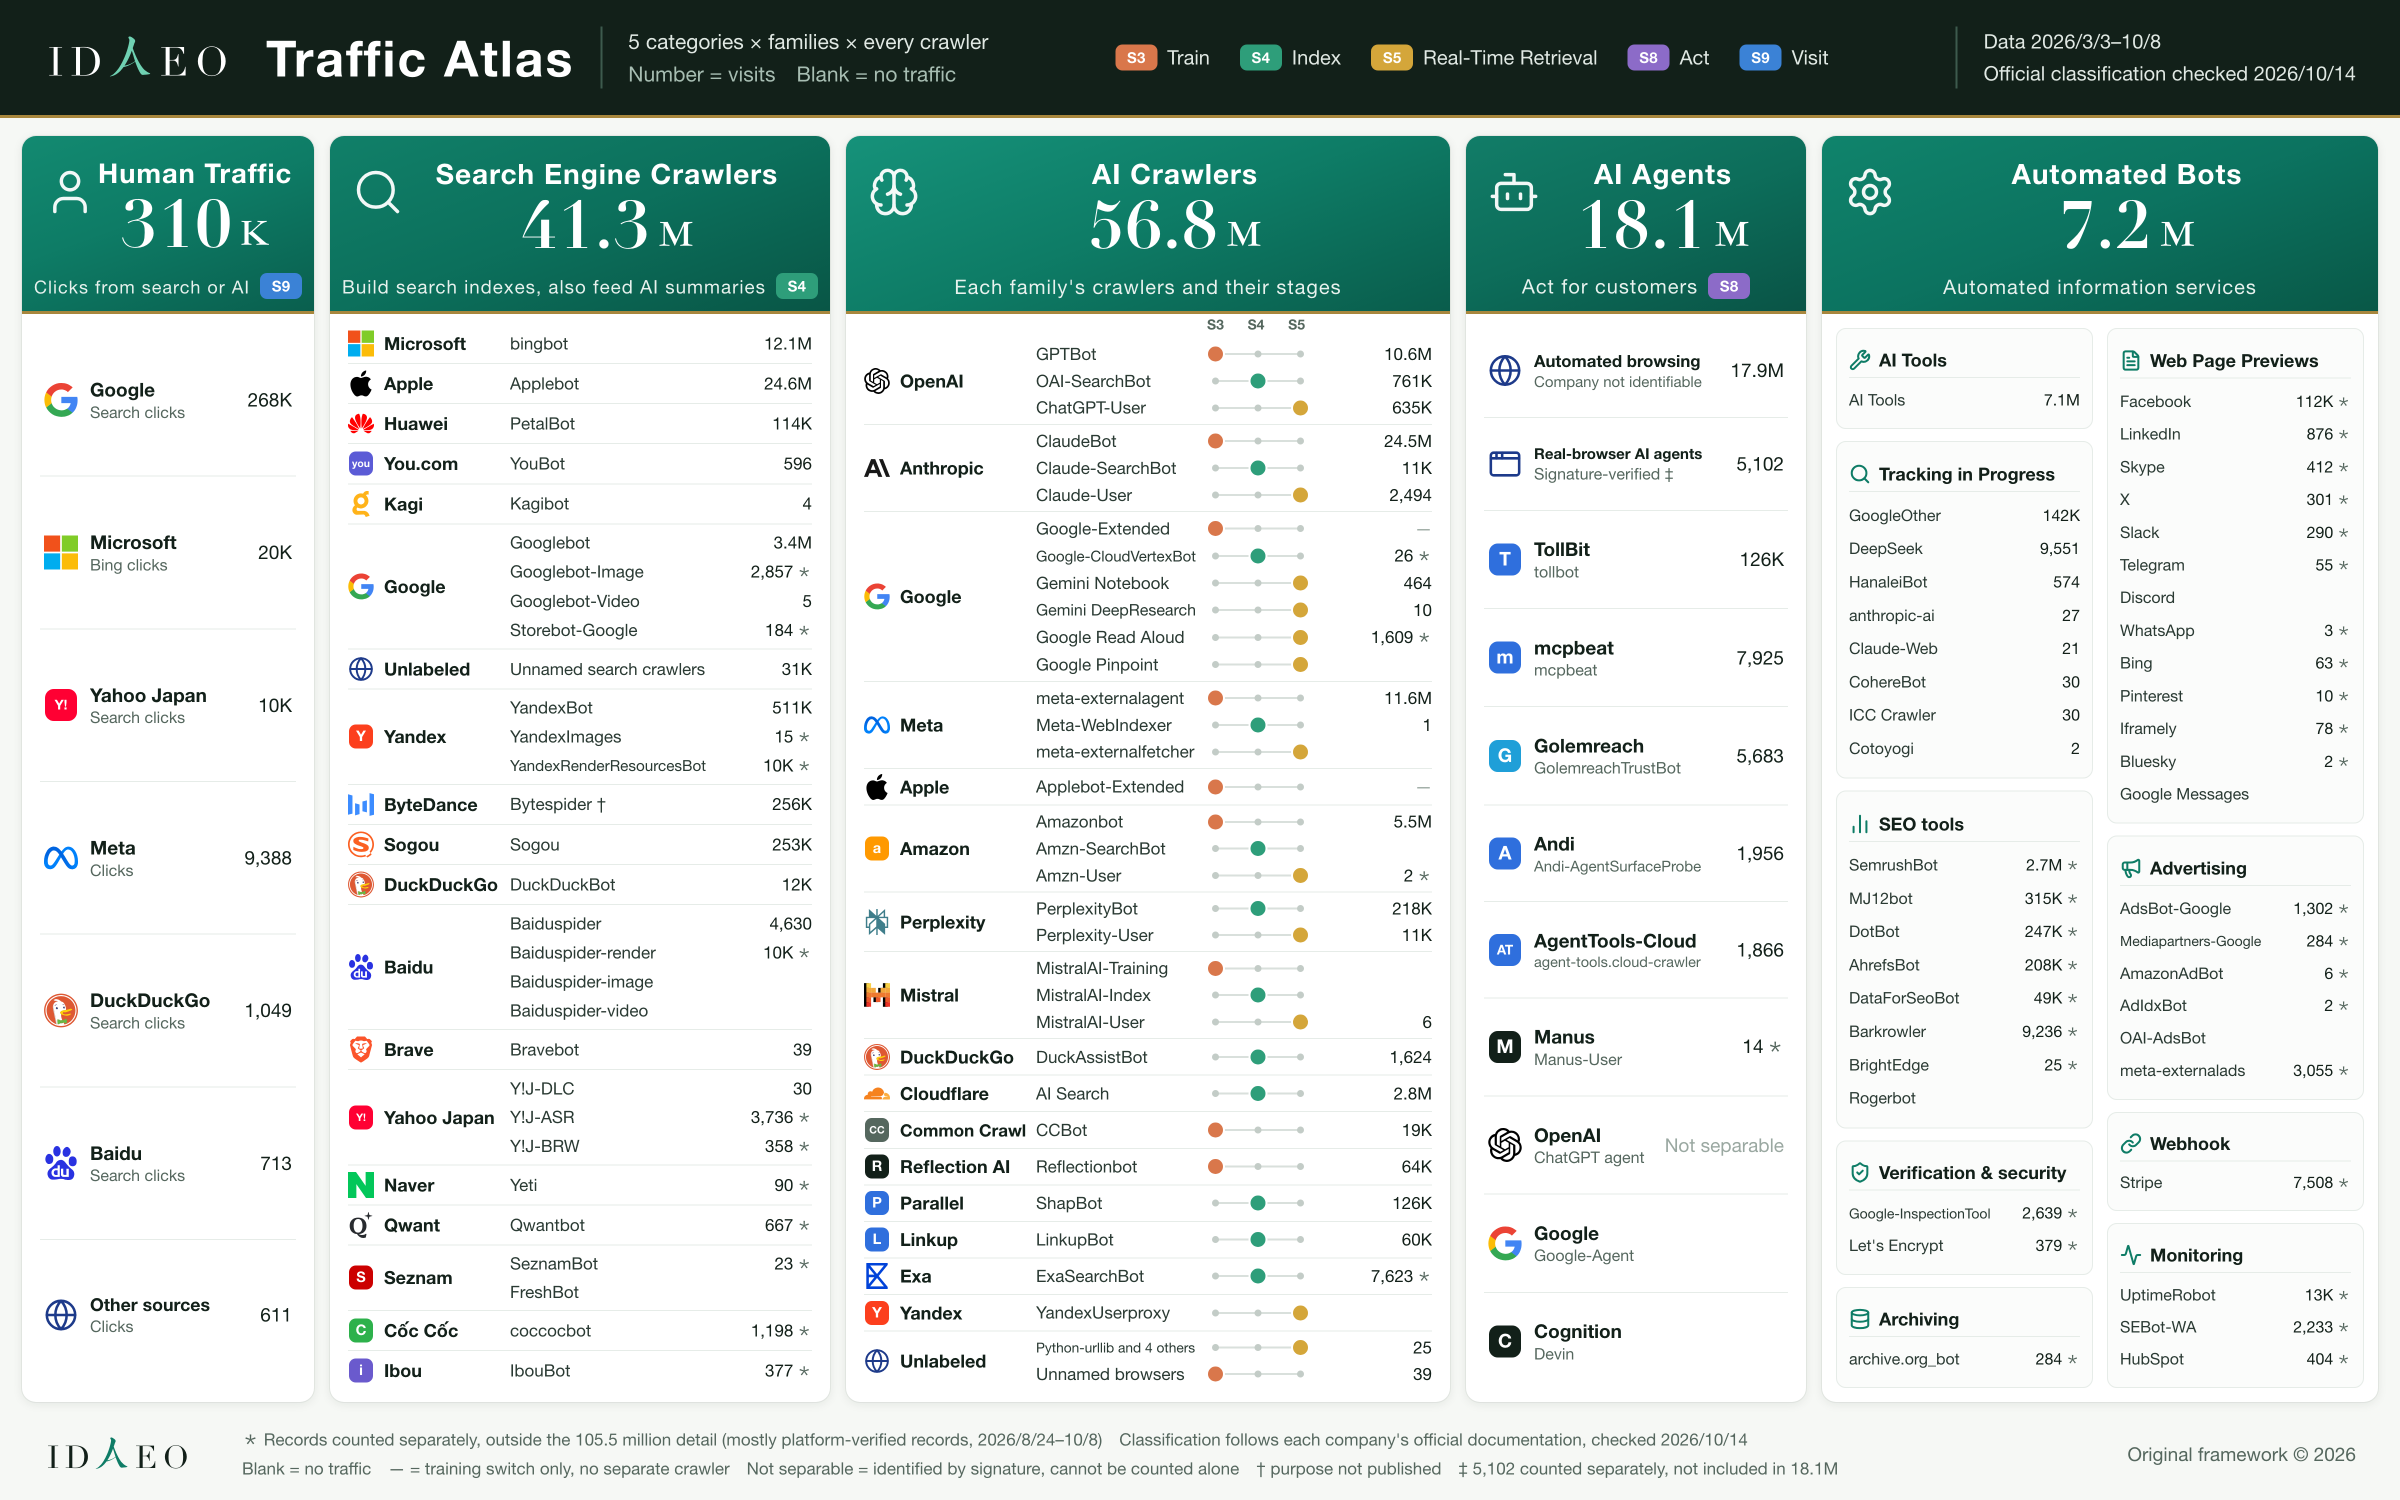
IDAEO Traffic Atlas: Five Traffic Categories, Each Family, and Every Crawler Answers “What kinds of AI Crawlers are there?” and lists every traffic source at once: which companies appear in each of the five traffic categories, which crawlers each company sends, and how many visits each made

Answers “What kinds of AI Crawlers are there?” and lists every traffic source at once: which companies appear in each of the five traffic categories, which crawlers each company sends, and how many visits each made

From left to right are the five traffic categories, with each category's total at the top of its column; within a column, rows are grouped by family, one crawler per row with its visit count, and a blank means no traffic. In the AI Crawlers column, the dot on the three-position track shows which journey step that crawler sits at. This figure follows each company's official documentation (checked Oct 14, 2026), which places Applebot, PetalBot, YouBot, and Kagibot under Search Engine Crawlers, the same classification used in the main text. Data period Mar 3, 2026–Oct 8; * marks records counted separately.

    Related figures:Figure 1-3、Figure 1-1

    Figure 1-4IDAEO Traffic Atlas: Five Traffic Categories, Each Family, and Every Crawler

    Journey Design

    Which steps to take

    5
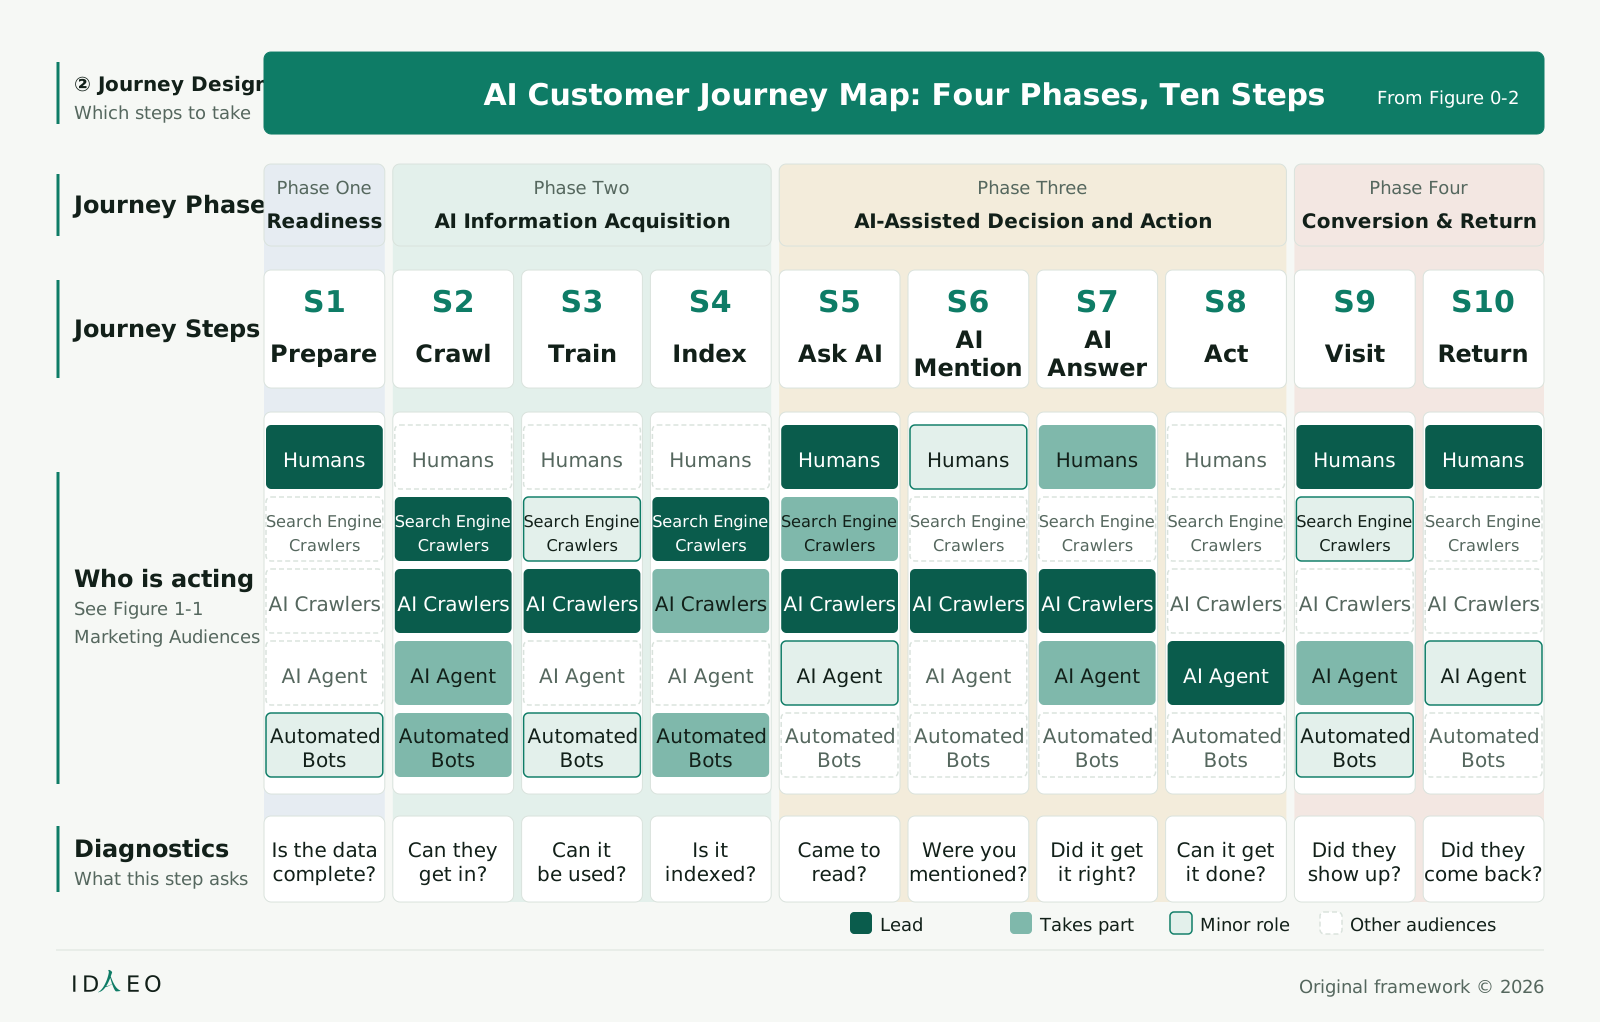
    AI Customer Journey Map: Four Phases, Ten Steps AI Customer Journey: Four Phases, Ten Steps, mapped against Marketing Audiences and Journey Diagnostics

    AI Customer Journey: Four Phases, Ten Steps, mapped against Marketing Audiences and Journey Diagnostics

    Read top to bottom: journey phase, journey step, who is acting, Journey Diagnostics. The five small cells in each step stand for the Five Marketing Audiences in order: dark green is the lead, medium green takes part, light green is slightly involved, and gray is the remaining roles.

    • ② Journey Design
    • Which steps to take
    • AI Customer Journey Map: Four Phases, Ten Steps
    • From Figure 0-2
    • Journey Phases
    • Phase One
    • Readiness
    • Phase Two
    • AI Information Acquisition
    • Phase Three
    • AI-Assisted Decision and Action
    • Phase Four
    • Conversion & Return
    • Journey Steps
    • S1
    • Prepare
    • S2
    • Crawl
    • S3
    • Train
    • S4
    • Index
    • S5
    • Ask AI
    • S6
    • AIMention
    • S7
    • AIAnswer
    • S8
    • Act
    • S9
    • Visit
    • S10
    • Return
    • Who is acting
    • See Figure 1-1
    • Marketing Audiences
    • Humans
    • Search EngineCrawlers
    • AI Crawlers
    • AI Agent
    • AutomatedBots
    • Humans
    • Search EngineCrawlers
    • AI Crawlers
    • AI Agent
    • AutomatedBots
    • Humans
    • Search EngineCrawlers
    • AI Crawlers
    • AI Agent
    • AutomatedBots
    • Humans
    • Search EngineCrawlers
    • AI Crawlers
    • AI Agent
    • AutomatedBots
    • Humans
    • Search EngineCrawlers
    • AI Crawlers
    • AI Agent
    • AutomatedBots
    • Humans
    • Search EngineCrawlers
    • AI Crawlers
    • AI Agent
    • AutomatedBots
    • Humans
    • Search EngineCrawlers
    • AI Crawlers
    • AI Agent
    • AutomatedBots
    • Humans
    • Search EngineCrawlers
    • AI Crawlers
    • AI Agent
    • AutomatedBots
    • Humans
    • Search EngineCrawlers
    • AI Crawlers
    • AI Agent
    • AutomatedBots
    • Humans
    • Search EngineCrawlers
    • AI Crawlers
    • AI Agent
    • AutomatedBots
    • Diagnostics
    • What this step asks
    • Is the datacomplete?
    • Can theyget in?
    • Can itbe used?
    • Is itindexed?
    • Came toread?
    • Were youmentioned?
    • Did it getit right?
    • Can it getit done?
    • Did theyshow up?
    • Did theycome back?
    • Lead
    • Takes part
    • Minor role
    • Other audiences
    • ID
    • EO
    • Original framework © 2026

    Related figures:Figure 2-2、Figure 8-1、Figure 0-2、Figure 1-1、Figure 5-1

    Figure 2-1AI Customer Journey Map: Four Phases, Ten Steps
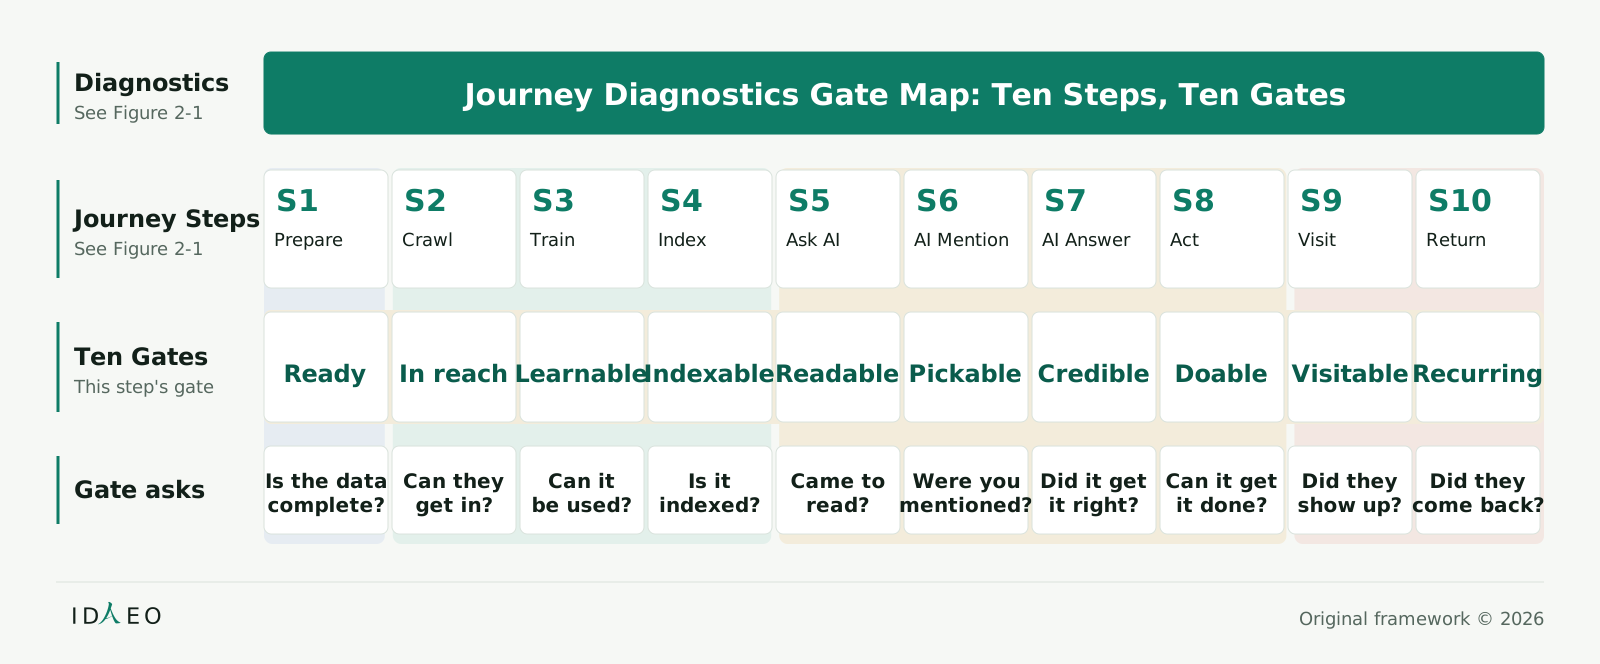
    Journey Diagnostics Gate Map: Ten Steps, Ten Gates Ten steps and Ten Diagnostic Gates: one gate per step, each with a diagnostic question

    Ten steps and Ten Diagnostic Gates: one gate per step, each with a diagnostic question

    Read the journey steps left to right; below each are the gate name and diagnostic question.

    • Diagnostics
    • See Figure 2-1
    • Journey Diagnostics Gate Map: Ten Steps, Ten Gates
    • Journey Steps
    • See Figure 2-1
    • S1
    • Prepare
    • S2
    • Crawl
    • S3
    • Train
    • S4
    • Index
    • S5
    • Ask AI
    • S6
    • AI Mention
    • S7
    • AI Answer
    • S8
    • Act
    • S9
    • Visit
    • S10
    • Return
    • Ten Gates
    • This step's gate
    • Ready
    • In reach
    • Learnable
    • Indexable
    • Readable
    • Pickable
    • Credible
    • Doable
    • Visitable
    • Recurring
    • Gate asks
    • Is the datacomplete?
    • Can theyget in?
    • Can itbe used?
    • Is itindexed?
    • Came toread?
    • Were youmentioned?
    • Did it getit right?
    • Can it getit done?
    • Did theyshow up?
    • Did theycome back?
    • ID
    • EO
    • Original framework © 2026

    Related figures:Figure 2-1、Figure 2-3、Figure 0-2、Figure 5-2

    Figure 2-2Journey Diagnostics Gate Map: Ten Steps, Ten Gates
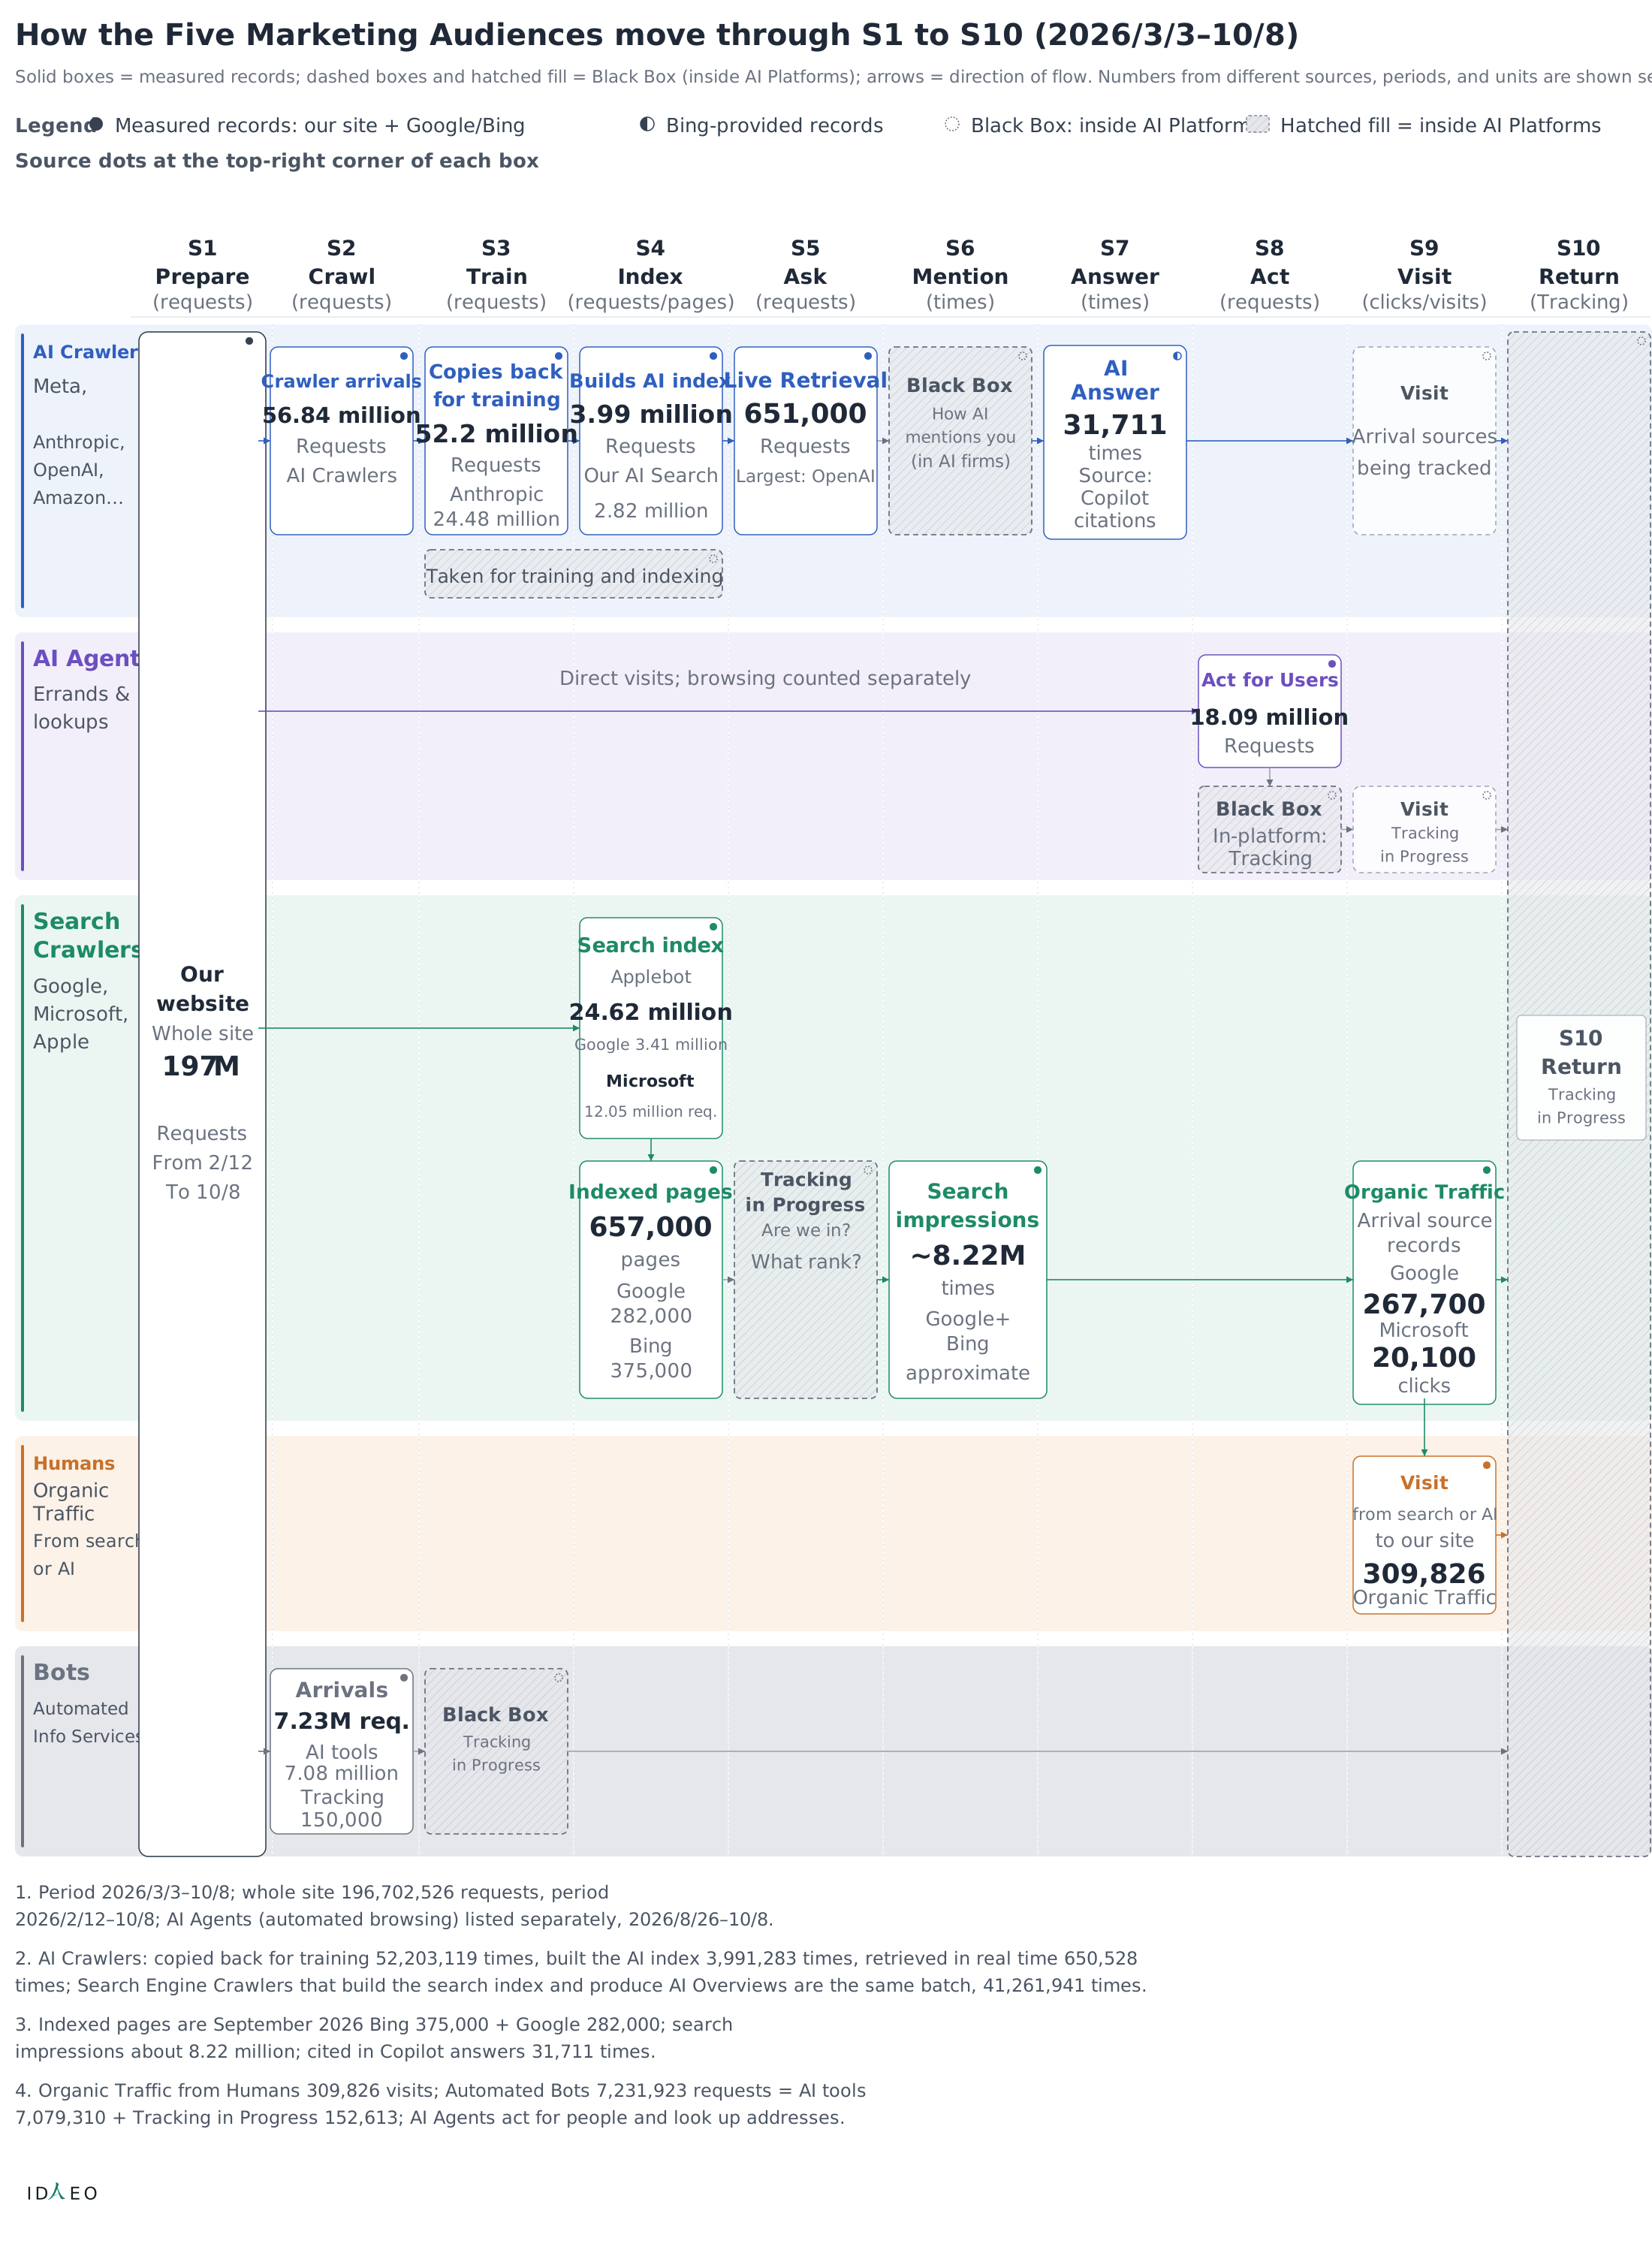
    Five Marketing Audiences Journey Swimlane Diagram How the Five Marketing Audiences move through S1 to S10

    How the Five Marketing Audiences move through S1 to S10

    Each row is one of the Marketing Audiences, with S1–S10 running across; first see which steps it passes through, then the records at each step and the scope of measured tracking.

    • How the Five Marketing Audiences move through S1 to S10 (2026/3/3–10/8)
    • Solid boxes = measured records; dashed boxes and hatched fill = Black Box (inside AI Platforms); arrows = direction of flow. Numbers from different sources, periods, and units are shown separately.
    • Legend
    • Measured records: our site + Google/Bing
    • Bing-provided records
    • Black Box: inside AI Platforms
    • Hatched fill = inside AI Platforms
    • Source dots at the top-right corner of each box
    • S1 Prepare
    • (requests)
    • S2 Crawl
    • (requests)
    • S3 Train
    • (requests)
    • S4 Index
    • (requests/pages)
    • S5 Ask
    • (requests)
    • S6 Mention
    • (times)
    • S7 Answer
    • (times)
    • S8 Act
    • (requests)
    • S9 Visit
    • (clicks/visits)
    • S10 Return
    • (Tracking)
    • AI Crawlers
    • Meta,
    • Anthropic,
    • OpenAI,
    • Amazon…
    • AI Agent
    • Errands &
    • lookups
    • SearchCrawlers
    • Google,
    • Microsoft,
    • Apple
    • Humans
    • OrganicTraffic
    • From searchor AI
    • Bots
    • AutomatedInfo Services
    • Ourwebsite
    • Whole site
    • 197M
    • Requests
    • From 2/12
    • To 10/8
    • Crawler arrivals
    • 56.84 million
    • Requests
    • AI Crawlers
    • Copies backfor training
    • 52.2 million
    • Requests
    • Anthropic
    • 24.48 million
    • Builds AI index
    • 3.99 million
    • Requests
    • Our AI Search
    • 2.82 million
    • Taken for training and indexing
    • Live Retrieval
    • 651,000
    • Requests
    • Largest: OpenAI
    • Black Box
    • How AImentions you
    • (in AI firms)
    • AIAnswer
    • 31,711
    • times
    • Source: Copilot
    • citations
    • Visit
    • Arrival sourcesbeing tracked
    • Direct visits; browsing counted separately
    • Act for Users
    • 18.09 million
    • Requests
    • Black Box
    • In-platform:Tracking
    • Visit
    • Trackingin Progress
    • Search index
    • Applebot
    • 24.62 million
    • Google 3.41 million
    • Microsoft
    • 12.05 million req.
    • Indexed pages
    • 657,000
    • pages
    • Google 282,000
    • Bing 375,000
    • Trackingin Progress
    • Are we in?
    • What rank?
    • Searchimpressions
    • ~8.22M
    • times
    • Google+Bing
    • approximate
    • Organic Traffic
    • Arrival sourcerecords
    • Google
    • 267,700
    • Microsoft
    • 20,100
    • clicks
    • Visit
    • from search or AI
    • to our site
    • 309,826
    • Organic Traffic
    • Arrivals
    • 7.23M req.
    • AI tools7.08 million
    • Tracking150,000
    • Black Box
    • Trackingin Progress
    • S10 Return
    • Trackingin Progress
    • 1. Period 2026/3/3–10/8; whole site 196,702,526 requests, period2026/2/12–10/8; AI Agents (automated browsing) listed separately, 2026/8/26–10/8.
    • 2. AI Crawlers: copied back for training 52,203,119 times, built the AI index 3,991,283 times, retrieved in real time 650,528times; Search Engine Crawlers that build the search index and produce AI Overviews are the same batch, 41,261,941 times.
    • 3. Indexed pages are September 2026 Bing 375,000 + Google 282,000; searchimpressions about 8.22 million; cited in Copilot answers 31,711 times.
    • 4. Organic Traffic from Humans 309,826 visits; Automated Bots 7,231,923 requests = AI tools7,079,310 + Tracking in Progress 152,613; AI Agents act for people and look up addresses.
    • ID
    • EO

    Related figures:Figure 2-2、Figure 2-4

    Figure 2-3Five Marketing Audiences Journey Swimlane Diagram
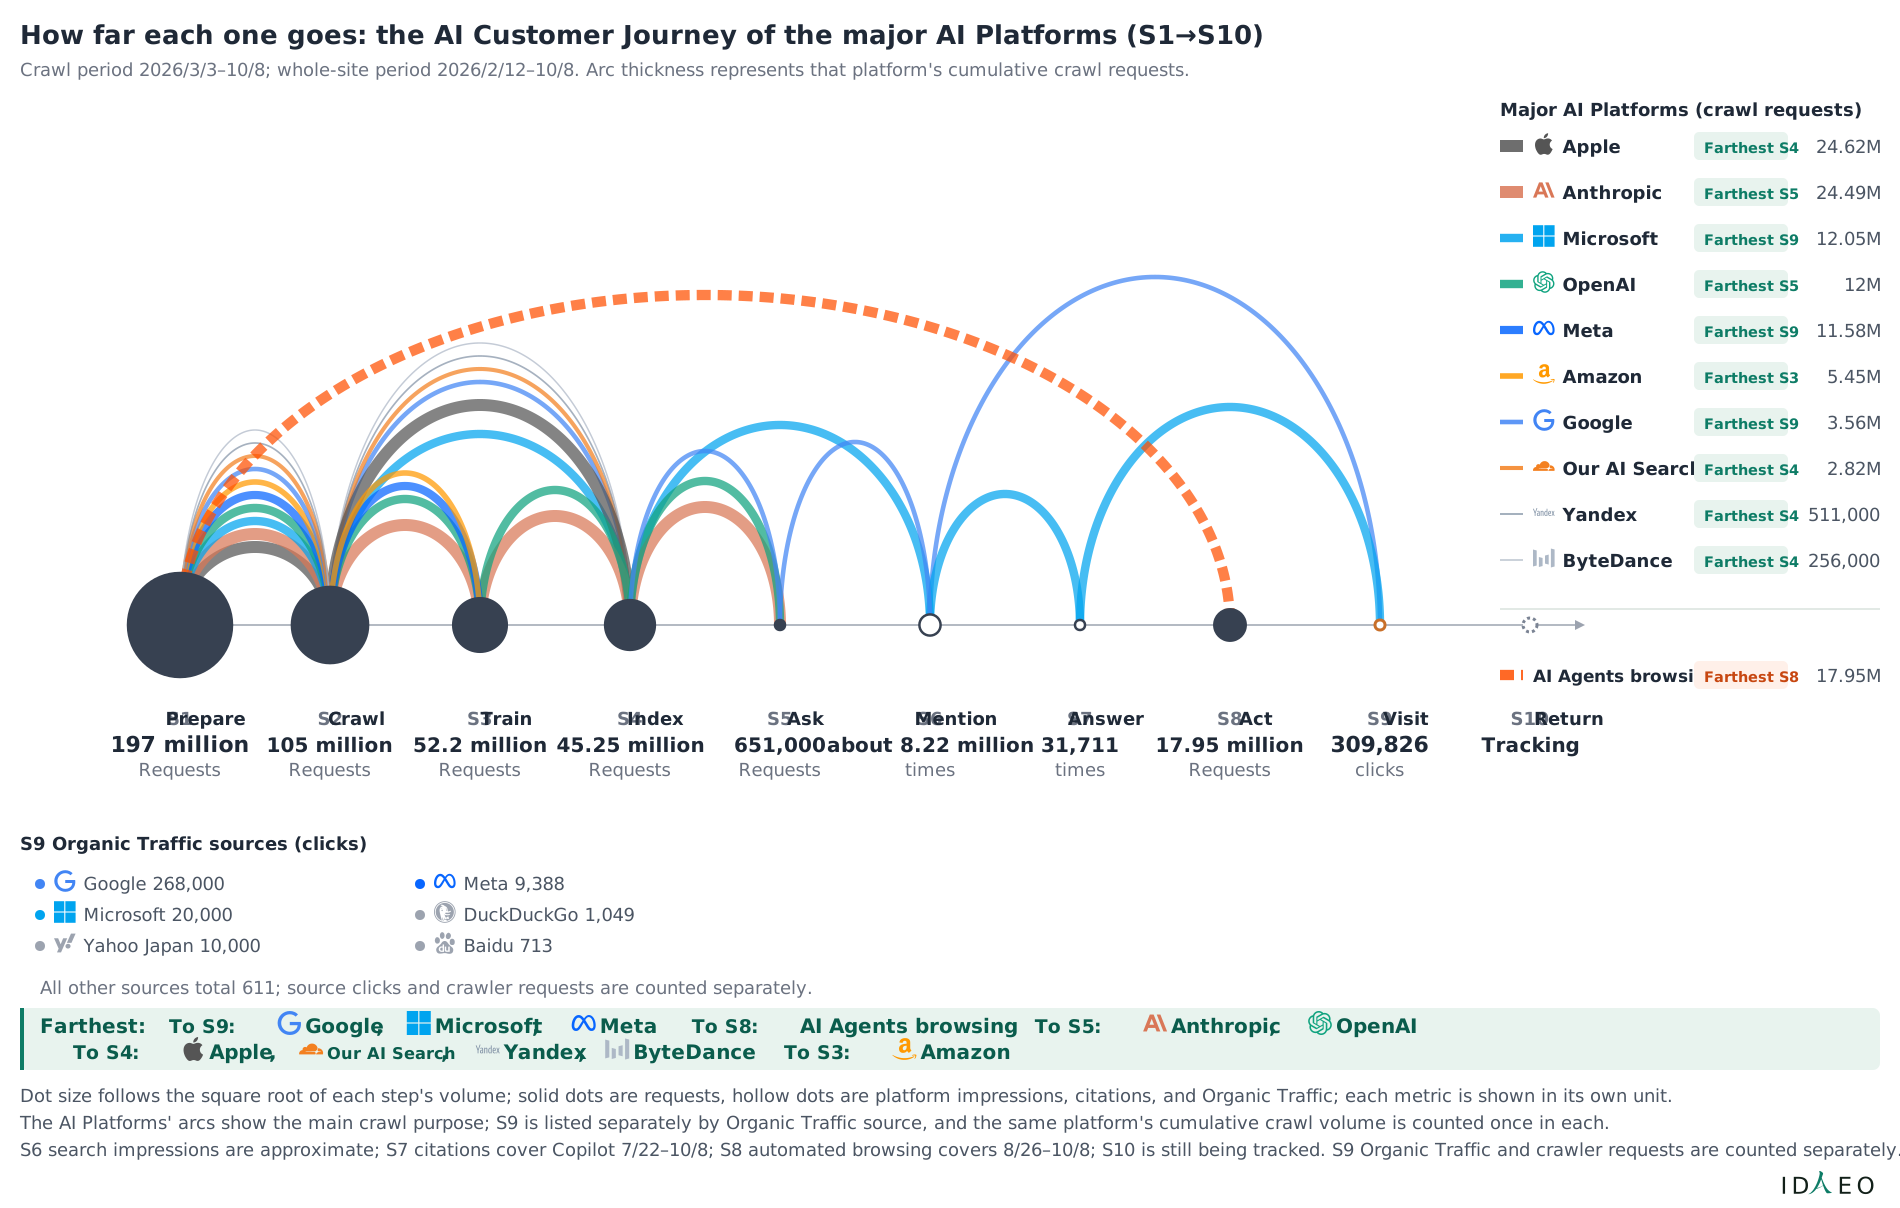
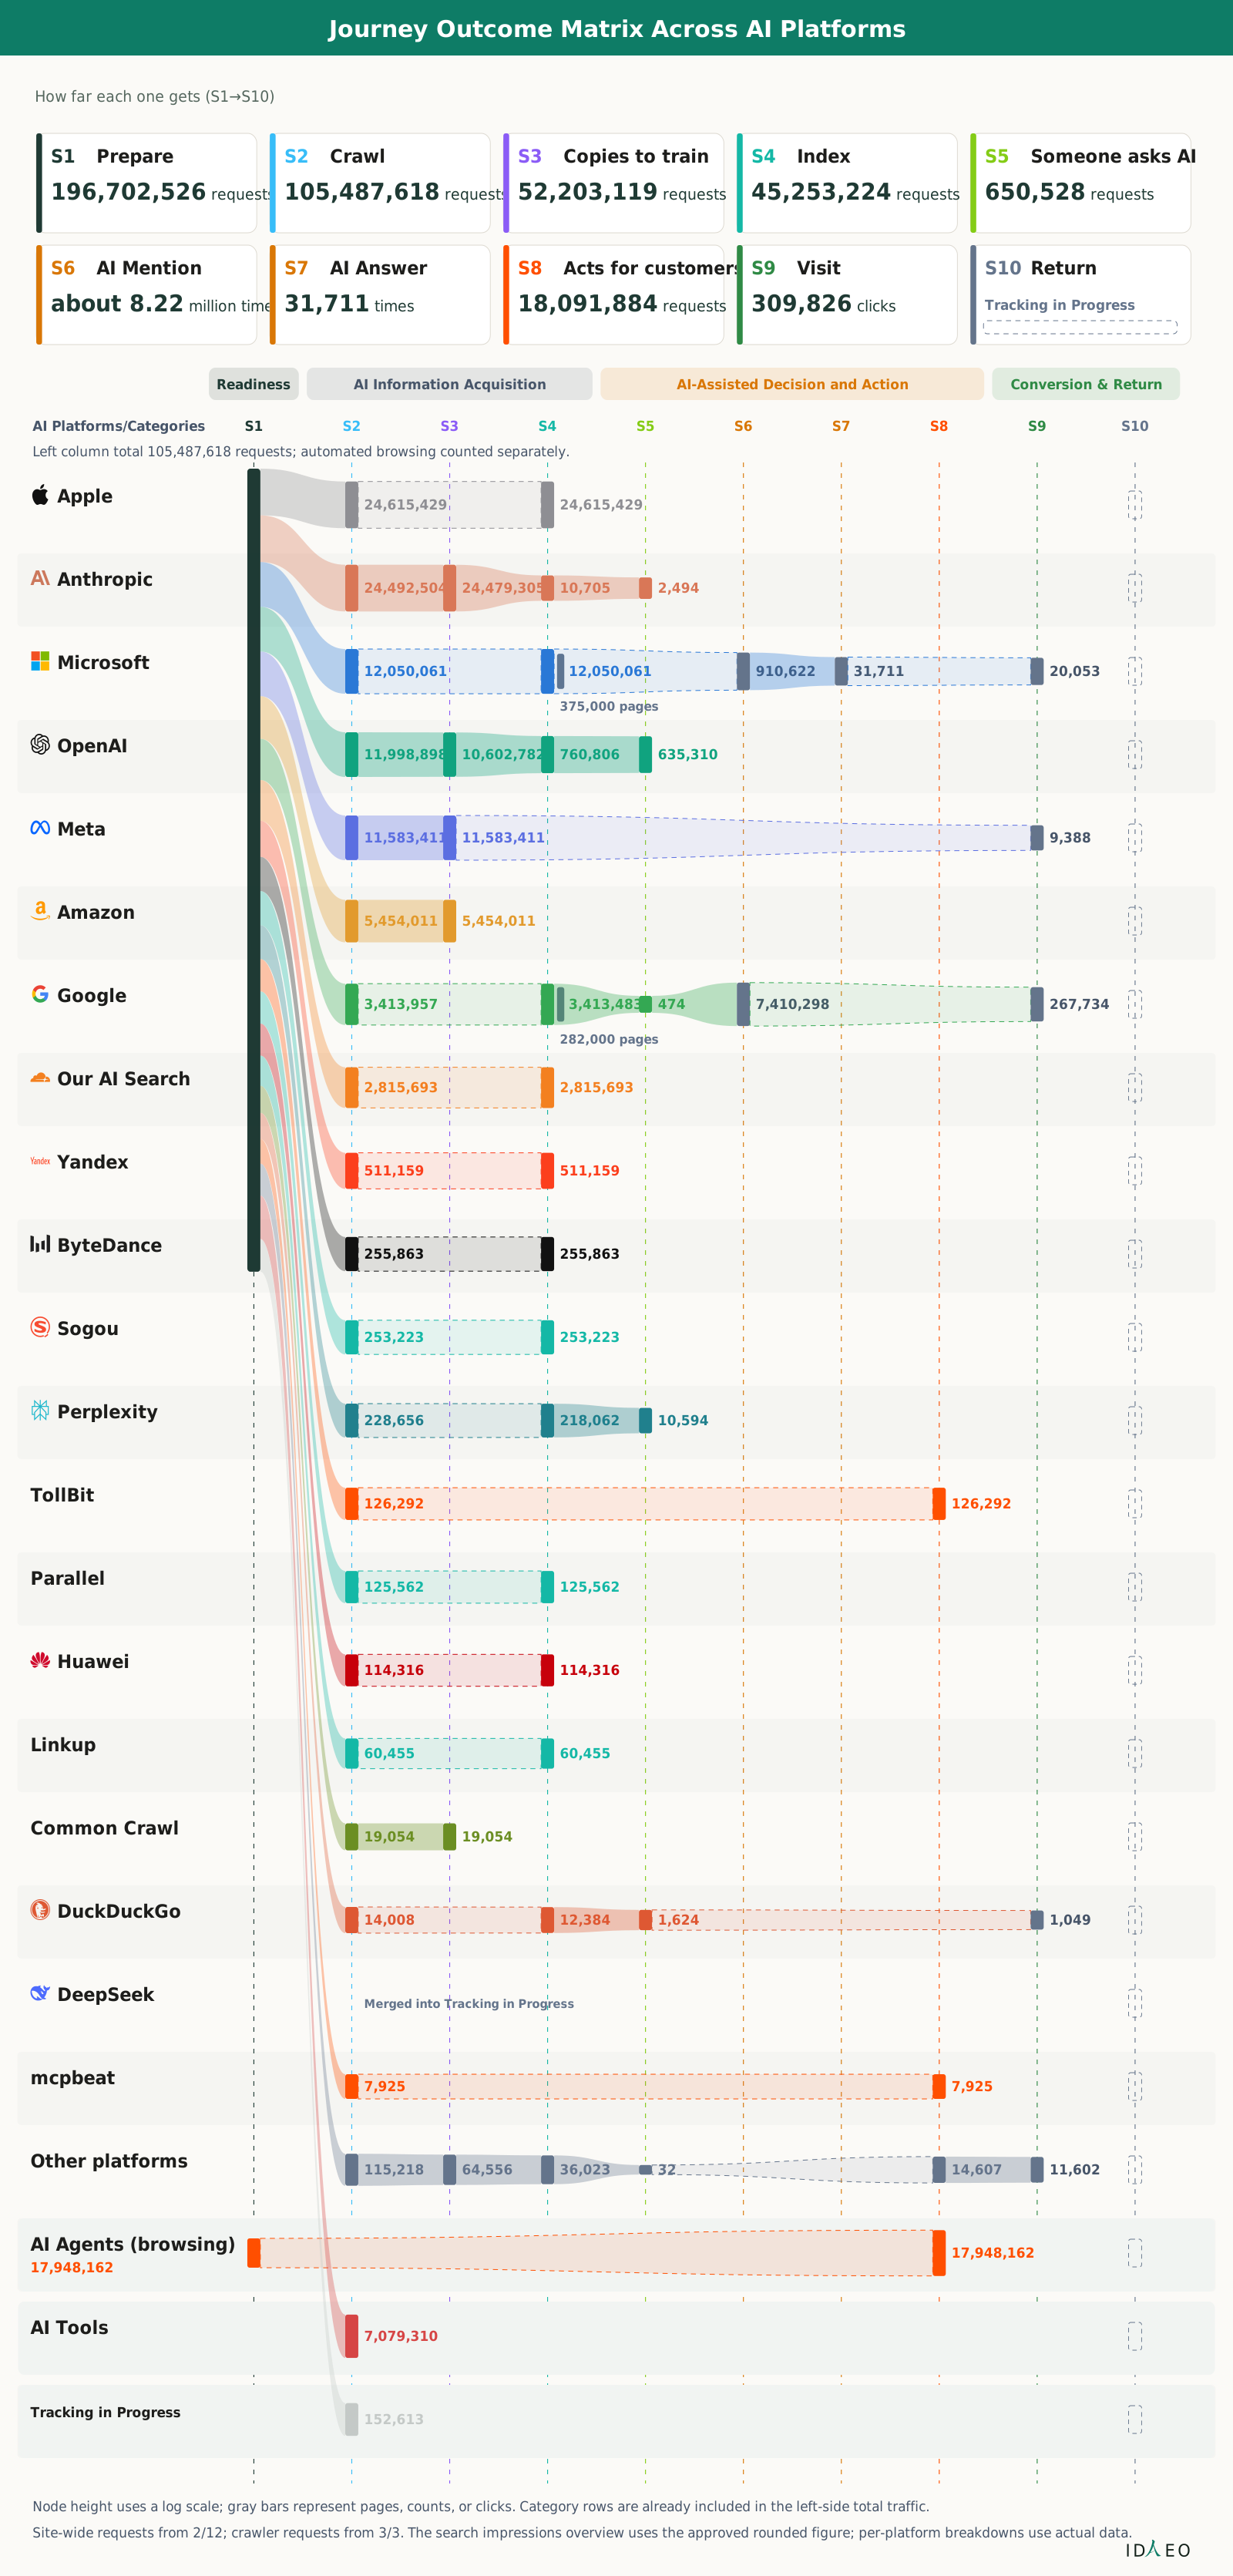
    Journey Coverage Map of AI Platforms: The Furthest Step Each Has Reached Using S1–S10 as a common scale, compare how far each company goes and its farthest step

    Using S1–S10 as a common scale, compare how far each company goes and its farthest step

    Read the ten steps left to right and follow each company's arc to its end point; the column where it ends is the farthest step this figure shows for each AI platform.

    • How far each one goes: the AI Customer Journey of the major AI Platforms (S1→S10)
    • Crawl period 2026/3/3–10/8; whole-site period 2026/2/12–10/8. Arc thickness represents that platform's cumulative crawl requests.
    • S1 Prepare
    • 197 million
    • Requests
    • S2 Crawl
    • 105 million
    • Requests
    • S3 Train
    • 52.2 million
    • Requests
    • S4 Index
    • 45.25 million
    • Requests
    • S5 Ask
    • 651,000
    • Requests
    • S6 Mention
    • about 8.22 million
    • times
    • S7 Answer
    • 31,711
    • times
    • S8 Act
    • 17.95 million
    • Requests
    • S9 Visit
    • 309,826
    • clicks
    • S10 Return
    • Tracking
    • S9 Organic Traffic sources (clicks)
    • Google 268,000
    • Microsoft 20,000
    • Yahoo Japan 10,000
    • Meta 9,388
    • DuckDuckGo 1,049
    • Baidu 713
    • All other sources total 611; source clicks and crawler requests are counted separately.
    • Major AI Platforms (crawl requests)
    • Apple
    • Farthest S4
    • 24.62M
    • Anthropic
    • Farthest S5
    • 24.49M
    • Microsoft
    • Farthest S9
    • 12.05M
    • OpenAI
    • Farthest S5
    • 12M
    • Meta
    • Farthest S9
    • 11.58M
    • Amazon
    • Farthest S3
    • 5.45M
    • Google
    • Farthest S9
    • 3.56M
    • Our AI Search
    • Farthest S4
    • 2.82M
    • Yandex
    • Farthest S4
    • 511,000
    • ByteDance
    • Farthest S4
    • 256,000
    • AI Agents browsing
    • Farthest S8
    • 17.95M
    • Farthest:
    • |
    • To S9
    • :
    • Google
    • ,
    • Microsoft
    • ,
    • Meta
    • |
    • To S8
    • :
    • AI Agents browsing
    • |
    • To S5
    • :
    • Anthropic
    • ,
    • OpenAI
    • |
    • To S4
    • :
    • Apple
    • ,
    • Our AI Search
    • ,
    • Yandex
    • ,
    • ByteDance
    • |
    • To S3
    • :
    • Amazon
    • Dot size follows the square root of each step's volume; solid dots are requests, hollow dots are platform impressions, citations, and Organic Traffic; each metric is shown in its own unit.
    • The AI Platforms' arcs show the main crawl purpose; S9 is listed separately by Organic Traffic source, and the same platform's cumulative crawl volume is counted once in each.
    • S6 search impressions are approximate; S7 citations cover Copilot 7/22–10/8; S8 automated browsing covers 8/26–10/8; S10 is still being tracked. S9 Organic Traffic and crawler requests are counted separately.
    • ID
    • EO

    Related figures:Figure 2-3、Figure 8-2

    Journey Coverage Map of AI Platforms: The Furthest Step Each Has Reached
    ItemFarthest:Value
    AppleFarthest S424.62M
    AnthropicFarthest S524.49M
    MicrosoftFarthest S912.05M
    OpenAIFarthest S512M
    MetaFarthest S911.58M
    AmazonFarthest S35.45M
    GoogleFarthest S93.56M
    Our AI SearchFarthest S42.82M
    YandexFarthest S4511,000
    ByteDanceFarthest S4256,000
    AI Agents browsingFarthest S817.95M
    CSV
    Figure 2-4Journey Coverage Map of AI Platforms: The Furthest Step Each Has Reached
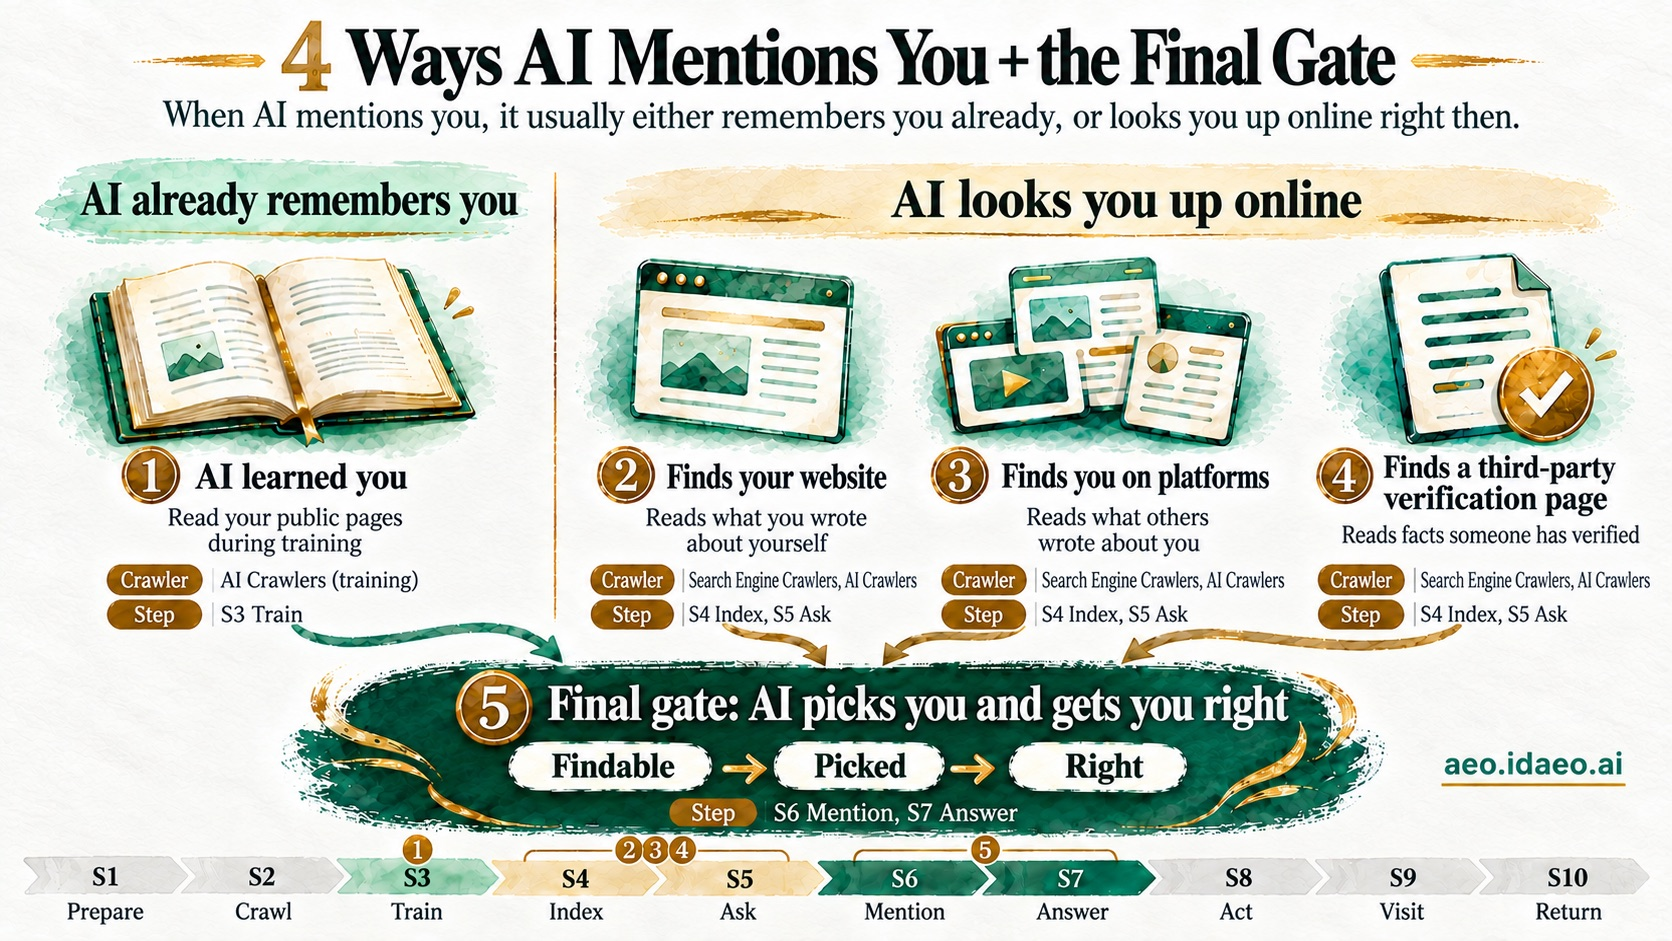
    4 Ways AI Mentions You + the Final Gate The 4 ways AI mentions you, plus the final gate, mapped to S1–S10

    The 4 ways AI mentions you, plus the final gate, mapped to S1–S10

    The top shows the two situations and the four ways, each with its crawler type and step; the colors of the progress bar below match the top: S3 for ①, S4–S5 for ②③④, S6–S7 for ⑤.

    • 4 Ways AI Mentions You + the Final Gate
    • When AI mentions you, it usually either remembers you already, or looks you up online right then.
    • AI already remembers you
    • ① AI learned you
    • Read your public pages during training
    • Crawler|AI Crawlers (training)
    • Step|S3 Train
    • AI looks you up online
    • ② Finds your website
    • Reads what you wrote about yourself
    • Crawler|Search Engine Crawlers, AI Crawlers
    • Step|S4 Index, S5 Ask
    • ③ Finds you on platforms
    • Reads what others wrote about you
    • Crawler|Search Engine Crawlers, AI Crawlers
    • Step|S4 Index, S5 Ask
    • ④ Finds a third-party verification page
    • Reads facts someone has verified
    • Crawler|Search Engine Crawlers, AI Crawlers
    • Step|S4 Index, S5 Ask
    • ⑤ Final gate: AI picks you and gets you right
    • Findable → Picked → Right
    • Step|S6 Mention, S7 Answer
    • S1 Prepare
    • S2 Crawl
    • S3 Train
    • S4 Index
    • S5 Ask
    • S6 Mention
    • S7 Answer
    • S8 Act
    • S9 Visit
    • S10 Return
    • aeo.idaeo.ai
    Figure 2-54 Ways AI Mentions You + the Final Gate

    Trust and Verification

    Why trust it

    1
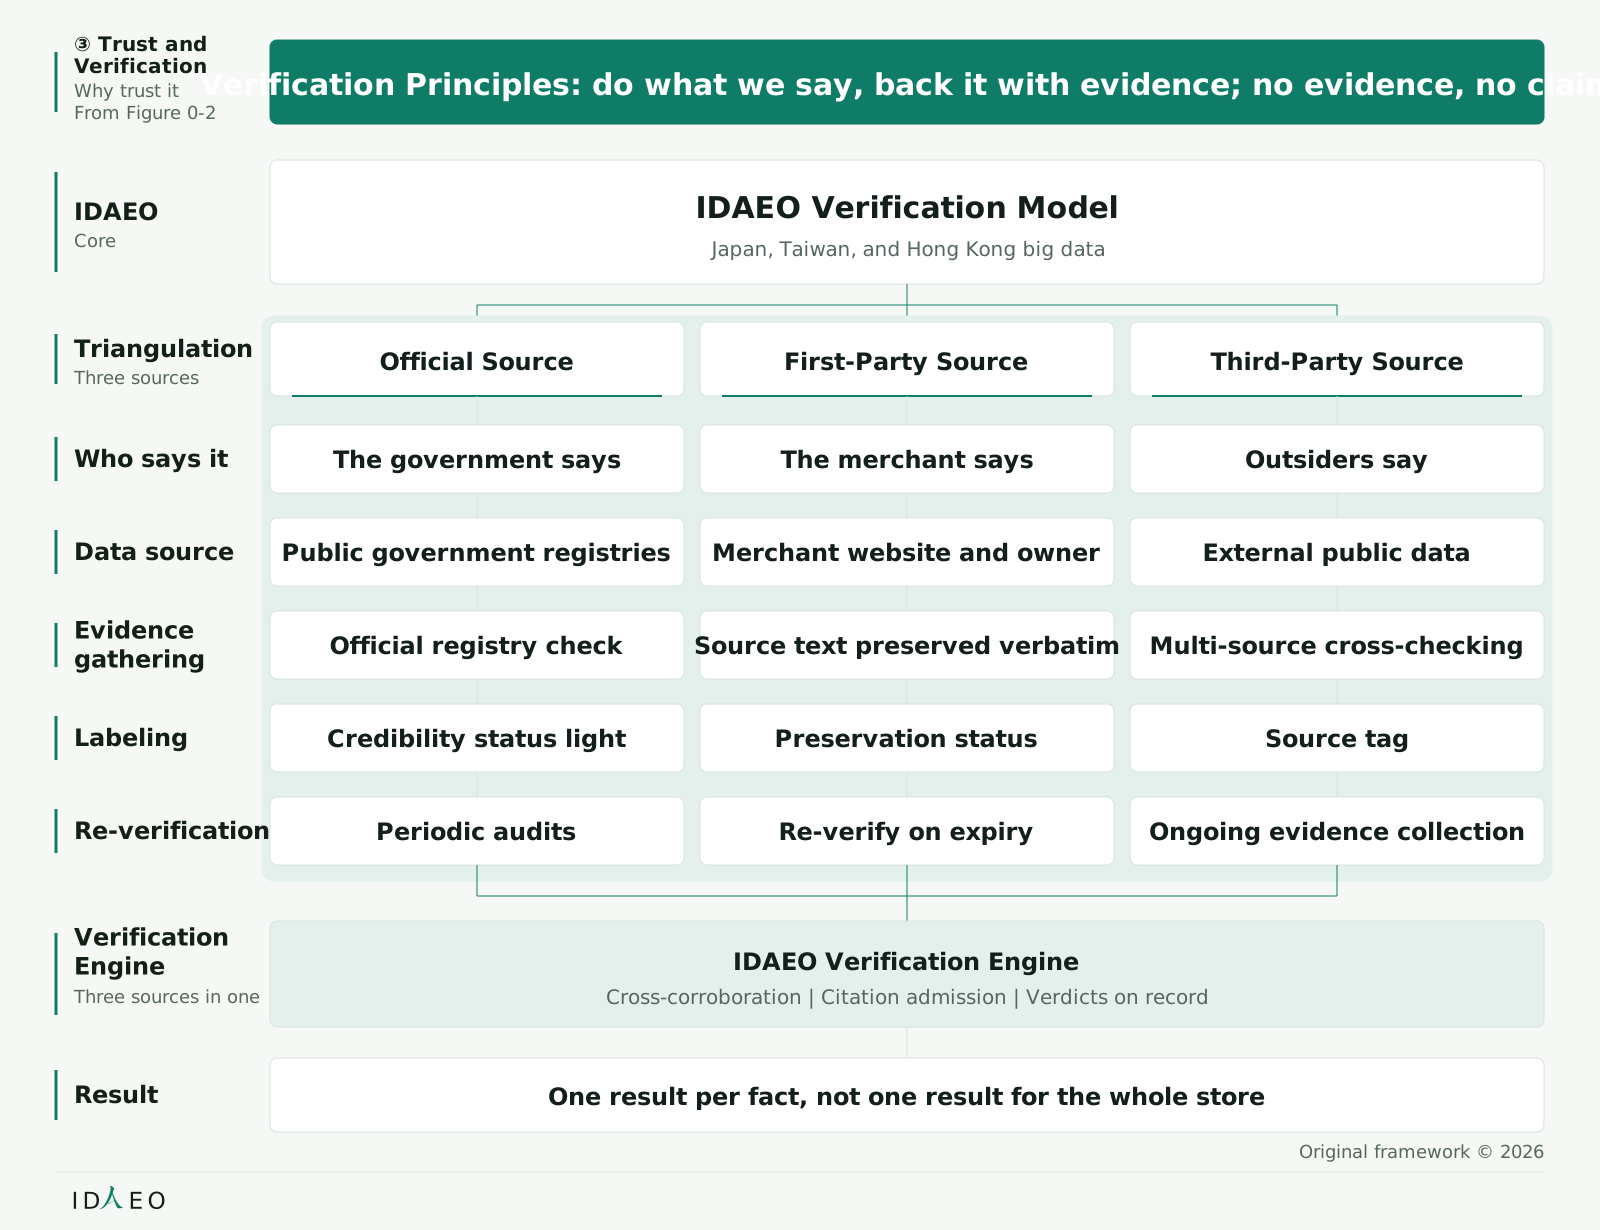
    IDAEO Verification Model: Three-Party Verification and Credible Facts The IDAEO Verification Model combines Official Source, First-Party Source, and Third-Party Source evidence to support credible facts

    The IDAEO Verification Model combines Official Source, First-Party Source, and Third-Party Source evidence to support credible facts

    Start with the IDAEO Verification Model at the top, then the evidence roles of the Official Source, First-Party Source, and Third-Party Source, and finally the verification result for each fact.

    • ③ Trust andVerification
    • Why trust it
    • From Figure 0-2
    • Verification Principles: do what we say, back it with evidence; no evidence, no claim
    • IDAEO
    • Core
    • IDAEO Verification Model
    • Japan, Taiwan, and Hong Kong big data
    • Triangulation
    • Three sources
    • Official Source
    • First-Party Source
    • Third-Party Source
    • Who says it
    • The government says
    • The merchant says
    • Outsiders say
    • Data source
    • Public government registries
    • Merchant website and owner
    • External public data
    • Evidencegathering
    • Official registry check
    • Source text preserved verbatim
    • Multi-source cross-checking
    • Labeling
    • Credibility status light
    • Preservation status
    • Source tag
    • Re-verification
    • Periodic audits
    • Re-verify on expiry
    • Ongoing evidence collection
    • VerificationEngine
    • Three sources in one
    • IDAEO Verification Engine
    • Cross-corroboration | Citation admission | Verdicts on record
    • Result
    • One result per fact, not one result for the whole store
    • Original framework © 2026
    • ID
    • EO

    Related figures:Figure 5-1、Figure 0-2
    Figure 4-1IDAEO Verification Model: Three-Party Verification and Credible Facts

    Service Tiers

    To which tier

    2
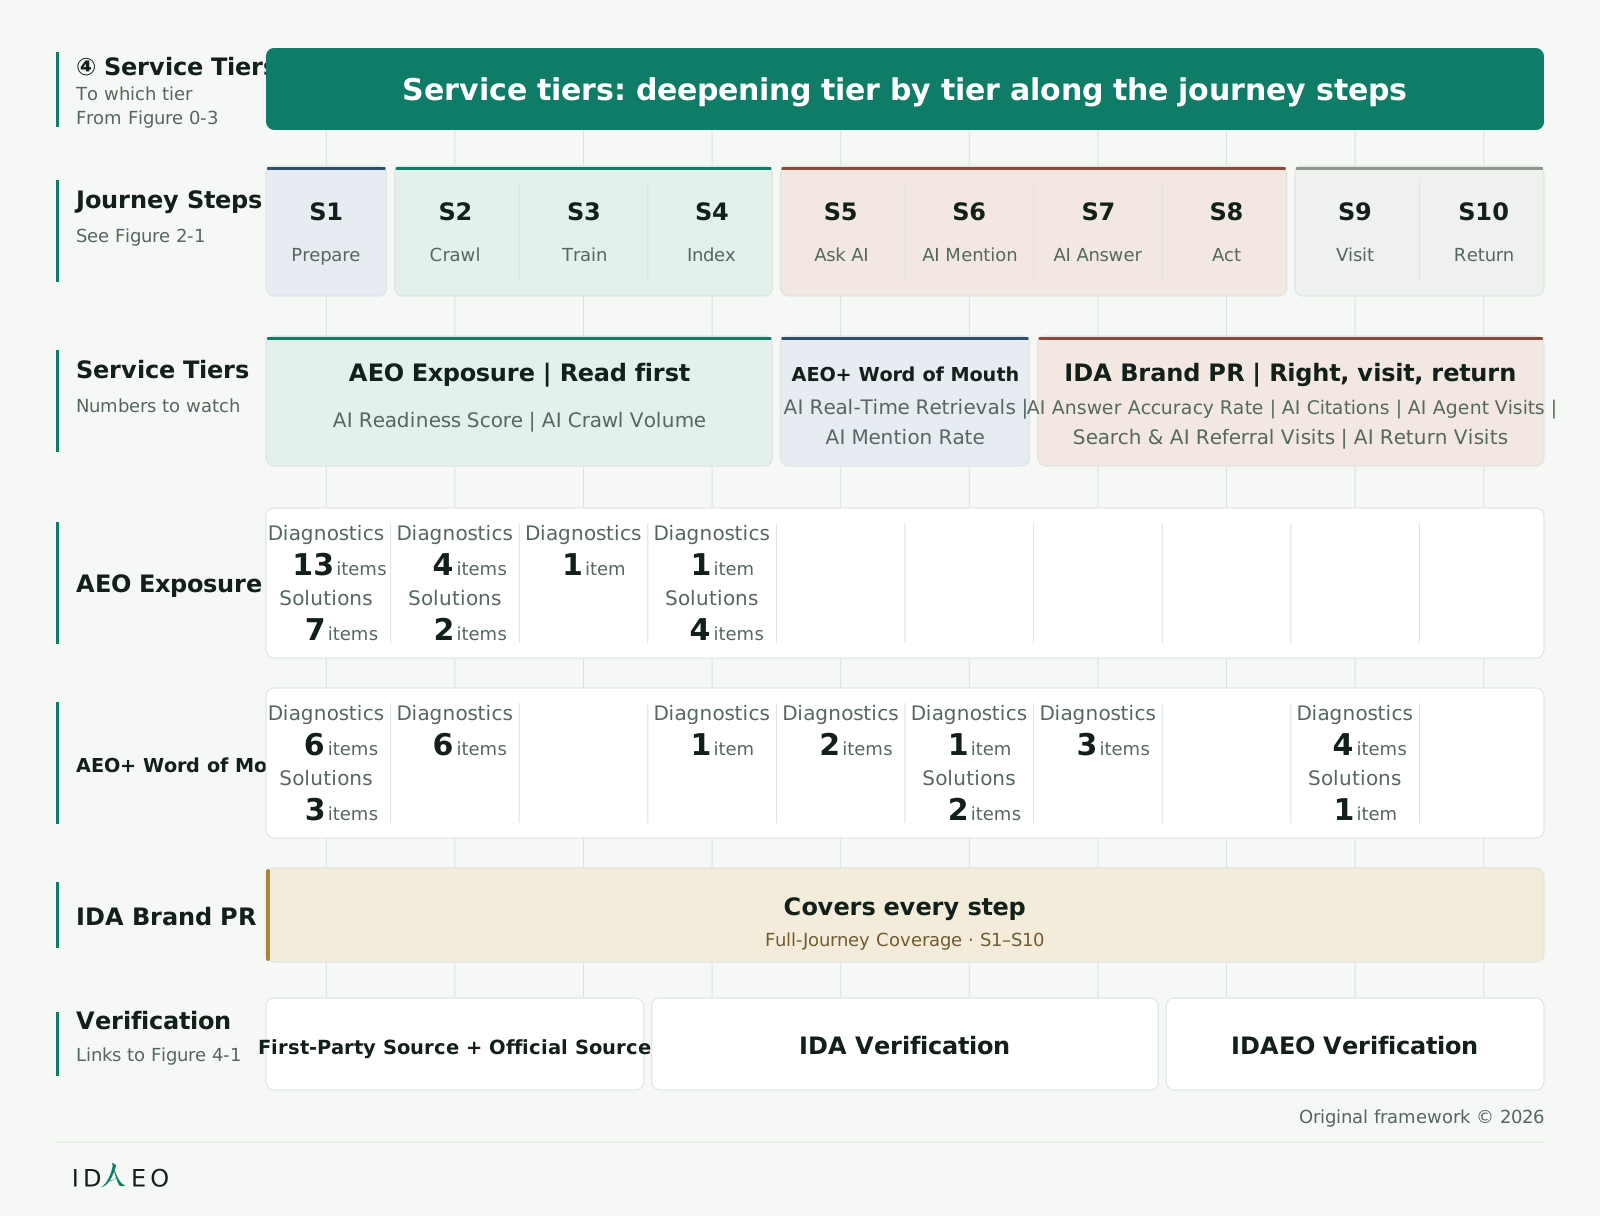
    Service Tier Ladder: AEO Exposure, AEO+ Word of Mouth, IDA Brand PR Service tiers, strategy, and verification mapped to the ten steps

    Service tiers, strategy, and verification mapped to the ten steps

    Start with the step ranges of AEO Exposure, AEO+ Word of Mouth, and IDA Brand PR; IDA Brand PR fully covers S1–S10. Then read down to the results and verification names for each segment.

    • ④ Service Tiers
    • To which tier
    • Journey Steps
    • See Figure 2-1
    • Service Tiers
    • Numbers to watch
    • AEO Exposure
    • AEO+ Word of Mouth
    • IDA Brand PR
    • Verification
    • Links to Figure 4-1
    • Service tiers: deepening tier by tier along the journey steps
    • S1
    • Prepare
    • S2
    • Crawl
    • S3
    • Train
    • S4
    • Index
    • S5
    • Ask AI
    • S6
    • AI Mention
    • S7
    • AI Answer
    • S8
    • Act
    • S9
    • Visit
    • S10
    • Return
    • AEO Exposure | Read first
    • AI Readiness Score | AI Crawl Volume
    • AEO+ Word of Mouth
    • AI Real-Time Retrievals |
    • AI Mention Rate
    • IDA Brand PR | Right, visit, return
    • AI Answer Accuracy Rate | AI Citations | AI Agent Visits |
    • Search & AI Referral Visits | AI Return Visits
    • Covers every step
    • Full-Journey Coverage · S1–S10
    • First-Party Source + Official Source
    • IDA Verification
    • IDAEO Verification
    • Original framework © 2026
    • ID
    • EO
    • From Figure 0-3
    • Diagnostics
    • 13
    • items
    • Diagnostics
    • 4
    • items
    • Diagnostics
    • 1
    • item
    • Diagnostics
    • 1
    • item
    • Solutions
    • 7
    • items
    • Solutions
    • 2
    • items
    • Solutions
    • 4
    • items
    • Diagnostics
    • 6
    • items
    • Diagnostics
    • 6
    • items
    • Diagnostics
    • 1
    • item
    • Diagnostics
    • 2
    • items
    • Diagnostics
    • 1
    • item
    • Diagnostics
    • 3
    • items
    • Diagnostics
    • 4
    • items
    • Solutions
    • 3
    • items
    • Solutions
    • 2
    • items
    • Solutions
    • 1
    • item

    Related figures:Figure 4-1、Figure 5-2、Figure 8-1、Figure 0-2、Figure 1-1、Figure 2-1

    Figure 5-1Service Tier Ladder: AEO Exposure, AEO+ Word of Mouth, IDA Brand PR
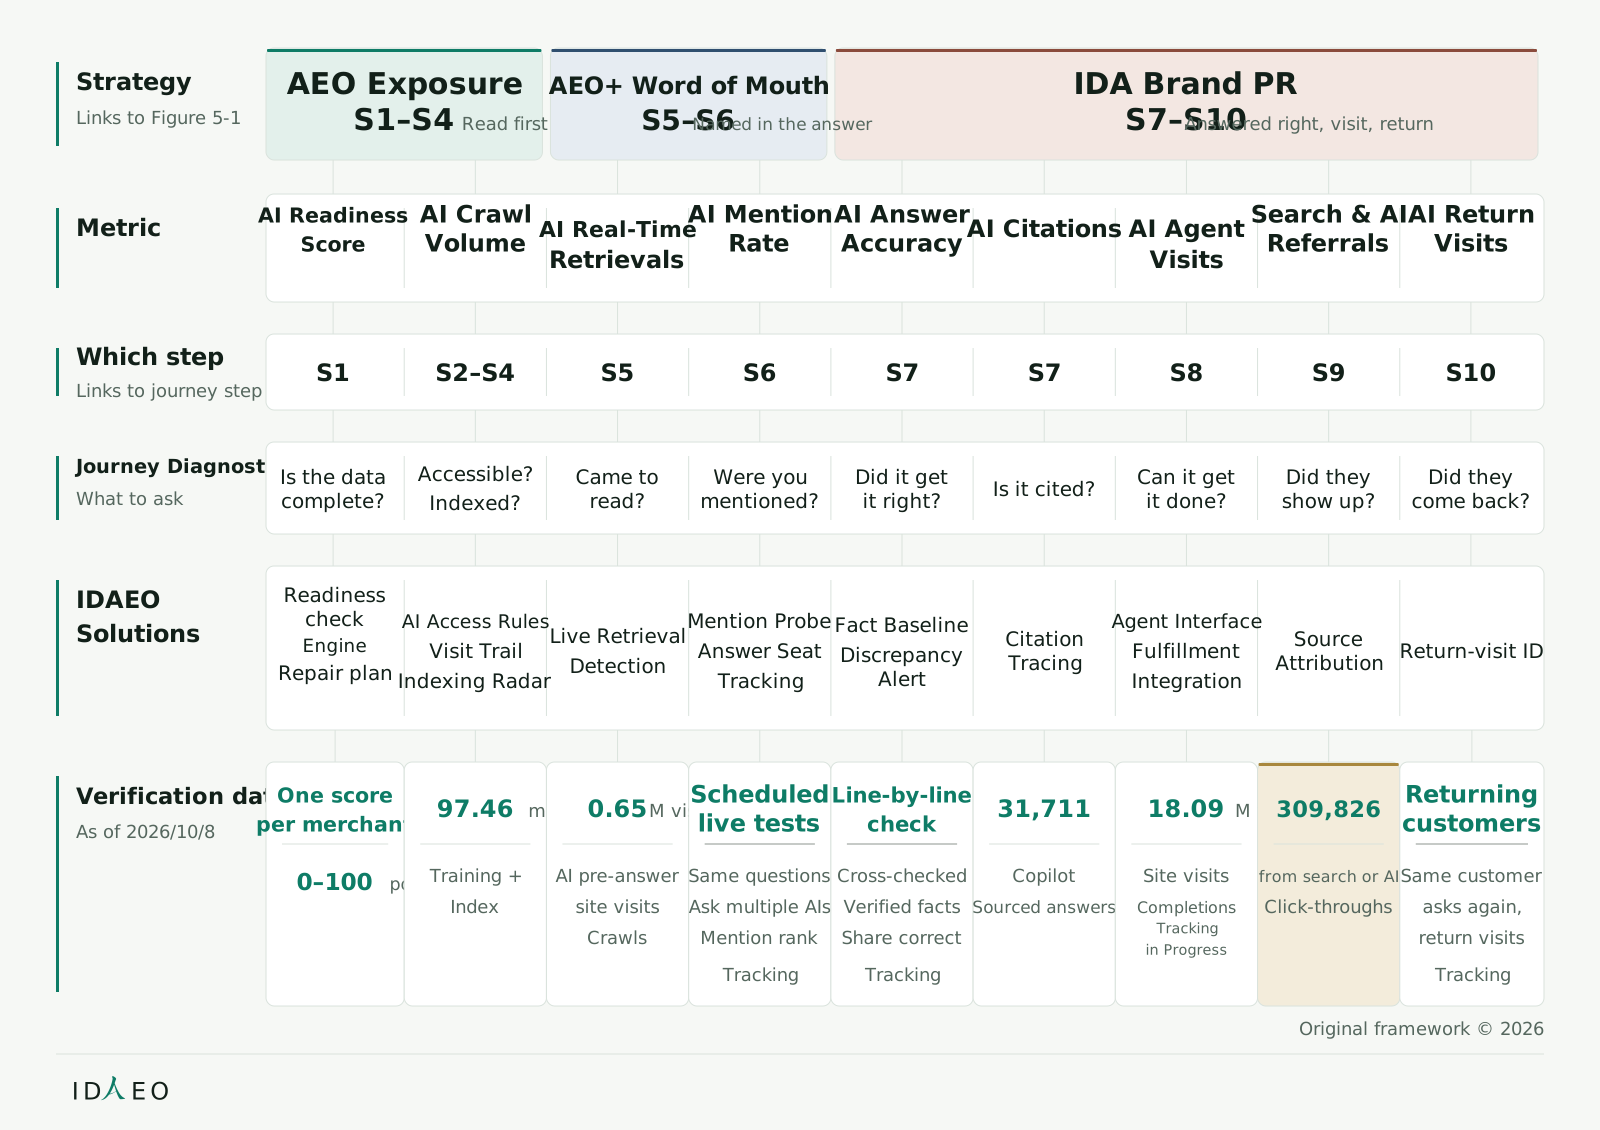
    Performance Metrics Mapping Matrix Nine Performance Metrics mapped to journey steps, diagnostic questions, IDAEO Solutions, and data

    Nine Performance Metrics mapped to journey steps, diagnostic questions, IDAEO Solutions, and data

    One metric per column; read down for the step, question, IDAEO Solutions, and data. Read each result according to its publication status.

    • Strategy
    • Links to Figure 5-1
    • Metric
    • Which step
    • Links to journey step
    • Journey Diagnostics
    • What to ask
    • IDAEO
    • Solutions
    • Verification data
    • As of 2026/10/8
    • AEO Exposure
    • AEO+ Word of Mouth
    • IDA Brand PR
    • AI ReadinessScore
    • AI CrawlVolume
    • AI Real-Time
    • Retrievals
    • AI MentionRate
    • AI AnswerAccuracy
    • AI Citations
    • AI Agent
    • Visits
    • Search & AIReferrals
    • AI ReturnVisits
    • S1
    • S2–S4
    • S5
    • S6
    • S7
    • S7
    • S8
    • S9
    • S10
    • Is the datacomplete?
    • Accessible?
    • Indexed?
    • Came toread?
    • Were youmentioned?
    • Did it getit right?
    • Is it cited?
    • Can it getit done?
    • Did theyshow up?
    • Did theycome back?
    • Readinesscheck
    • Engine
    • Repair plan
    • AI Access Rules
    • Visit Trail
    • Indexing Radar
    • Live Retrieval
    • Detection
    • Mention Probe
    • Answer Seat
    • Tracking
    • Fact Baseline
    • DiscrepancyAlert
    • CitationTracing
    • Agent Interface
    • Fulfillment
    • Integration
    • SourceAttribution
    • Return-visit ID
    • One scoreper merchant
    • 0–100 points
    • 97.46 million
    • Training +
    • Index
    • 0.65M visits
    • AI pre-answer
    • site visits
    • Crawls
    • Scheduledlive tests
    • Same questions
    • Ask multiple AIs
    • Mention rank
    • Tracking
    • Line-by-linecheck
    • Cross-checked
    • Verified facts
    • Share correct
    • Tracking
    • 31,711times
    • Copilot
    • Sourced answers
    • 18.09M visits
    • Site visits
    • Completions
    • Trackingin Progress
    • 309,826visits
    • from search or AI
    • Click-throughs
    • Returningcustomers
    • Same customer
    • asks again,
    • return visits
    • Tracking
    • Original framework © 2026
    • ID
    • EO
    • S1–S4 Read first
    • S5–S6 Named in the answer
    • S7–S10 Answered right, visit, return

    Related figures:Figure 5-1、Figure 0-2、Figure 2-2

    Figure 5-2Performance Metrics Mapping Matrix

    Performance Measurement

    How results are counted

    6
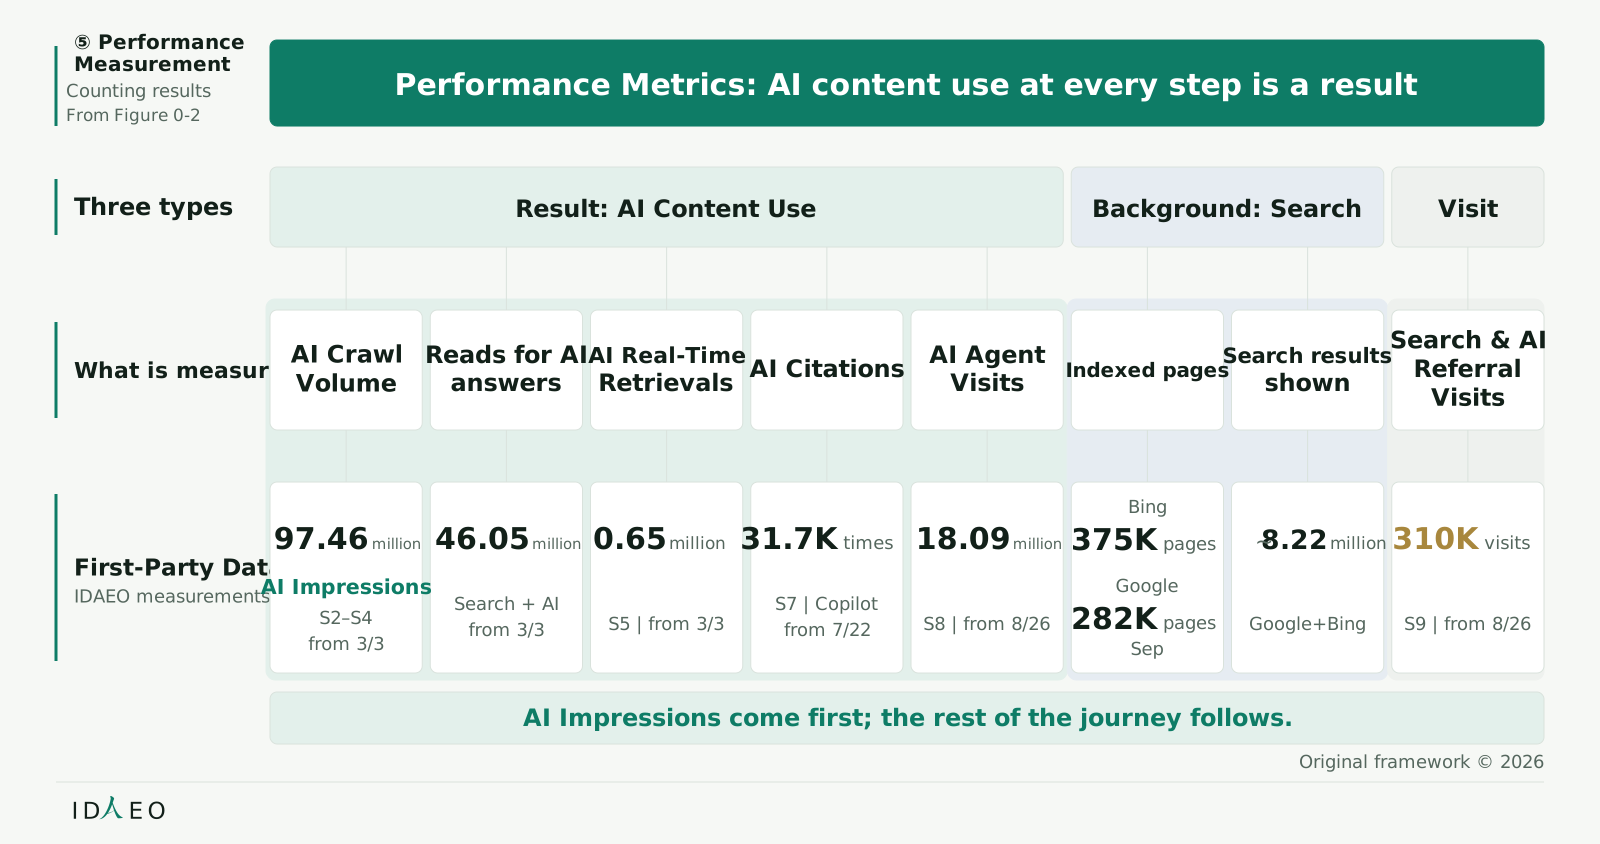
    Full-Journey Performance Dashboard: Eight Measured Figures and First-Party Data Three categories of performance metrics, each matched to what it measures

    Three categories of performance metrics, each matched to what it measures

    Read down: Performance Metrics, the three categories, measurement targets, and figures; each cell is one kind of result.

    • ⑤ PerformanceMeasurement
    • Counting results
    • Performance Metrics: AI content use at every step is a result
    • Three types
    • Result: AI Content Use
    • Background: Search
    • Visit
    • What is measured
    • AI CrawlVolume
    • Reads for AI
    • answers
    • AI Real-Time
    • Retrievals
    • AI Citations
    • AI Agent
    • Visits
    • Indexed pages
    • Search results
    • shown
    • Search & AIReferralVisits
    • First-Party Data
    • IDAEO measurements
    • 97.46
    • million
    • S2–S4
    • from 3/3
    • 46.05
    • million
    • Search + AI
    • from 3/3
    • 0.65
    • million
    • S5 | from 3/3
    • 31.7K
    • times
    • S7 | Copilot
    • from 7/22
    • 18.09
    • million
    • S8 | from 8/26
    • Bing
    • pages
    • Google
    • pages
    • 8.22
    • million
    • Google+Bing
    • 310K
    • visits
    • S9 | from 8/26
    • Original framework © 2026
    • ID
    • EO
    • From Figure 0-2
    • AI Impressions come first; the rest of the journey follows.
    • AI Impressions
    • 375K
    • 282K
    • Sep
    • ~

    Related figures:Figure 6-2、Figure 0-2、Figure 6-6、Figure 3-1

    Figure 6-1Full-Journey Performance Dashboard: Eight Measured Figures and First-Party Data
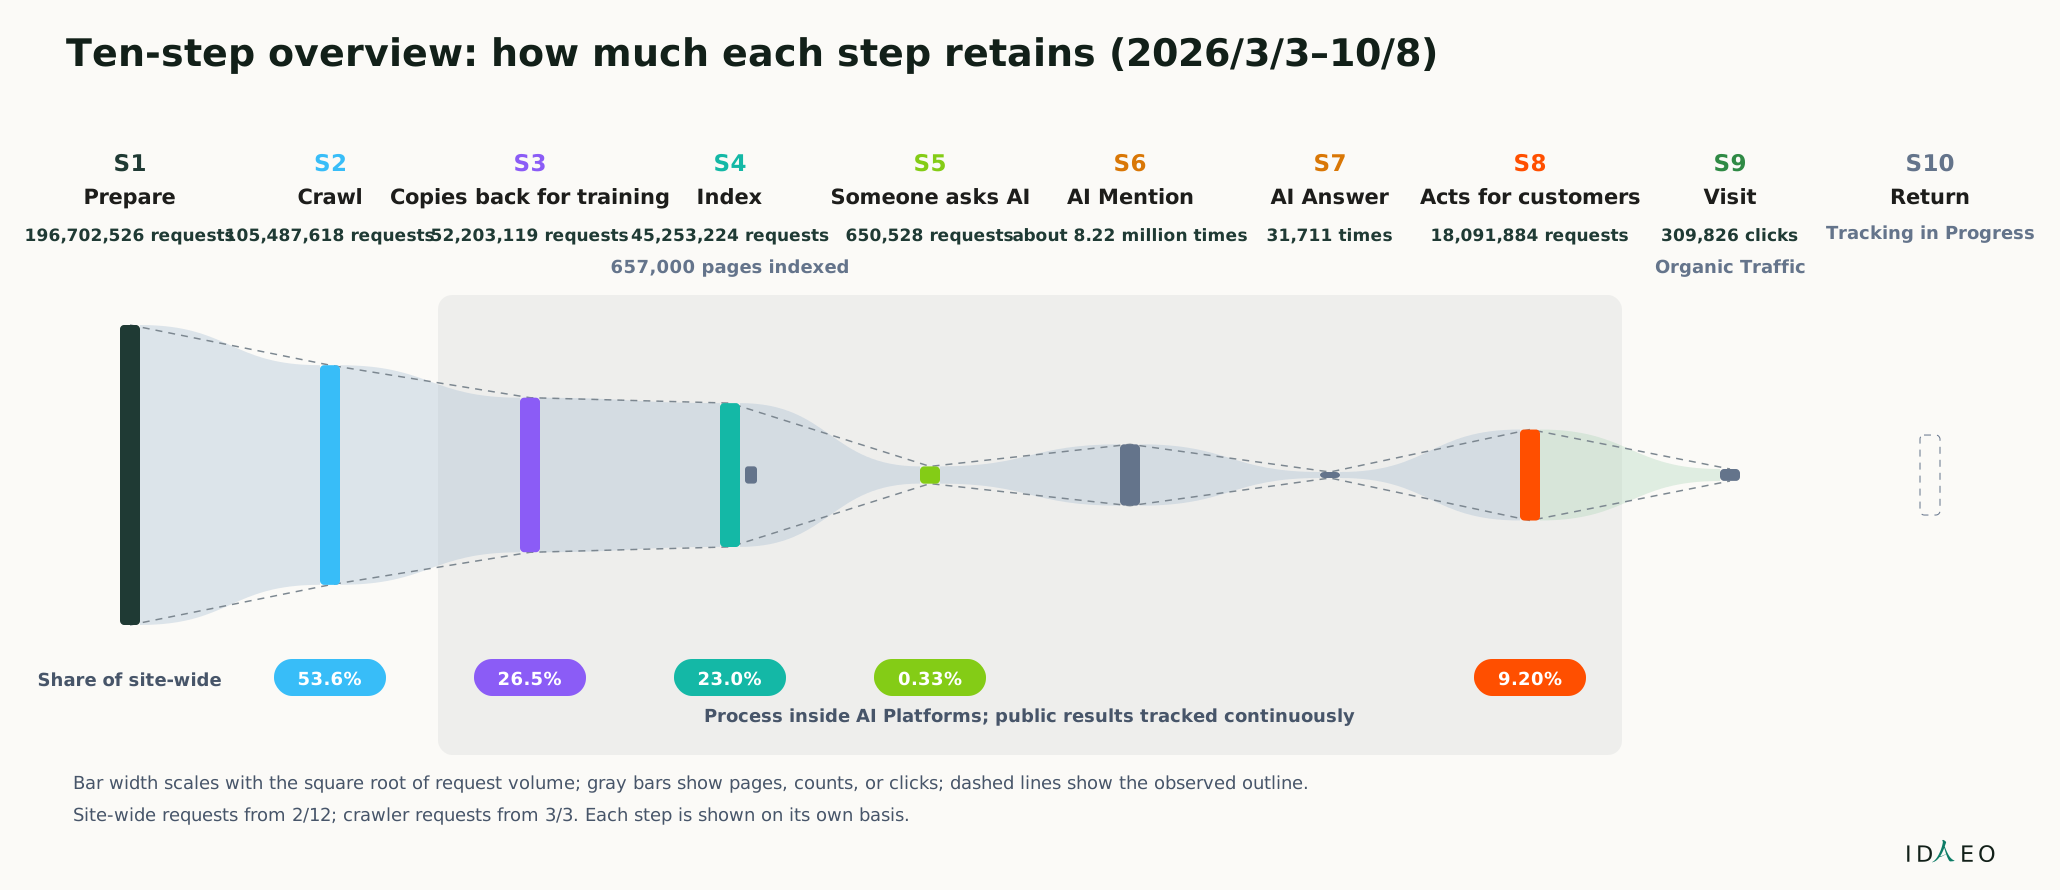
    Ten-Step Results Overview Overview of the ten steps, showing the measured results of each step

    Overview of the ten steps, showing the measured results of each step

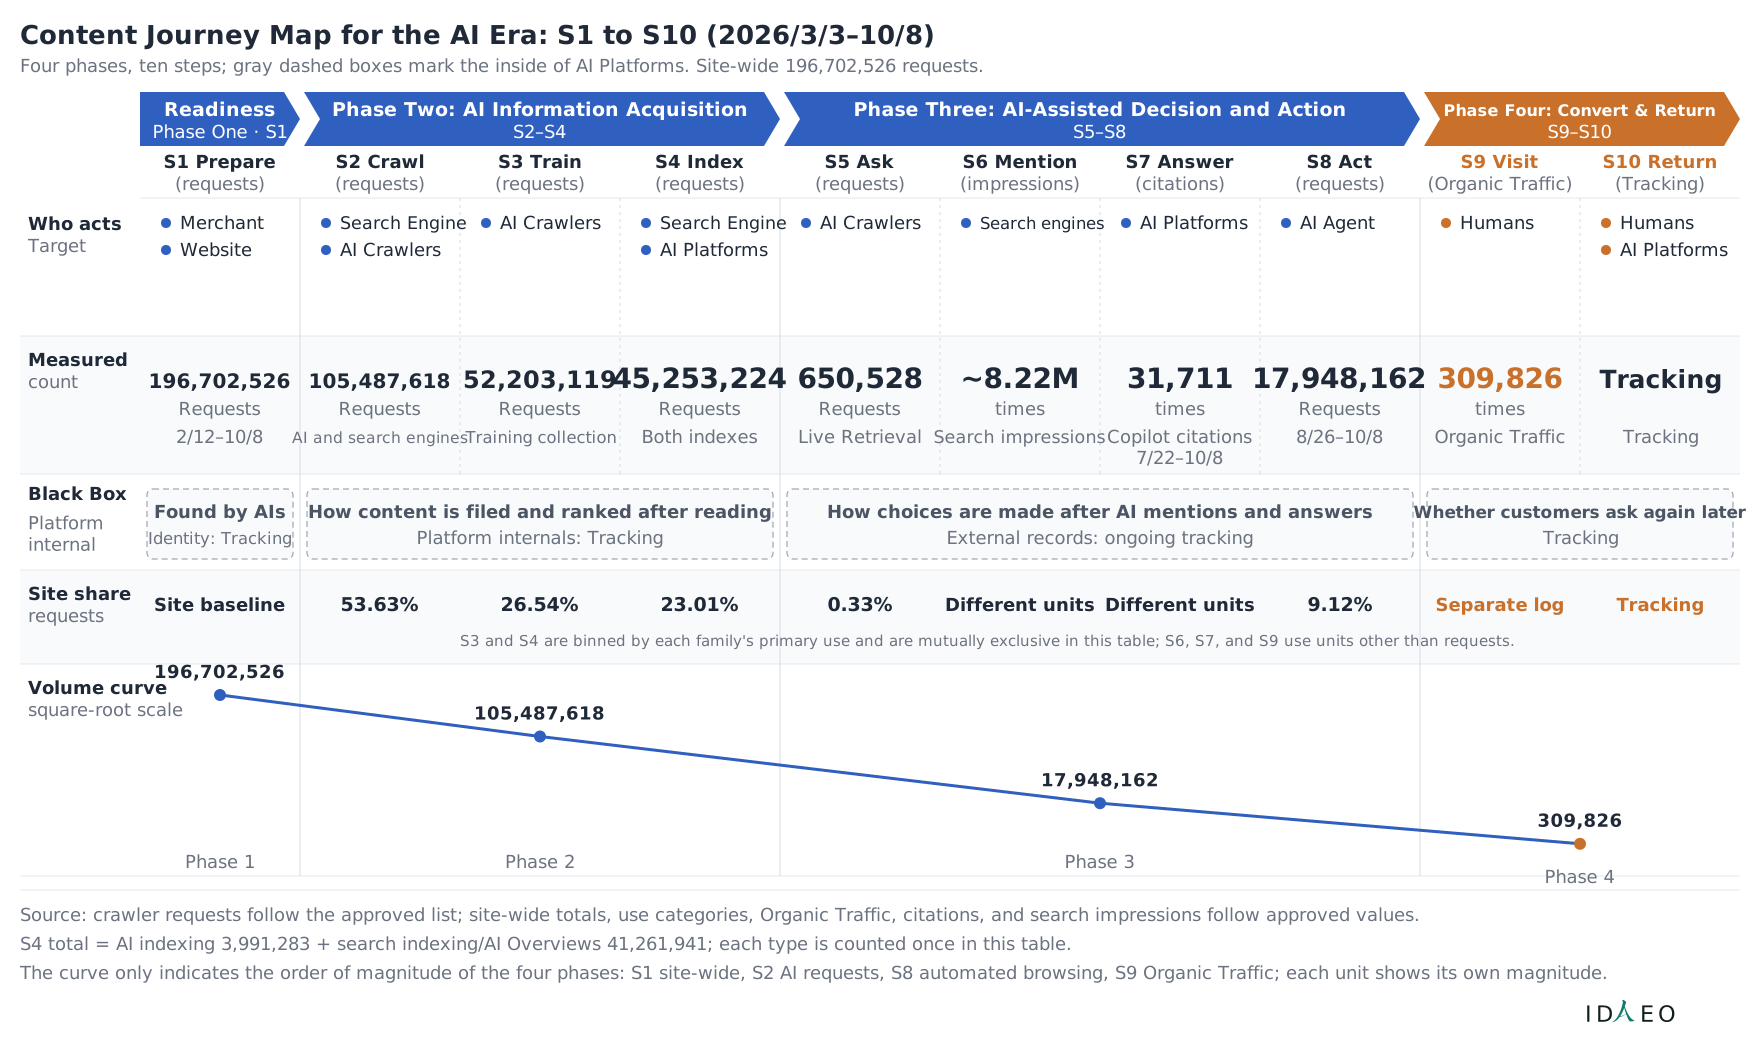
    Read the ten steps from left to right; the thicker the bar, the larger the volume. The gray area is inside the AI Platforms, and measured results keep accumulating. S6 in the figure is search impressions (not AI mentions): the number of times search results list you. The mention rate in AI answers will be published later.

    • Ten-step overview: how much each step retains (2026/3/3–10/8)
    • Process inside AI Platforms; public results tracked continuously
    • S1
    • Prepare
    • 196,702,526 requests
    • S2
    • Crawl
    • 105,487,618 requests
    • S3
    • Copies back for training
    • 52,203,119 requests
    • S4
    • Index
    • 45,253,224 requests
    • 657,000 pages indexed
    • S5
    • Someone asks AI
    • 650,528 requests
    • S6
    • AI Mention
    • about 8.22 million times
    • S7
    • AI Answer
    • 31,711 times
    • S8
    • Acts for customers
    • 18,091,884 requests
    • S9
    • Visit
    • 309,826 clicks
    • Organic Traffic
    • S10
    • Return
    • Tracking in Progress
    • Share of site-wide
    • 53.6%
    • 26.5%
    • 23.0%
    • 0.33%
    • 9.20%
    • Bar width scales with the square root of request volume; gray bars show pages, counts, or clicks; dashed lines show the observed outline.
    • Site-wide requests from 2/12; crawler requests from 3/3. Each step is shown on its own basis.
    • ID
    • EO

    Related figures:Figure 6-1、Figure 6-3

    Ten-Step Results Overview
    ItemValueUnit
    Prepare196,702,526requests
    Crawl105,487,618requests
    Copies back for training52,203,119requests
    Index45,253,224requests
    pages indexed657,000pages
    Someone asks AI650,528requests
    AI Mentionabout 8.22 milliontimes
    AI Answer31,711times
    Acts for customers18,091,884requests
    Visit309,826clicks
    CSV
    Figure 6-2Ten-Step Results Overview
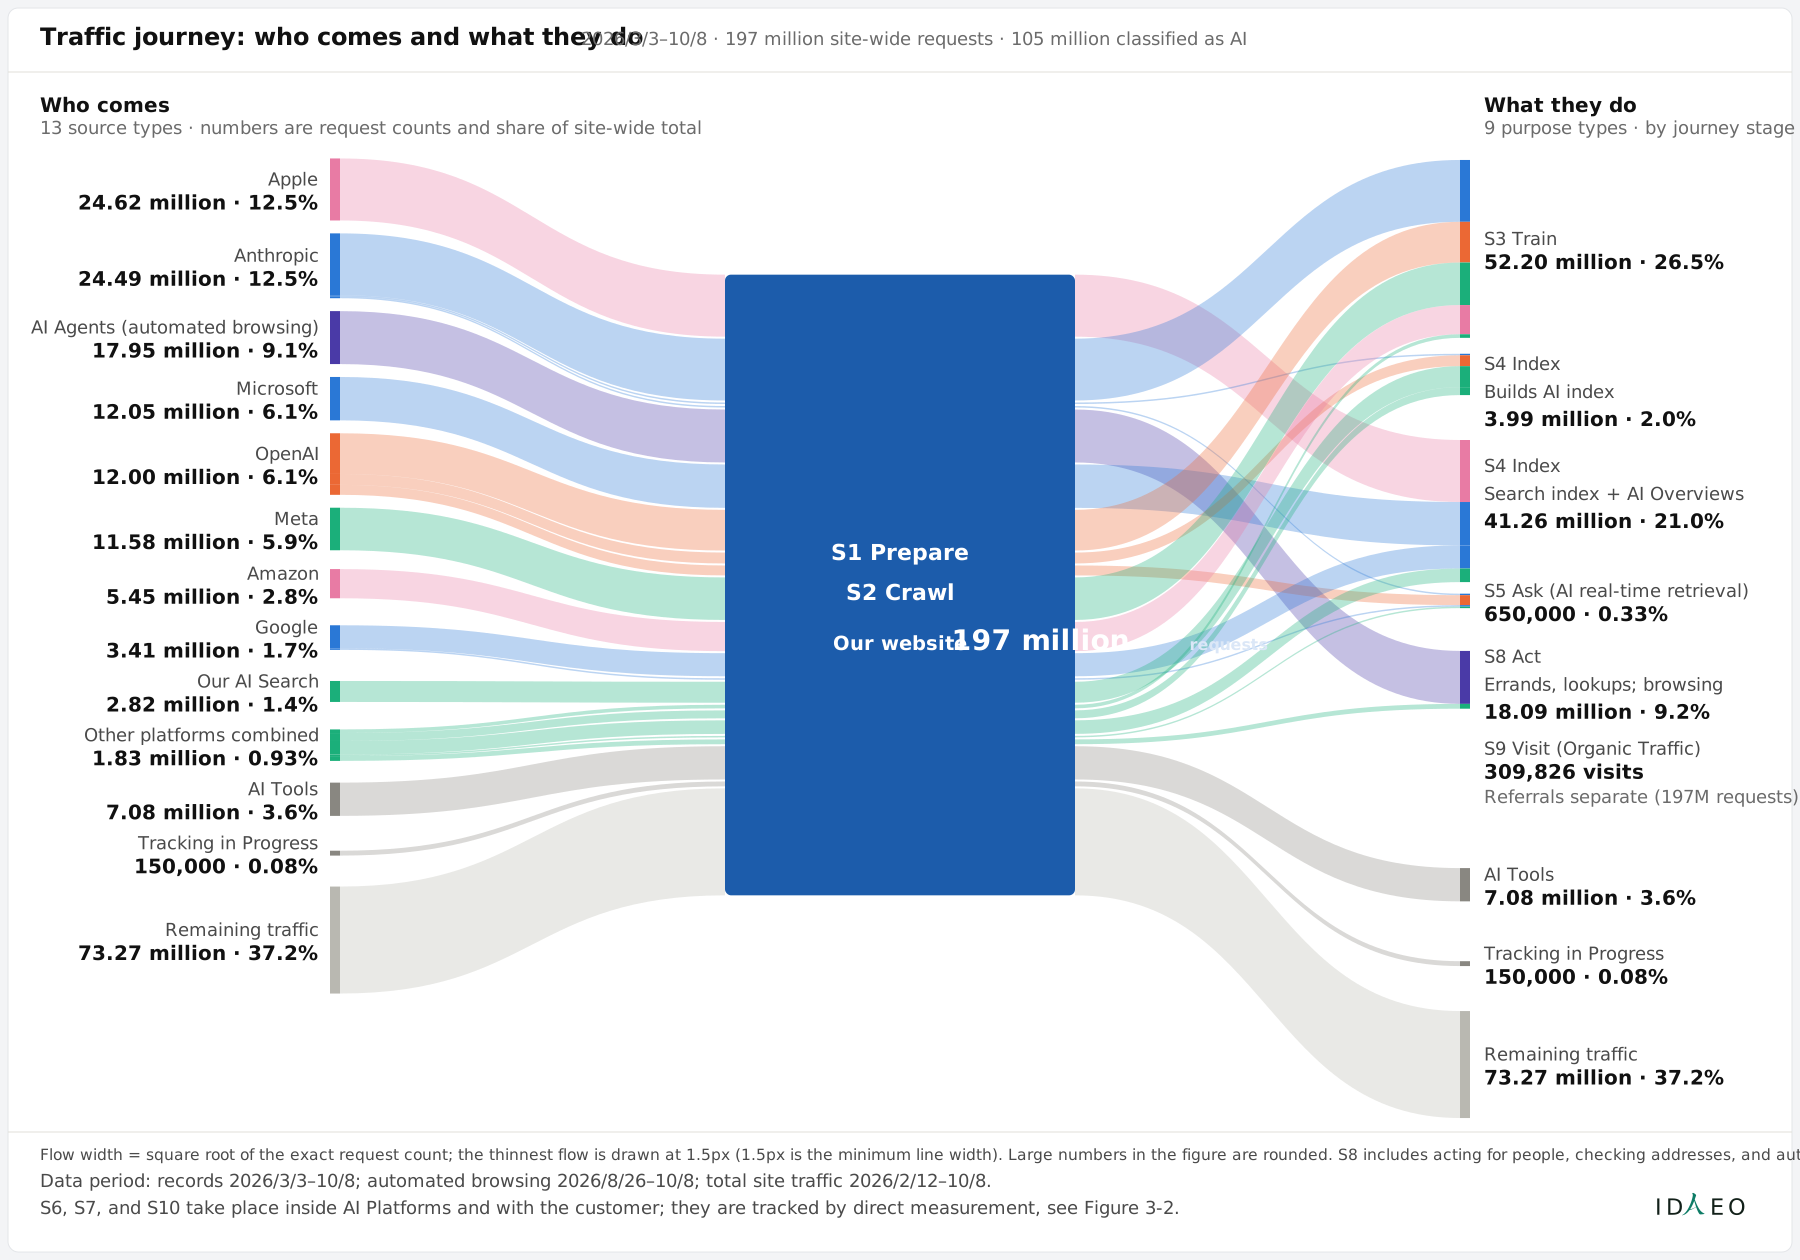
    AI Visit Structure Map: Who Comes and What They Come to Do Traffic distributed by Marketing Audiences and function

    Traffic distributed by Marketing Audiences and function

    Follow the bands: Marketing Audiences on the left, functions on the right; the thicker the band, the larger the volume.

    • Traffic journey: who comes and what they do
    • 2026/3/3–10/8 · 197 million site-wide requests · 105 million classified as AI
    • Who comes
    • 13 source types · numbers are request counts and share of site-wide total
    • What they do
    • 9 purpose types · by journey stage
    • S1 Prepare
    • S2 Crawl
    • Our website 197 million requests
    • Apple
    • 24.62 million · 12.5%
    • Anthropic
    • 24.49 million · 12.5%
    • AI Agents (automated browsing)
    • 17.95 million · 9.1%
    • Microsoft
    • 12.05 million · 6.1%
    • OpenAI
    • 12.00 million · 6.1%
    • Meta
    • 11.58 million · 5.9%
    • Amazon
    • 5.45 million · 2.8%
    • Google
    • 3.41 million · 1.7%
    • Our AI Search
    • 2.82 million · 1.4%
    • Other platforms combined
    • 1.83 million · 0.93%
    • AI Tools
    • 7.08 million · 3.6%
    • Tracking in Progress
    • 150,000 · 0.08%
    • Remaining traffic
    • 73.27 million · 37.2%
    • S3 Train
    • 52.20 million · 26.5%
    • S4 Index
    • Builds AI index
    • 3.99 million · 2.0%
    • S4 Index
    • Search index + AI Overviews
    • 41.26 million · 21.0%
    • S5 Ask (AI real-time retrieval)
    • 650,000 · 0.33%
    • S8 Act
    • Errands, lookups; browsing
    • 18.09 million · 9.2%
    • S9 Visit (Organic Traffic)
    • 309,826 visits
    • Referrals separate (197M requests)
    • AI Tools
    • 7.08 million · 3.6%
    • Tracking in Progress
    • 150,000 · 0.08%
    • Remaining traffic
    • 73.27 million · 37.2%
    • Flow width = square root of the exact request count; the thinnest flow is drawn at 1.5px (1.5px is the minimum line width). Large numbers in the figure are rounded. S8 includes acting for people, checking addresses, and automated browsing.
    • Data period: records 2026/3/3–10/8; automated browsing 2026/8/26–10/8; total site traffic 2026/2/12–10/8.
    • S6, S7, and S10 take place inside AI Platforms and with the customer; they are tracked by direct measurement, see Figure 3-2.
    • ID
    • EO

    Related figures:Figure 6-2、Figure 6-4、Figure 3-2

    AI Visit Structure Map: Who Comes and What They Come to Do
    ItemValue
    Apple24.62 million · 12.5%
    Anthropic24.49 million · 12.5%
    AI Agents (automated browsing)17.95 million · 9.1%
    Microsoft12.05 million · 6.1%
    OpenAI12.00 million · 6.1%
    Meta11.58 million · 5.9%
    Amazon5.45 million · 2.8%
    Google3.41 million · 1.7%
    Our AI Search2.82 million · 1.4%
    Other platforms combined1.83 million · 0.93%
    AI Tools7.08 million · 3.6%
    Tracking in Progress150,000 · 0.08%
    Remaining traffic73.27 million · 37.2%
    S3 Train52.20 million · 26.5%
    Builds AI index3.99 million · 2.0%
    Search index + AI Overviews41.26 million · 21.0%
    S5 Ask (AI real-time retrieval)650,000 · 0.33%
    S8 Act18.09 million · 9.2%
    S9 Visit (Organic Traffic)309,826 visits
    CSV
    Figure 6-3AI Visit Structure Map: Who Comes and What They Come to Do
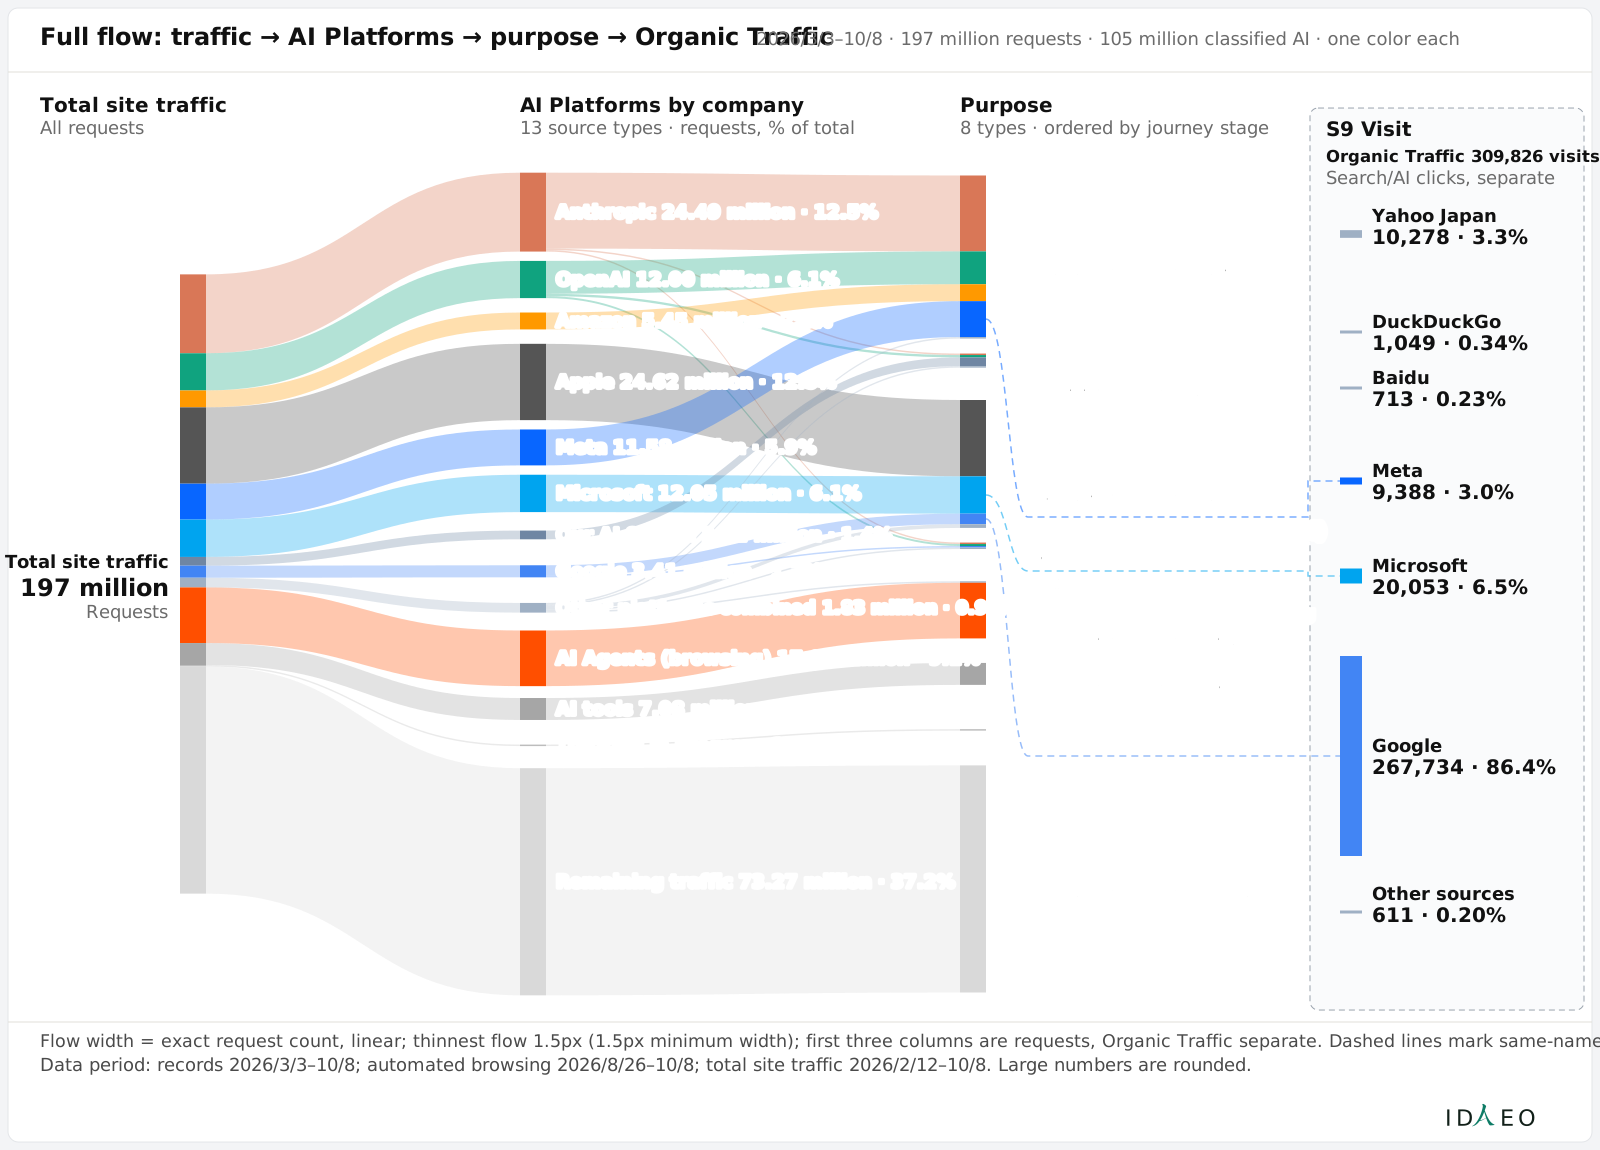
    Full-Journey Outcomes Flow Map: From AI Exposure to Customer Visits Site-wide traffic split by AI Platforms and purpose, ending in Organic Traffic

    Site-wide traffic split by AI Platforms and purpose, ending in Organic Traffic

    Read from left to right: total site traffic → each AI platform → purpose → Organic Traffic; the thicker the band, the larger the volume, and purposes are ordered by journey step.

    • Full flow: traffic → AI Platforms → purpose → Organic Traffic
    • 2026/3/3–10/8 · 197 million requests · 105 million classified AI · one color each
    • Total site traffic
    • All requests
    • AI Platforms by company
    • 13 source types · requests, % of total
    • Purpose
    • 8 types · ordered by journey stage
    • Total site traffic
    • 197 million
    • Requests
    • Anthropic 24.49 million · 12.5%
    • OpenAI 12.00 million · 6.1%
    • Amazon 5.45 million · 2.8%
    • Apple 24.62 million · 12.5%
    • Meta 11.58 million · 5.9%
    • Microsoft 12.05 million · 6.1%
    • Our AI Search 2.82 million · 1.4%
    • Google 3.41 million · 1.7%
    • Other platforms combined 1.83 million · 0.93%
    • AI Agents (browsing) 17.95 million · 9.1%
    • AI tools 7.08 million · 3.6%
    • Tracking in Progress 150,000 · 0.08%
    • Remaining traffic 73.27 million · 37.2%
    • S3 Train
    • 52.20 million · 26.5%
    • S4 Index
    • Builds AI index
    • 3.99 million · 2.0%
    • S4 Index
    • Search index + AIO
    • 41.26 million · 21.0%
    • S5 Ask (AI real-time retrieval)
    • 650,000 · 0.33%
    • S8 Act
    • Errands, lookups; browsing
    • 18.09 million · 9.2%
    • AI Tools
    • 7.08 million · 3.6%
    • Tracking in Progress
    • 150,000 · 0.08%
    • Remaining traffic
    • 73.27 million · 37.2%
    • S9 Visit
    • Organic Traffic 309,826 visits
    • Search/AI clicks, separate
    • Yahoo Japan
    • 10,278 · 3.3%
    • DuckDuckGo
    • 1,049 · 0.34%
    • Baidu
    • 713 · 0.23%
    • Meta
    • 9,388 · 3.0%
    • Microsoft
    • 20,053 · 6.5%
    • Google
    • 267,734 · 86.4%
    • Other sources
    • 611 · 0.20%
    • Flow width = exact request count, linear; thinnest flow 1.5px (1.5px minimum width); first three columns are requests, Organic Traffic separate. Dashed lines mark same-name AI Platforms.
    • Data period: records 2026/3/3–10/8; automated browsing 2026/8/26–10/8; total site traffic 2026/2/12–10/8. Large numbers are rounded.
    • ID
    • EO

    Related figures:Figure 6-3、Figure 6-5

    Full-Journey Outcomes Flow Map: From AI Exposure to Customer Visits
    ItemValue
    Anthropic24.49 million · 12.5%
    OpenAI12.00 million · 6.1%
    Amazon5.45 million · 2.8%
    Apple24.62 million · 12.5%
    Meta11.58 million · 5.9%
    Microsoft12.05 million · 6.1%
    Our AI Search2.82 million · 1.4%
    Google3.41 million · 1.7%
    Other platforms combined1.83 million · 0.93%
    AI Agents (browsing)17.95 million · 9.1%
    AI tools7.08 million · 3.6%
    Tracking in Progress150,000 · 0.08%
    Remaining traffic73.27 million · 37.2%
    S3 Train52.20 million · 26.5%
    Builds AI index3.99 million · 2.0%
    Search index + AIO41.26 million · 21.0%
    S5 Ask (AI real-time retrieval)650,000 · 0.33%
    S8 Act18.09 million · 9.2%
    Organic Traffic309,826 visits
    Yahoo Japan10,278 · 3.3%
    DuckDuckGo1,049 · 0.34%
    Baidu713 · 0.23%
    Meta9,388 · 3.0%
    Microsoft20,053 · 6.5%
    Google267,734 · 86.4%
    Other sources611 · 0.20%
    CSV
    Figure 6-4Full-Journey Outcomes Flow Map: From AI Exposure to Customer Visits
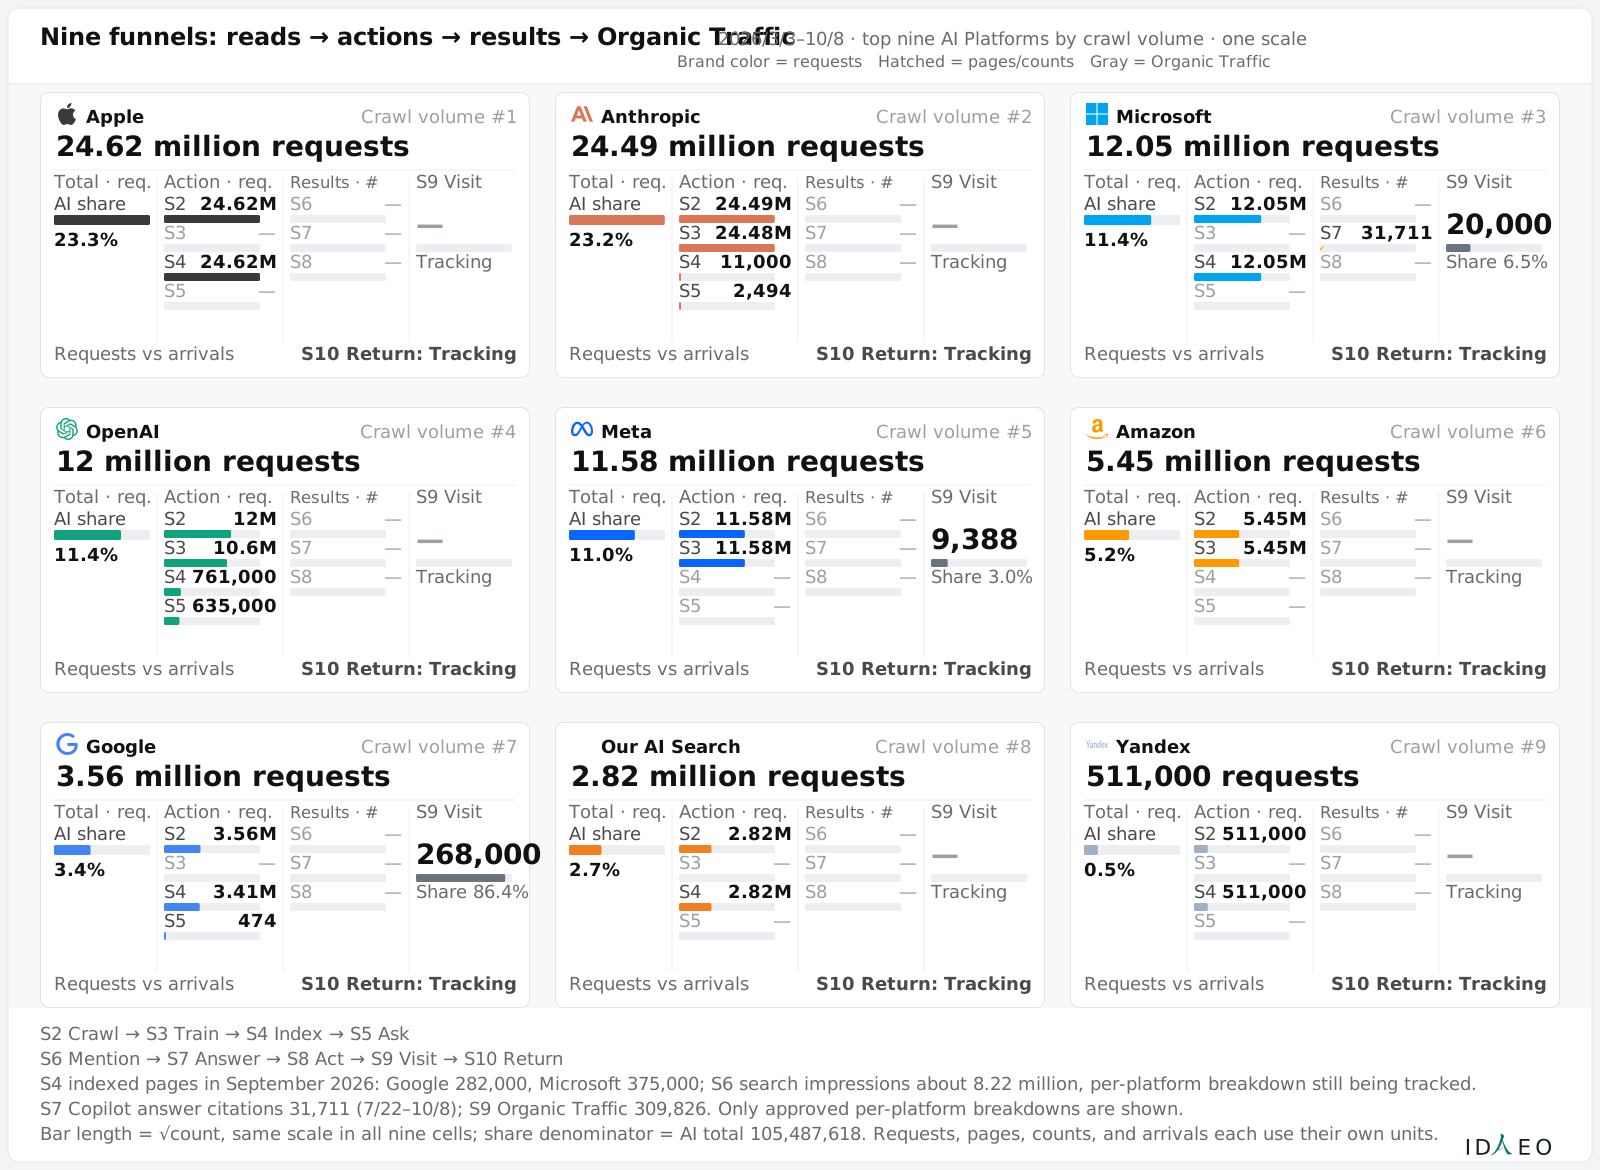
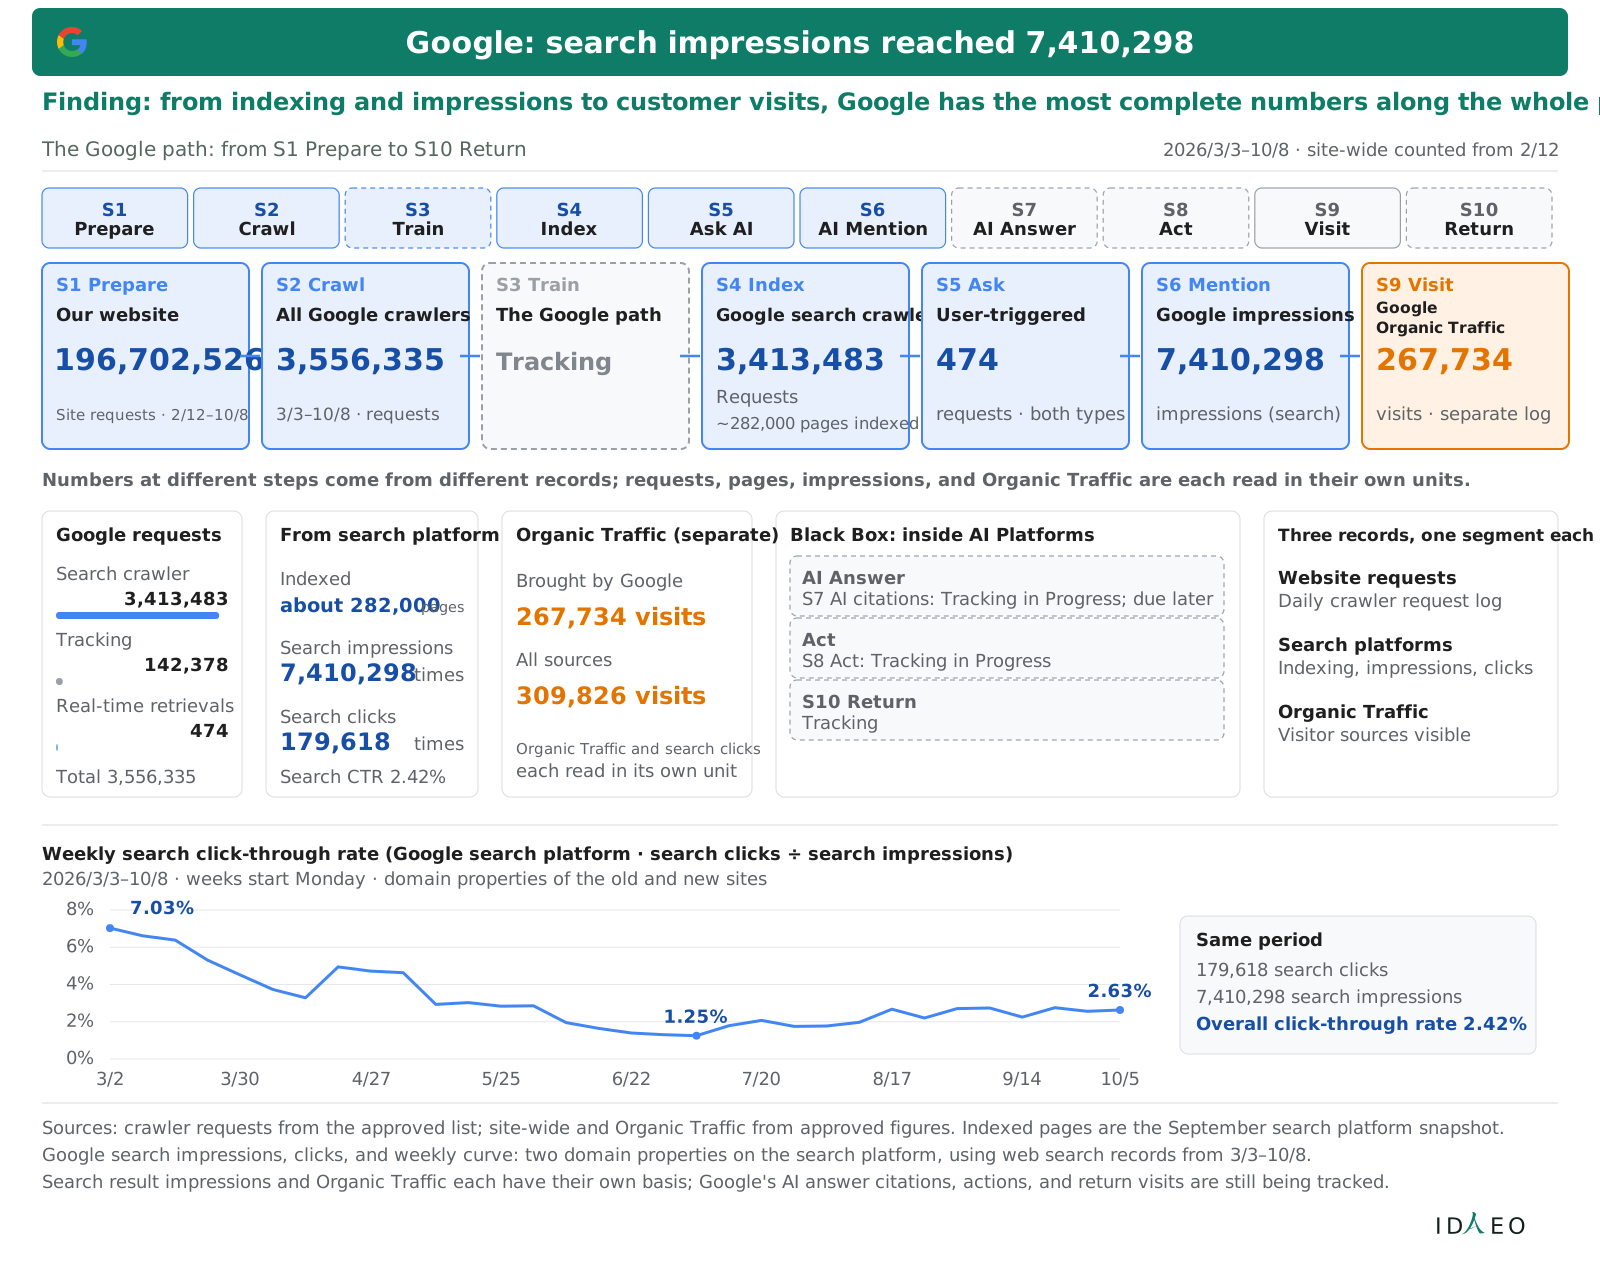
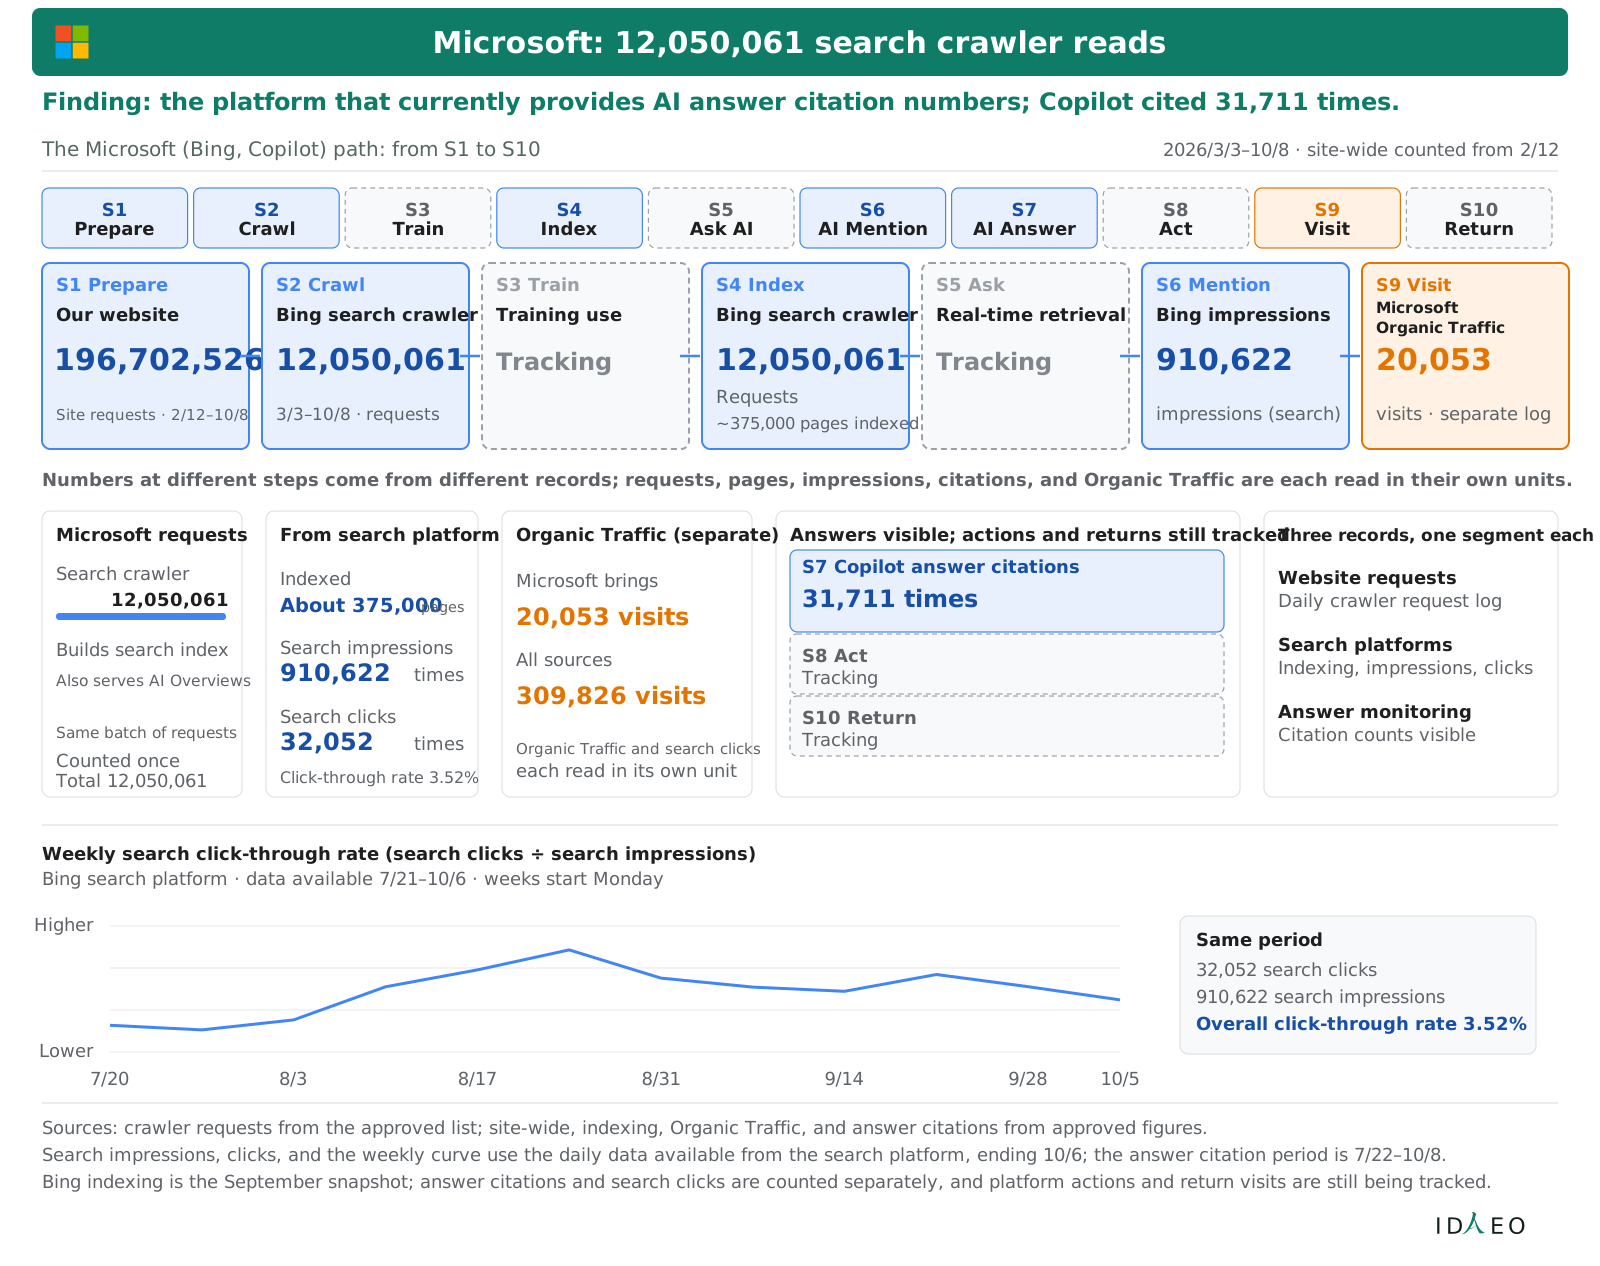
    Journey Results Comparison of Nine AI Platforms Same-scale comparison of each platform's crawl volume and referral results

    Same-scale comparison of each platform's crawl volume and referral results

    One platform per panel; read each step's results from left to right. Compare across panels using the same column and the same unit.

    • Nine funnels: reads → actions → results → Organic Traffic
    • 2026/3/3–10/8 · top nine AI Platforms by crawl volume · one scale
    • Brand color = requests Hatched = pages/counts Gray = Organic Traffic
    • Apple
    • Crawl volume #1
    • 24.62 million requests
    • Total · req.
    • Action · req.
    • Results · #
    • S9 Visit
    • AI share
    • 23.3%
    • S2
    • 24.62M
    • S3
    • —
    • S4
    • 24.62M
    • S5
    • —
    • S6
    • —
    • S7
    • —
    • S8
    • —
    • —
    • Tracking
    • Requests vs arrivals
    • S10 Return: Tracking
    • Anthropic
    • Crawl volume #2
    • 24.49 million requests
    • Total · req.
    • Action · req.
    • Results · #
    • S9 Visit
    • AI share
    • 23.2%
    • S2
    • 24.49M
    • S3
    • 24.48M
    • S4
    • 11,000
    • S5
    • 2,494
    • S6
    • —
    • S7
    • —
    • S8
    • —
    • —
    • Tracking
    • Requests vs arrivals
    • S10 Return: Tracking
    • Microsoft
    • Crawl volume #3
    • 12.05 million requests
    • Total · req.
    • Action · req.
    • Results · #
    • S9 Visit
    • AI share
    • 11.4%
    • S2
    • 12.05M
    • S3
    • —
    • S4
    • 12.05M
    • S5
    • —
    • S6
    • —
    • S7
    • 31,711
    • S8
    • —
    • 20,000
    • Share 6.5%
    • Requests vs arrivals
    • S10 Return: Tracking
    • OpenAI
    • Crawl volume #4
    • 12 million requests
    • Total · req.
    • Action · req.
    • Results · #
    • S9 Visit
    • AI share
    • 11.4%
    • S2
    • 12M
    • S3
    • 10.6M
    • S4
    • 761,000
    • S5
    • 635,000
    • S6
    • —
    • S7
    • —
    • S8
    • —
    • —
    • Tracking
    • Requests vs arrivals
    • S10 Return: Tracking
    • Meta
    • Crawl volume #5
    • 11.58 million requests
    • Total · req.
    • Action · req.
    • Results · #
    • S9 Visit
    • AI share
    • 11.0%
    • S2
    • 11.58M
    • S3
    • 11.58M
    • S4
    • —
    • S5
    • —
    • S6
    • —
    • S7
    • —
    • S8
    • —
    • 9,388
    • Share 3.0%
    • Requests vs arrivals
    • S10 Return: Tracking
    • Amazon
    • Crawl volume #6
    • 5.45 million requests
    • Total · req.
    • Action · req.
    • Results · #
    • S9 Visit
    • AI share
    • 5.2%
    • S2
    • 5.45M
    • S3
    • 5.45M
    • S4
    • —
    • S5
    • —
    • S6
    • —
    • S7
    • —
    • S8
    • —
    • —
    • Tracking
    • Requests vs arrivals
    • S10 Return: Tracking
    • Google
    • Crawl volume #7
    • 3.56 million requests
    • Total · req.
    • Action · req.
    • Results · #
    • S9 Visit
    • AI share
    • 3.4%
    • S2
    • 3.56M
    • S3
    • —
    • S4
    • 3.41M
    • S5
    • 474
    • S6
    • —
    • S7
    • —
    • S8
    • —
    • 268,000
    • Share 86.4%
    • Requests vs arrivals
    • S10 Return: Tracking
    • Our AI Search
    • Crawl volume #8
    • 2.82 million requests
    • Total · req.
    • Action · req.
    • Results · #
    • S9 Visit
    • AI share
    • 2.7%
    • S2
    • 2.82M
    • S3
    • —
    • S4
    • 2.82M
    • S5
    • —
    • S6
    • —
    • S7
    • —
    • S8
    • —
    • —
    • Tracking
    • Requests vs arrivals
    • S10 Return: Tracking
    • Yandex
    • Crawl volume #9
    • 511,000 requests
    • Total · req.
    • Action · req.
    • Results · #
    • S9 Visit
    • AI share
    • 0.5%
    • S2
    • 511,000
    • S3
    • —
    • S4
    • 511,000
    • S5
    • —
    • S6
    • —
    • S7
    • —
    • S8
    • —
    • —
    • Tracking
    • Requests vs arrivals
    • S10 Return: Tracking
    • S2 Crawl → S3 Train → S4 Index → S5 Ask
    • S6 Mention → S7 Answer → S8 Act → S9 Visit → S10 Return
    • S4 indexed pages in September 2026: Google 282,000, Microsoft 375,000; S6 search impressions about 8.22 million, per-platform breakdown still being tracked.
    • S7 Copilot answer citations 31,711 (7/22–10/8); S9 Organic Traffic 309,826. Only approved per-platform breakdowns are shown.
    • Bar length = √count, same scale in all nine cells; share denominator = AI total 105,487,618. Requests, pages, counts, and arrivals each use their own units.
    • ID
    • EO

    Related figures:Figure 6-4、Figure 6-6

    Journey Results Comparison of Nine AI Platforms
    ItemTotal · req.S3S4S5S7S9 VisitAI share
    Apple24.62 million requests—24.62M———23.3%
    Anthropic24.49 million24.48M11,0002,494——23.2%
    Microsoft12.05 million—12.05M—31,71120,00011.4%
    OpenAI12 million10.6M761,000635,000——11.4%
    Meta11.58 million11.58M———9,38811.0%
    Amazon5.45 million5.45M————5.2%
    Google3.56 million—3.41M474—268,0003.4%
    Our AI Search2.82 million—2.82M———2.7%
    Yandex511,000—511,000———0.5%
    CSV
    Figure 6-5Journey Results Comparison of Nine AI Platforms
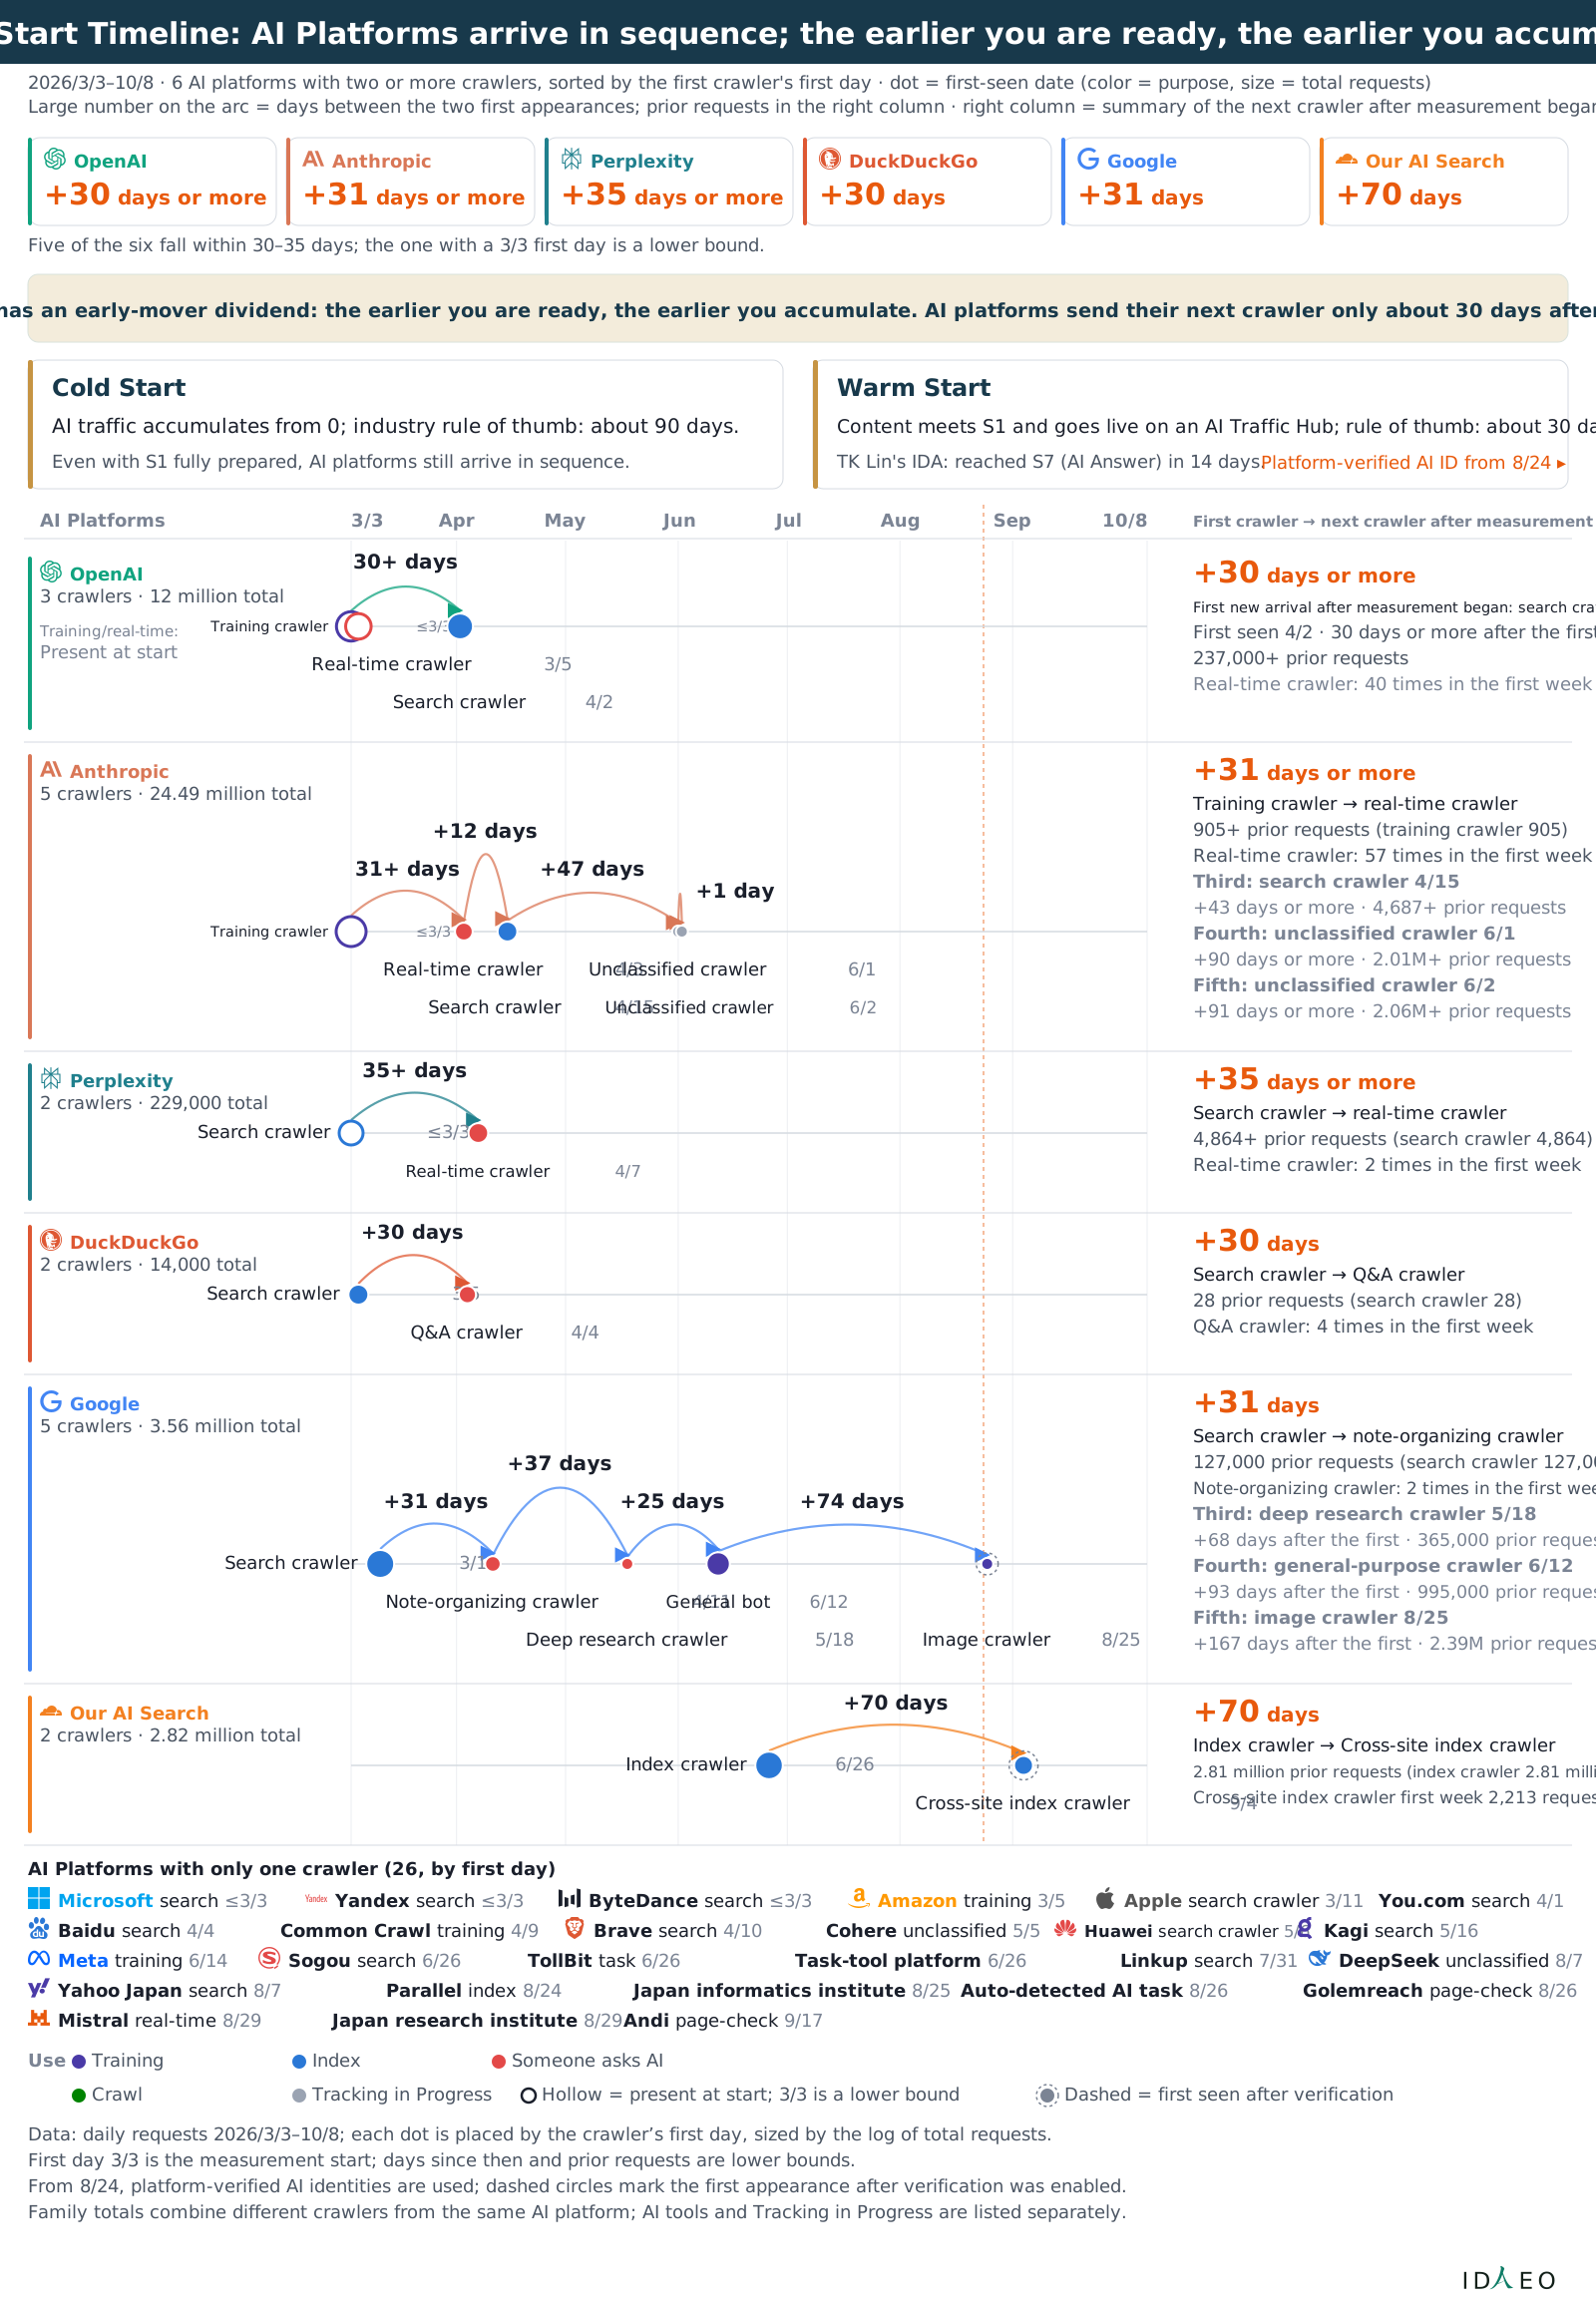
    Cold Start Timeline: AI Platforms Arriving in Sequence and the Early-Mover Dividend Cold start and early dividends: the rhythm in which AI platforms arrive one after another

    Cold start and early dividends: the rhythm in which AI platforms arrive one after another

    Each row is one of the AI Platforms, with time on the horizontal axis. The 30–35 days is the gap between the first crawler and the next from the same platform. This is an observation from a single site; for three platforms, the interval is a lower bound. Figure 7-1, “IDAEO Growth Milestones,” shows this site's cumulative volume. Records before Aug 24 may include duplicate requests. Arrival records are still needed to assess whether earlier readiness leads to earlier accumulation.

    • Cold Start Timeline: AI Platforms arrive in sequence; the earlier you are ready, the earlier you accumulate
    • 2026/3/3–10/8 · 6 AI platforms with two or more crawlers, sorted by the first crawler's first day · dot = first-seen date (color = purpose, size = total requests)
    • Large number on the arc = days between the two first appearances; prior requests in the right column · right column = summary of the next crawler after measurement began
    • OpenAI
    • +30 days or more
    • Anthropic
    • +31 days or more
    • Perplexity
    • +35 days or more
    • DuckDuckGo
    • +30 days
    • Google
    • +31 days
    • Our AI Search
    • +70 days
    • Five of the six fall within 30–35 days; the one with a 3/3 first day is a lower bound.
    • AI traffic has an early-mover dividend: the earlier you are ready, the earlier you accumulate. AI platforms send their next crawler only about 30 days after the first.
    • Cold Start
    • AI traffic accumulates from 0; industry rule of thumb: about 90 days.
    • Even with S1 fully prepared, AI platforms still arrive in sequence.
    • Warm Start
    • Content meets S1 and goes live on an AI Traffic Hub; rule of thumb: about 30 days.
    • TK Lin's IDA: reached S7 (AI Answer) in 14 days.
    • AI Platforms
    • First crawler → next crawler after measurement began
    • 3/3
    • Apr
    • May
    • Jun
    • Jul
    • Aug
    • Sep
    • 10/8
    • Platform-verified AI ID from 8/24 ▸
    • OpenAI
    • 3 crawlers · 12 million total
    • Training/real-time:
    • Present at start
    • 30+ days
    • Training crawler ≤3/3
    • Real-time crawler 3/5
    • Search crawler 4/2
    • +30 days or more
    • First new arrival after measurement began: search crawler
    • First seen 4/2 · 30 days or more after the first
    • 237,000+ prior requests
    • Real-time crawler: 40 times in the first week
    • Anthropic
    • 5 crawlers · 24.49 million total
    • 31+ days
    • +12 days
    • +47 days
    • +1 day
    • Training crawler ≤3/3
    • Real-time crawler 4/3
    • Search crawler 4/15
    • Unclassified crawler 6/1
    • Unclassified crawler 6/2
    • +31 days or more
    • Training crawler → real-time crawler
    • 905+ prior requests (training crawler 905)
    • Real-time crawler: 57 times in the first week
    • Third: search crawler 4/15
    • +43 days or more · 4,687+ prior requests
    • Fourth: unclassified crawler 6/1
    • +90 days or more · 2.01M+ prior requests
    • Fifth: unclassified crawler 6/2
    • +91 days or more · 2.06M+ prior requests
    • Perplexity
    • 2 crawlers · 229,000 total
    • 35+ days
    • Search crawler ≤3/3
    • Real-time crawler 4/7
    • +35 days or more
    • Search crawler → real-time crawler
    • 4,864+ prior requests (search crawler 4,864)
    • Real-time crawler: 2 times in the first week
    • DuckDuckGo
    • 2 crawlers · 14,000 total
    • +30 days
    • Search crawler 3/5
    • Q&A crawler 4/4
    • +30 days
    • Search crawler → Q&A crawler
    • 28 prior requests (search crawler 28)
    • Q&A crawler: 4 times in the first week
    • Google
    • 5 crawlers · 3.56 million total
    • +31 days
    • +37 days
    • +25 days
    • +74 days
    • Search crawler 3/11
    • Note-organizing crawler 4/11
    • Deep research crawler 5/18
    • General bot 6/12
    • Image crawler 8/25
    • +31 days
    • Search crawler → note-organizing crawler
    • 127,000 prior requests (search crawler 127,000)
    • Note-organizing crawler: 2 times in the first week
    • Third: deep research crawler 5/18
    • +68 days after the first · 365,000 prior requests
    • Fourth: general-purpose crawler 6/12
    • +93 days after the first · 995,000 prior requests
    • Fifth: image crawler 8/25
    • +167 days after the first · 2.39M prior requests
    • Our AI Search
    • 2 crawlers · 2.82 million total
    • +70 days
    • Index crawler 6/26
    • Cross-site index crawler 9/4
    • +70 days
    • Index crawler → Cross-site index crawler
    • 2.81 million prior requests (index crawler 2.81 million)
    • Cross-site index crawler first week 2,213 requests
    • AI Platforms with only one crawler (26, by first day)
    • Microsoft search ≤3/3
    • Yandex search ≤3/3
    • ByteDance search ≤3/3
    • Amazon training 3/5
    • Apple search crawler 3/11
    • You.com search 4/1
    • Baidu search 4/4
    • Common Crawl training 4/9
    • Brave search 4/10
    • Cohere unclassified 5/5
    • Huawei search crawler 5/6
    • Kagi search 5/16
    • Meta training 6/14
    • Sogou search 6/26
    • TollBit task 6/26
    • Task-tool platform 6/26
    • Linkup search 7/31
    • DeepSeek unclassified 8/7
    • Yahoo Japan search 8/7
    • Parallel index 8/24
    • Japan informatics institute 8/25
    • Auto-detected AI task 8/26
    • Golemreach page-check 8/26
    • Mistral real-time 8/29
    • Japan research institute 8/29
    • Andi page-check 9/17
    • Use
    • Training
    • Index
    • Someone asks AI
    • Crawl
    • Tracking in Progress
    • Hollow = present at start; 3/3 is a lower bound
    • Dashed = first seen after verification
    • Data: daily requests 2026/3/3–10/8; each dot is placed by the crawler’s first day, sized by the log of total requests.
    • First day 3/3 is the measurement start; days since then and prior requests are lower bounds.
    • From 8/24, platform-verified AI identities are used; dashed circles mark the first appearance after verification was enabled.
    • Family totals combine different crawlers from the same AI platform; AI tools and Tracking in Progress are listed separately.
    • ID
    • EO

    Related figures:Figure 6-5、Figure 7-1、Figure 8-2、Figure 6-1

    Figure 6-6Cold Start Timeline: AI Platforms Arriving in Sequence and the Early-Mover Dividend

    The foundation is measurement sources and field results

    Measurement Sources and the AI Black Box

    The Data Foundation of Performance Measurement

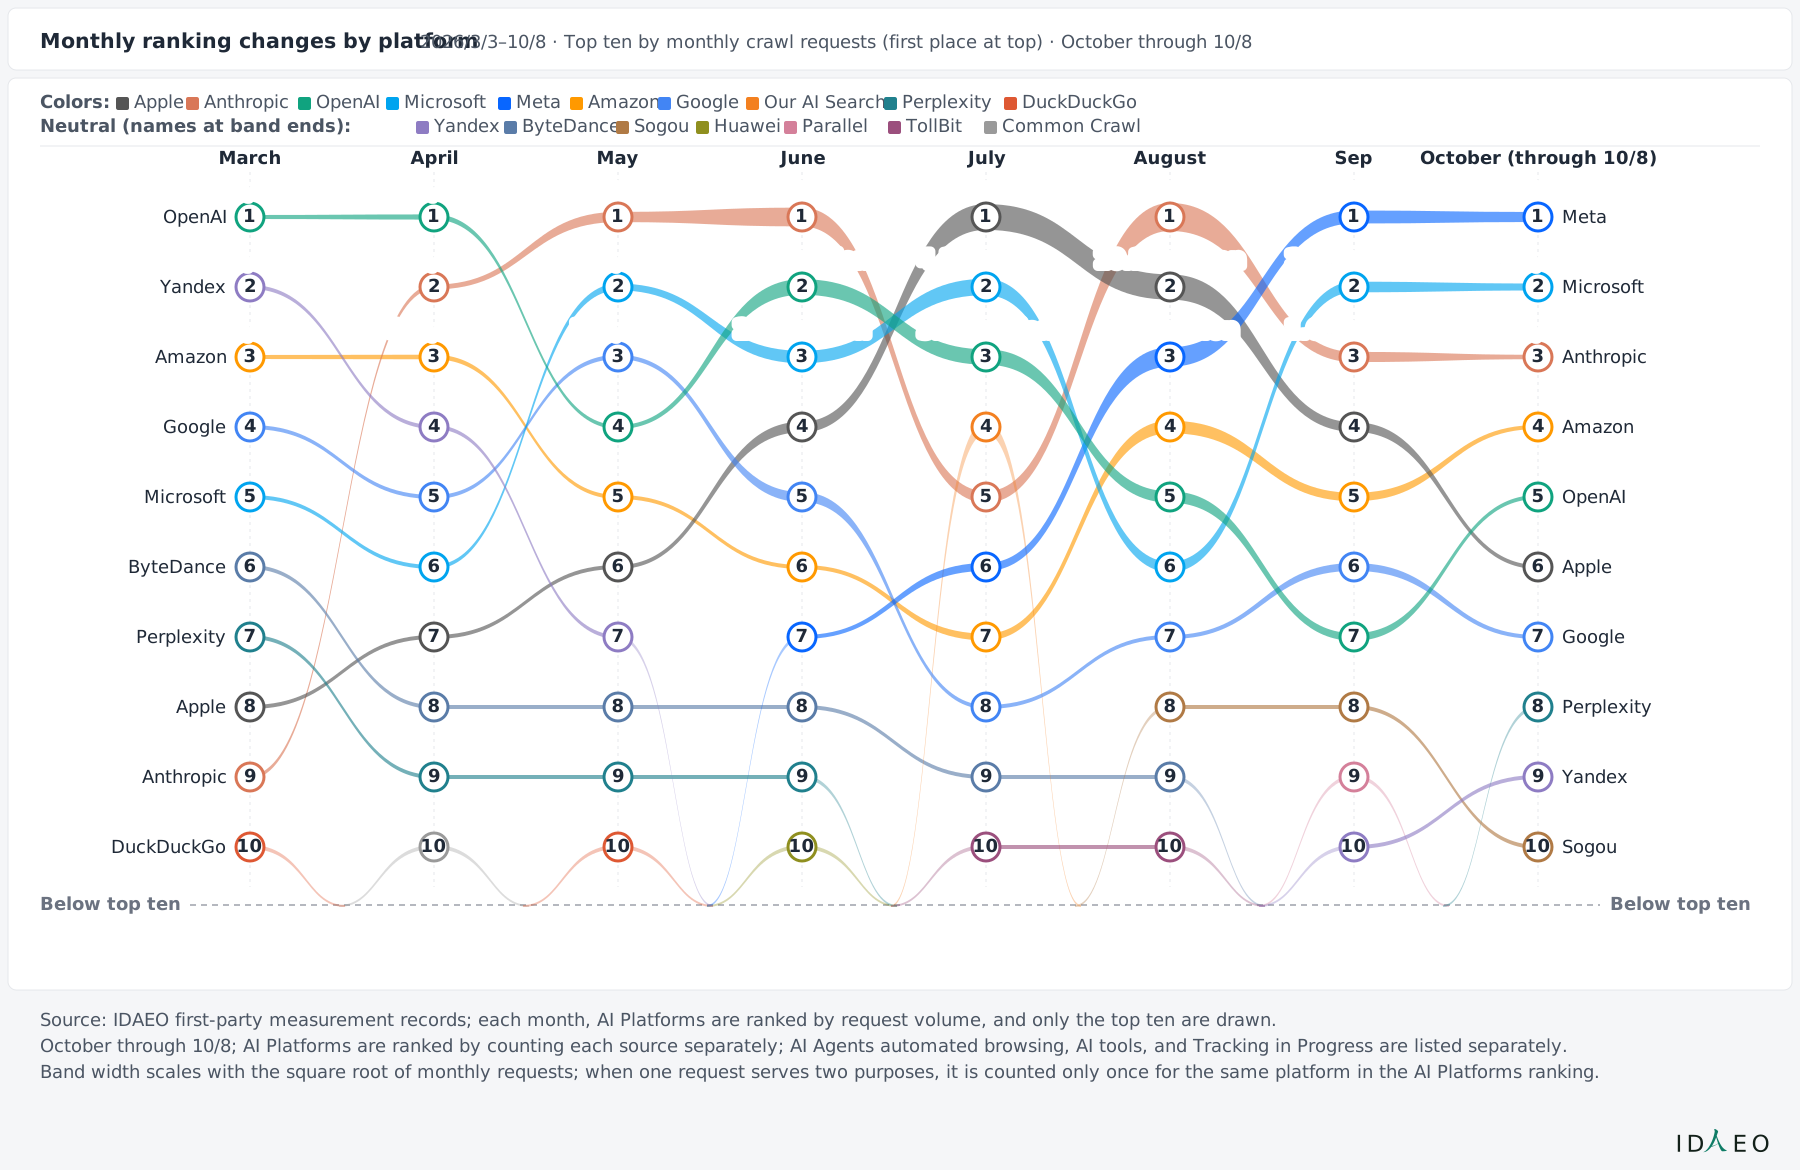
    10
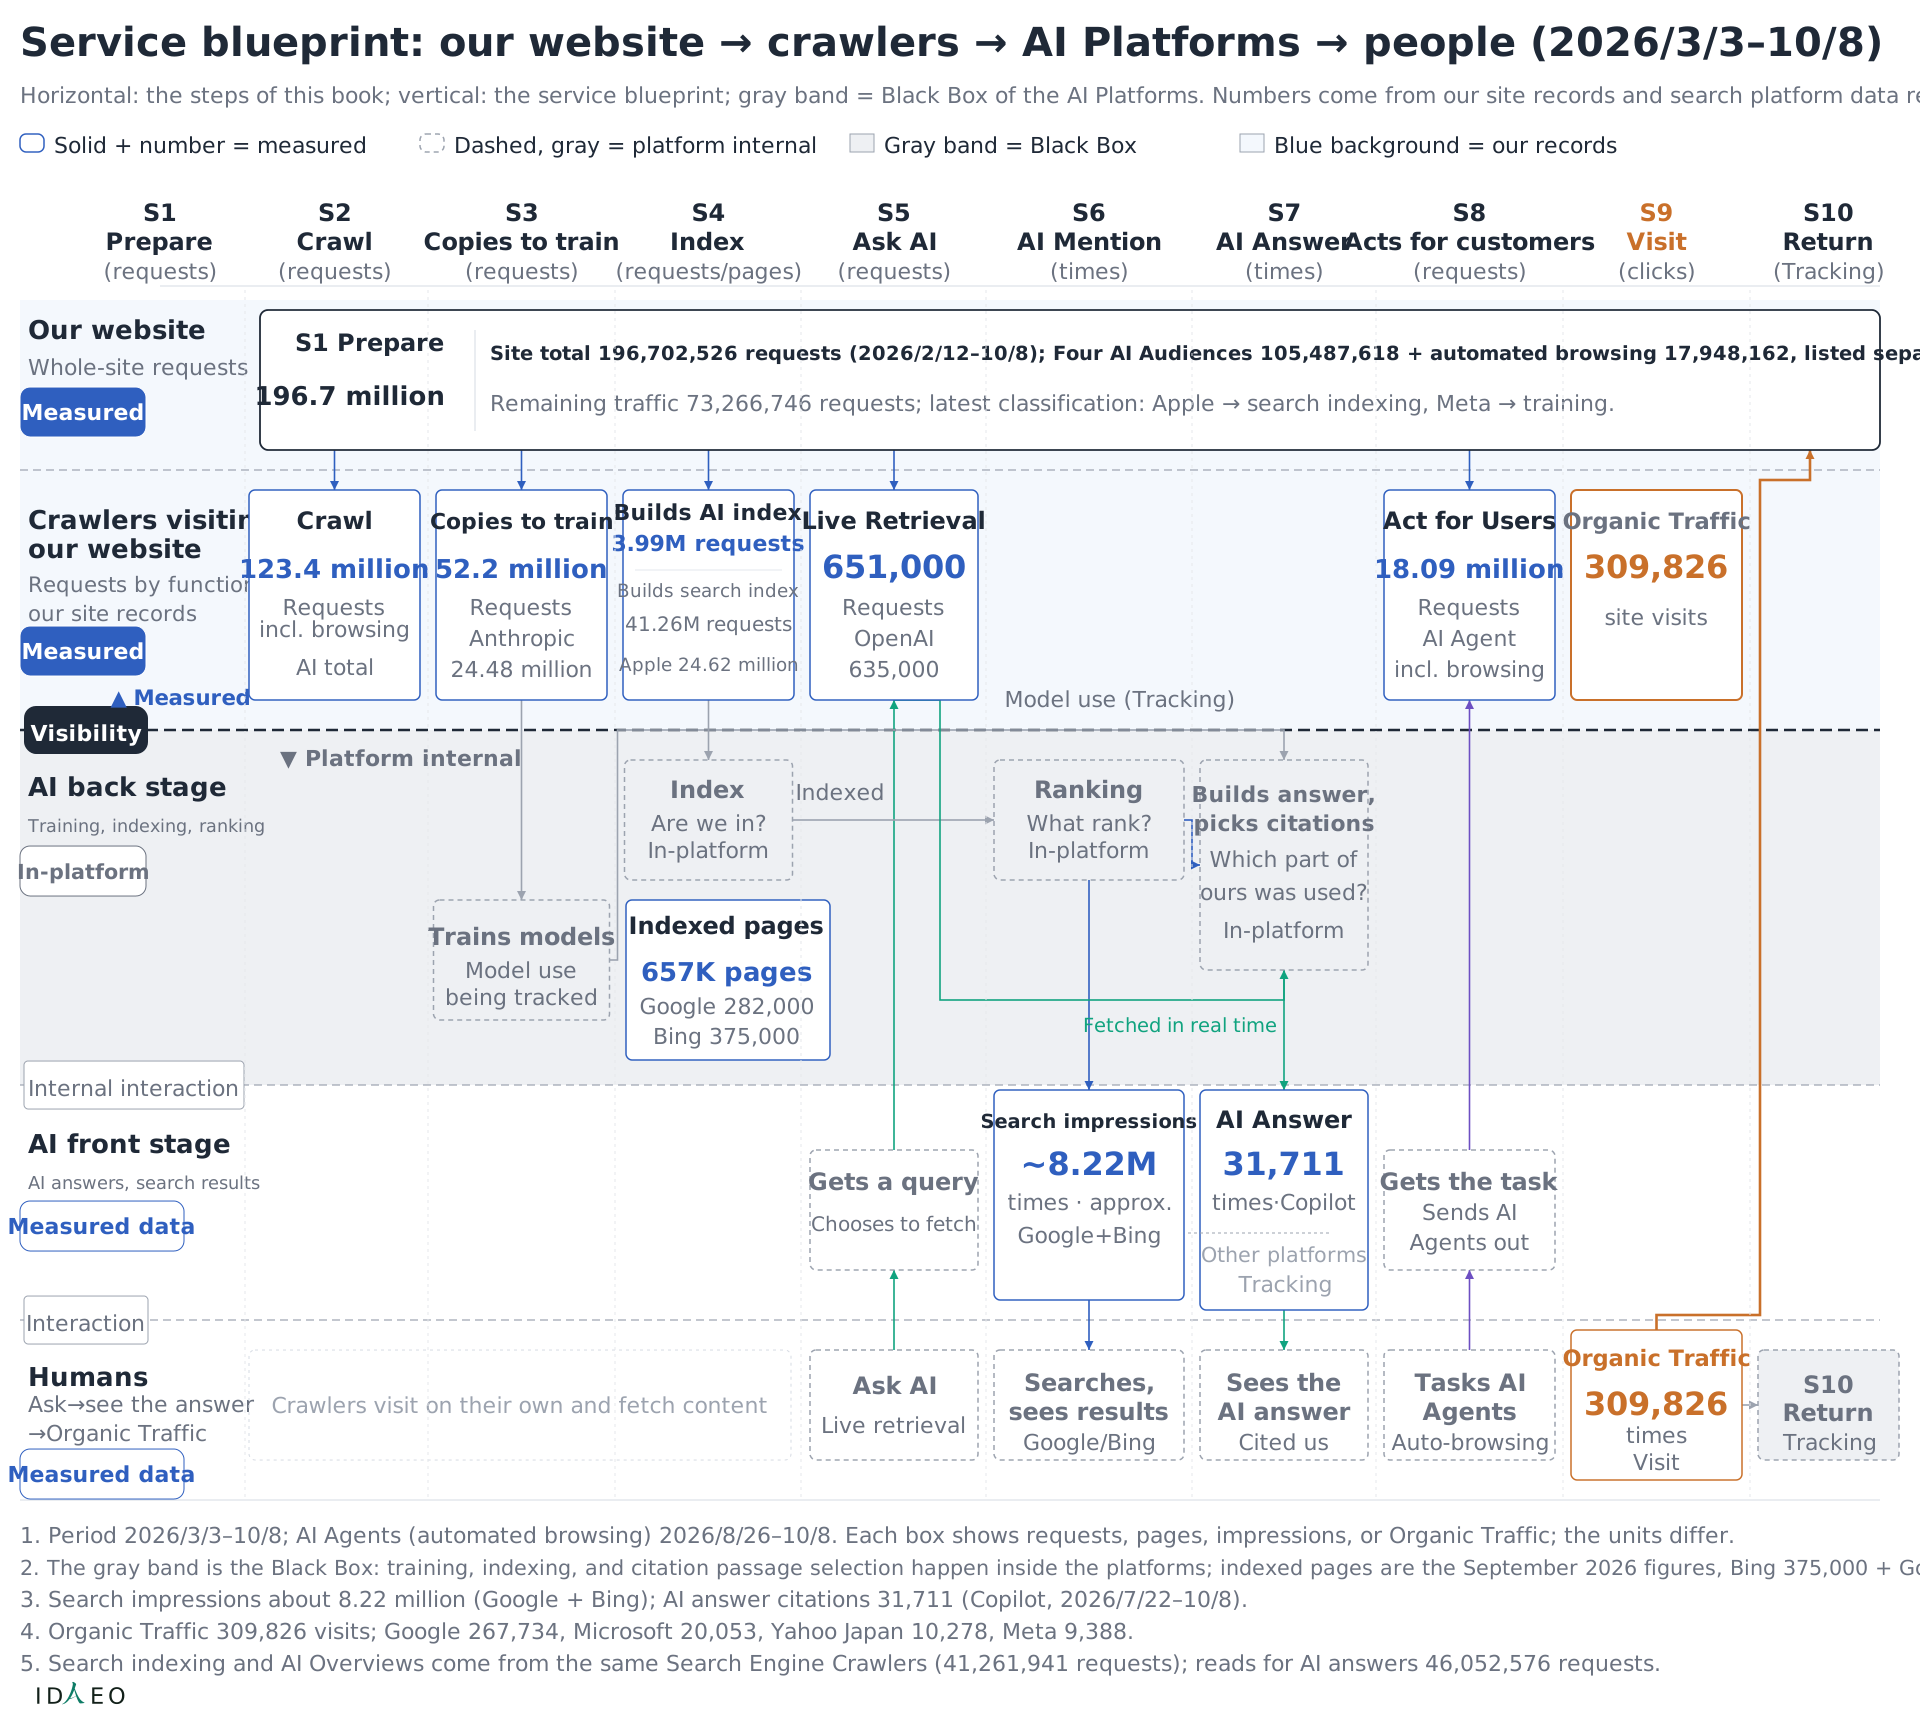
    IDAEO Measurement Service Blueprint Division of measurement among websites, crawlers, the back end and front end of AI platforms, and humans

    Division of measurement among websites, crawlers, the back end and front end of AI platforms, and humans

    Read from top to bottom, from website to person, and compare each layer's results with the scope of ongoing tracking.

    • Service blueprint: our website → crawlers → AI Platforms → people (2026/3/3–10/8)
    • Horizontal: the steps of this book; vertical: the service blueprint; gray band = Black Box of the AI Platforms. Numbers come from our site records and search platform data respectively.
    • Solid + number = measured
    • Dashed, gray = platform internal
    • Gray band = Black Box
    • Blue background = our records
    • Interaction
    • Visibility
    • Internal interaction
    • ▲ Measured
    • ▼ Platform internal
    • Humans
    • Ask→see the answer→Organic Traffic
    • Measured data
    • AI front stage
    • AI answers, search results
    • Measured data
    • AI back stage
    • Training, indexing, ranking
    • In-platform
    • Crawlers visitingour website
    • Requests by function:our site records
    • Measured
    • Our website
    • Whole-site requests
    • Measured
    • Crawlers visit on their own and fetch content
    • Ask AI
    • Live retrieval
    • Tasks AIAgents
    • Auto-browsing
    • Searches,sees results
    • Google/Bing
    • Sees theAI answer
    • Cited us
    • Organic Traffic
    • 309,826
    • times
    • Visit
    • Gets a query
    • Chooses to fetch
    • Gets the task
    • Sends AIAgents out
    • Search impressions
    • ~8.22M
    • times · approx.
    • Google+Bing
    • AI Answer
    • 31,711
    • times·Copilot
    • Other platforms
    • Tracking
    • Index
    • Are we in?
    • In-platform
    • Indexed pages
    • 657K pages
    • Google 282,000
    • Bing 375,000
    • Ranking
    • What rank?
    • In-platform
    • Trains models
    • Model usebeing tracked
    • Builds answer,picks citations
    • Which part ofours was used?
    • In-platform
    • Crawl
    • 123.4 million
    • Requests
    • incl. browsing
    • AI total
    • Copies to train
    • 52.2 million
    • Requests
    • Anthropic
    • 24.48 million
    • Builds AI index
    • 3.99M requests
    • Builds search index
    • 41.26M requests
    • Apple 24.62 million
    • Live Retrieval
    • 651,000
    • Requests
    • OpenAI
    • 635,000
    • Act for Users
    • 18.09 million
    • Requests
    • AI Agent
    • incl. browsing
    • Organic Traffic
    • 309,826
    • site visits
    • S1 Prepare
    • 196.7 million
    • Site total 196,702,526 requests (2026/2/12–10/8); Four AI Audiences 105,487,618 + automated browsing 17,948,162, listed separately.
    • Remaining traffic 73,266,746 requests; latest classification: Apple → search indexing, Meta → training.
    • 1. Period 2026/3/3–10/8; AI Agents (automated browsing) 2026/8/26–10/8. Each box shows requests, pages, impressions, or Organic Traffic; the units differ.
    • 2. The gray band is the Black Box: training, indexing, and citation passage selection happen inside the platforms; indexed pages are the September 2026 figures, Bing 375,000 + Google 282,000.
    • 3. Search impressions about 8.22 million (Google + Bing); AI answer citations 31,711 (Copilot, 2026/7/22–10/8).
    • 4. Organic Traffic 309,826 visits; Google 267,734, Microsoft 20,053, Yahoo Japan 10,278, Meta 9,388.
    • 5. Search indexing and AI Overviews come from the same Search Engine Crawlers (41,261,941 requests); reads for AI answers 46,052,576 requests.
    • S1
    • (requests)
    • S2
    • (requests)
    • S3
    • (requests)
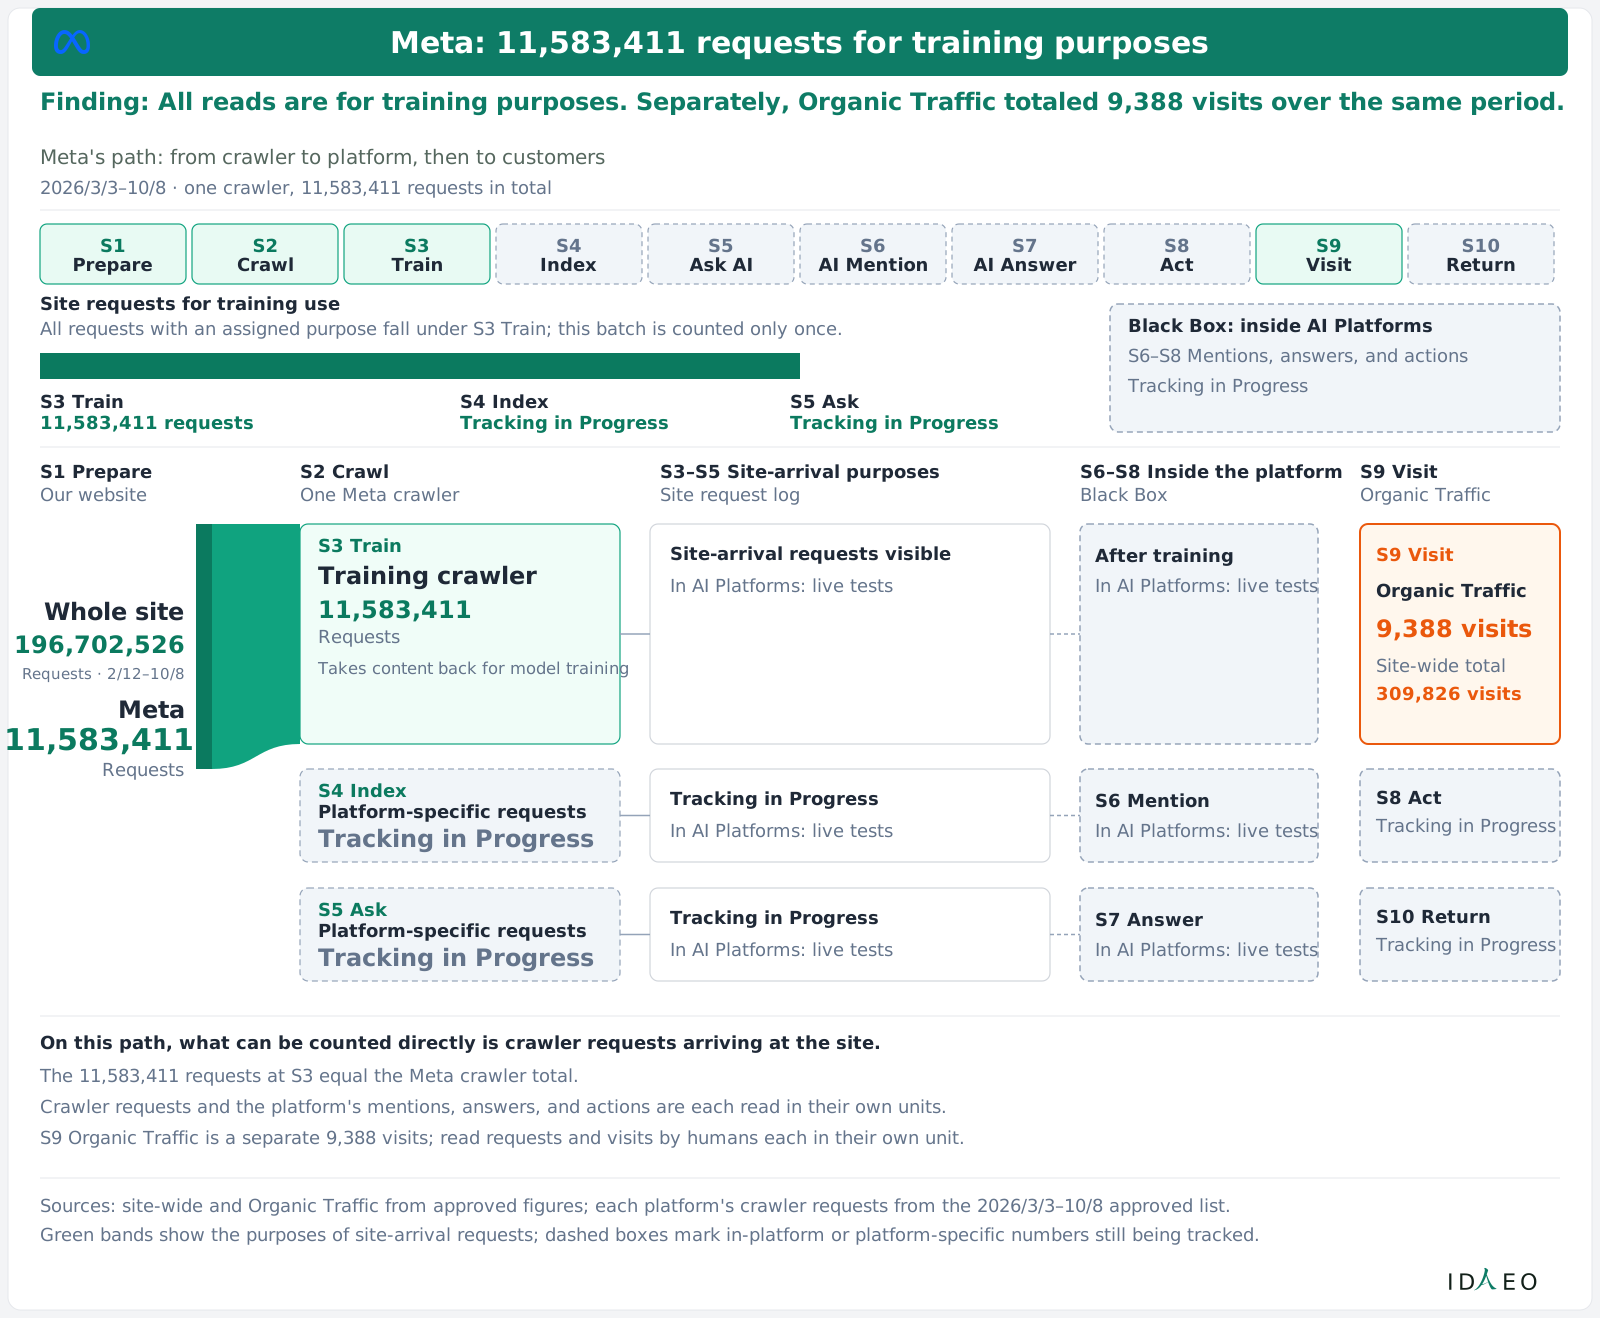
    • S4
    • (requests/pages)
    • S5
    • (requests)
    • S6
    • (times)
    • S7
    • (times)
    • S8
    • (requests)
    • S9
    • (clicks)
    • S10
    • (Tracking)
    • S10 Return
    • Tracking
    • Indexed
    • Model use (Tracking)
    • Fetched in real time
    • ID
    • EO
    • Prepare
    • Crawl
    • Copies to train
    • Index
    • Ask AI
    • AI Mention
    • AI Answer
    • Acts for customers
    • Visit
    • Return

    Related figures:Figure 3-2、Figure 6-1

    Figure 3-1IDAEO Measurement Service Blueprint
    Content Journey Map and the AI Black Box Measurement results for each journey phase and the AI black box

    Measurement results for each journey phase and the AI black box

    Read the journey phases horizontally, comparing the number cells with the live-test topics inside the black box.

    • Content Journey Map for the AI Era: S1 to S10 (2026/3/3–10/8)
    • Four phases, ten steps; gray dashed boxes mark the inside of AI Platforms. Site-wide 196,702,526 requests.
    • Readiness
    • Phase One · S1
    • Phase Two: AI Information Acquisition
    • S2–S4
    • Phase Three: AI-Assisted Decision and Action
    • S5–S8
    • Phase Four: Convert & Return
    • S9–S10
    • S1 Prepare
    • (requests)
    • S2 Crawl
    • (requests)
    • S3 Train
    • (requests)
    • S4 Index
    • (requests)
    • S5 Ask
    • (requests)
    • S6 Mention
    • (impressions)
    • S7 Answer
    • (citations)
    • S8 Act
    • (requests)
    • S9 Visit
    • (Organic Traffic)
    • S10 Return
    • (Tracking)
    • Who acts
    • Target
    • Measured
    • count
    • Black Box
    • Platforminternal
    • Site share
    • requests
    • Volume curve
    • square-root scale
    • Merchant
    • Website
    • Search Engine
    • AI Crawlers
    • AI Crawlers
    • Search Engine
    • AI Platforms
    • AI Crawlers
    • Search engines
    • AI Platforms
    • AI Agent
    • Humans
    • Humans
    • AI Platforms
    • 196,702,526
    • Requests
    • 2/12–10/8
    • 105,487,618
    • Requests
    • AI and search engines
    • 52,203,119
    • Requests
    • Training collection
    • 45,253,224
    • Requests
    • Both indexes
    • 650,528
    • Requests
    • Live Retrieval
    • ~8.22M
    • times
    • Search impressions
    • 31,711
    • times
    • Copilot citations
    • 7/22–10/8
    • 17,948,162
    • Requests
    • 8/26–10/8
    • 309,826
    • times
    • Organic Traffic
    • Tracking
    • Tracking
    • Found by AIs
    • Identity: Tracking
    • How content is filed and ranked after reading
    • Platform internals: Tracking
    • How choices are made after AI mentions and answers
    • External records: ongoing tracking
    • Whether customers ask again later
    • Tracking
    • Site baseline
    • 53.63%
    • 26.54%
    • 23.01%
    • 0.33%
    • Different units
    • Different units
    • 9.12%
    • Separate log
    • Tracking
    • S3 and S4 are binned by each family's primary use and are mutually exclusive in this table; S6, S7, and S9 use units other than requests.
    • 196,702,526
    • Phase 1
    • 105,487,618
    • Phase 2
    • 17,948,162
    • Phase 3
    • 309,826
    • Phase 4
    • Source: crawler requests follow the approved list; site-wide totals, use categories, Organic Traffic, citations, and search impressions follow approved values.
    • S4 total = AI indexing 3,991,283 + search indexing/AI Overviews 41,261,941; each type is counted once in this table.
    • The curve only indicates the order of magnitude of the four phases: S1 site-wide, S2 AI requests, S8 automated browsing, S9 Organic Traffic; each unit shows its own magnitude.
    • ID
    • EO

    Related figures:Figure 3-6、Figure 3-1、Figure 3-3、Figure 6-3

    Figure 3-2Content Journey Map and the AI Black Box
    Journey Outcome Matrix Across AI Platforms Summary table of records across S1–S10 for all AI platforms

    Summary table of records across S1–S10 for all AI platforms

    One row per platform, S1 to S10 across; nodes mark published results, and the rest should be read as still being tracked. In the figure, S6 lists search impressions (not AI mentions), meaning the number of times you appear in search results. The mention rate in AI answers will be published later.

    • Journey Outcome Matrix Across AI Platforms
    • How far each one gets (S1→S10)
    • S1
    • Prepare
    • 196,702,526 requests
    • S2
    • Crawl
    • 105,487,618 requests
    • S3
    • Copies to train
    • 52,203,119 requests
    • S4
    • Index
    • 45,253,224 requests
    • S5
    • Someone asks AI
    • 650,528 requests
    • S6
    • AI Mention
    • about 8.22 million times
    • S7
    • AI Answer
    • 31,711 times
    • S8
    • Acts for customers
    • 18,091,884 requests
    • S9
    • Visit
    • 309,826 clicks
    • S10
    • Return
    • Tracking in Progress
    • Readiness
    • AI Information Acquisition
    • AI-Assisted Decision and Action
    • Conversion & Return
    • S1
    • S2
    • S3
    • S4
    • S5
    • S6
    • S7
    • S8
    • S9
    • S10
    • AI Platforms/Categories
    • Left column total 105,487,618 requests; automated browsing counted separately.
    • Apple
    • 24,615,429
    • 24,615,429
    • Anthropic
    • 24,492,504
    • 24,479,305
    • 10,705
    • 2,494
    • Microsoft
    • 12,050,061
    • 12,050,061
    • 375,000 pages
    • 910,622
    • 31,711
    • 20,053
    • OpenAI
    • 11,998,898
    • 10,602,782
    • 760,806
    • 635,310
    • Meta
    • 11,583,411
    • 11,583,411
    • 9,388
    • Amazon
    • 5,454,011
    • 5,454,011
    • Google
    • 3,413,957
    • 3,413,483
    • 282,000 pages
    • 474
    • 7,410,298
    • 267,734
    • Our AI Search
    • 2,815,693
    • 2,815,693
    • Yandex
    • 511,159
    • 511,159
    • ByteDance
    • 255,863
    • 255,863
    • Sogou
    • 253,223
    • 253,223
    • Perplexity
    • 228,656
    • 218,062
    • 10,594
    • TollBit
    • 126,292
    • 126,292
    • Parallel
    • 125,562
    • 125,562
    • Huawei
    • 114,316
    • 114,316
    • Linkup
    • 60,455
    • 60,455
    • Common Crawl
    • 19,054
    • 19,054
    • DuckDuckGo
    • 14,008
    • 12,384
    • 1,624
    • 1,049
    • DeepSeek
    • Merged into Tracking in Progress
    • mcpbeat
    • 7,925
    • 7,925
    • Other platforms
    • 115,218
    • 64,556
    • 36,023
    • 32
    • 14,607
    • 11,602
    • AI Agents (browsing)
    • 17,948,162
    • 17,948,162
    • AI Tools
    • 7,079,310
    • Tracking in Progress
    • 152,613
    • Node height uses a log scale; gray bars represent pages, counts, or clicks. Category rows are already included in the left-side total traffic.
    • Site-wide requests from 2/12; crawler requests from 3/3. The search impressions overview uses the approved rounded figure; per-platform breakdowns use actual data.
    • ID
    • EO

    Related figures:Figure 3-2、Figure 3-4、Figure 3-7、Figure 3-5、Figure 3-8、Figure 3-9、Figure 3-10

    Figure 3-3Journey Outcome Matrix Across AI Platforms
    Google: 7,410,298 search impressions|The platform with the most complete numbers along the whole path Google's crawls, search impressions, and customer arrivals can be compared in sequence along the journey

    Google's crawls, search impressions, and customer arrivals can be compared in sequence along the journey

    Read each step from left to right; check source, period, and unit first, then compare numbers on the same basis.

    • Google: search impressions reached 7,410,298
    • Finding: from indexing and impressions to customer visits, Google has the most complete numbers along the whole path.
    • The Google path: from S1 Prepare to S10 Return
    • 2026/3/3–10/8 · site-wide counted from 2/12
    • S1
    • Prepare
    • S2
    • Crawl
    • S3
    • Train
    • S4
    • Index
    • S5
    • Ask AI
    • S6
    • AI Mention
    • S7
    • AI Answer
    • S8
    • Act
    • S9
    • Visit
    • S10
    • Return
    • S1 Prepare
    • Our website
    • 196,702,526
    • Site requests · 2/12–10/8
    • S2 Crawl
    • All Google crawlers
    • 3,556,335
    • 3/3–10/8 · requests
    • S3 Train
    • The Google path
    • Tracking
    • S4 Index
    • Google search crawler
    • 3,413,483
    • Requests
    • ~282,000 pages indexed
    • S5 Ask
    • User-triggered
    • 474
    • requests · both types
    • S6 Mention
    • Google impressions
    • 7,410,298
    • impressions (search)
    • S9 Visit
    • GoogleOrganic Traffic
    • 267,734
    • visits · separate log
    • Numbers at different steps come from different records; requests, pages, impressions, and Organic Traffic are each read in their own units.
    • Google requests
    • Search crawler
    • 3,413,483
    • Tracking
    • 142,378
    • Real-time retrievals
    • 474
    • Total 3,556,335
    • From search platform
    • Indexed
    • about 282,000
    • pages
    • Search impressions
    • 7,410,298
    • times
    • Search clicks
    • 179,618
    • times
    • Search CTR 2.42%
    • Organic Traffic (separate)
    • Brought by Google
    • 267,734 visits
    • All sources
    • 309,826 visits
    • Organic Traffic and search clicks
    • each read in its own unit
    • Black Box: inside AI Platforms
    • AI Answer
    • S7 AI citations: Tracking in Progress; due later
    • Act
    • S8 Act: Tracking in Progress
    • S10 Return
    • Tracking
    • Three records, one segment each
    • Website requests
    • Daily crawler request log
    • Search platforms
    • Indexing, impressions, clicks
    • Organic Traffic
    • Visitor sources visible
    • Weekly search click-through rate (Google search platform · search clicks ÷ search impressions)
    • 2026/3/3–10/8 · weeks start Monday · domain properties of the old and new sites
    • 0%
    • 2%
    • 4%
    • 6%
    • 8%
    • 3/2
    • 3/30
    • 4/27
    • 5/25
    • 6/22
    • 7/20
    • 8/17
    • 9/14
    • 10/5
    • 7.03%
    • 1.25%
    • 2.63%
    • Same period
    • 179,618 search clicks
    • 7,410,298 search impressions
    • Overall click-through rate 2.42%
    • Sources: crawler requests from the approved list; site-wide and Organic Traffic from approved figures. Indexed pages are the September search platform snapshot.
    • Google search impressions, clicks, and weekly curve: two domain properties on the search platform, using web search records from 3/3–10/8.
    • Search result impressions and Organic Traffic each have their own basis; Google's AI answer citations, actions, and return visits are still being tracked.
    • ID
    • EO

    Related figures:Figure 3-3、Figure 3-7、Figure 3-5

    Google: 7,410,298 search impressions|The platform with the most complete numbers along the whole path
    ItemValueUnit
    Search crawler3,413,483Requests
    Tracking142,378Requests
    Real-time retrievals474Requests
    CSV
    Figure 3-4Google: 7,410,298 search impressions|The platform with the most complete numbers along the whole path
    Microsoft: 12,050,061 search crawler reads|The platform that currently provides AI answer citation numbers Microsoft's data connects search indexing, answer citations, and customer arrivals

    Microsoft's data connects search indexing, answer citations, and customer arrivals

    Compare with Figure 3-4 (Google), and note Microsoft's AI answer citation volume and its reporting period.

    • Microsoft: 12,050,061 search crawler reads
    • Finding: the platform that currently provides AI answer citation numbers; Copilot cited 31,711 times.
    • The Microsoft (Bing, Copilot) path: from S1 to S10
    • 2026/3/3–10/8 · site-wide counted from 2/12
    • S1
    • Prepare
    • S2
    • Crawl
    • S3
    • Train
    • S4
    • Index
    • S5
    • Ask AI
    • S6
    • AI Mention
    • S7
    • AI Answer
    • S8
    • Act
    • S9
    • Visit
    • S10
    • Return
    • S1 Prepare
    • Our website
    • 196,702,526
    • Site requests · 2/12–10/8
    • S2 Crawl
    • Bing search crawler
    • 12,050,061
    • 3/3–10/8 · requests
    • S3 Train
    • Training use
    • Tracking
    • S4 Index
    • Bing search crawler
    • 12,050,061
    • Requests
    • ~375,000 pages indexed
    • S5 Ask
    • Real-time retrieval
    • Tracking
    • S6 Mention
    • Bing impressions
    • 910,622
    • impressions (search)
    • S9 Visit
    • MicrosoftOrganic Traffic
    • 20,053
    • visits · separate log
    • Numbers at different steps come from different records; requests, pages, impressions, citations, and Organic Traffic are each read in their own units.
    • ID
    • EO
    • Microsoft requests
    • Search crawler
    • 12,050,061
    • Builds search index
    • Also serves AI Overviews
    • Same batch of requests
    • Counted once
    • Total 12,050,061
    • From search platform
    • Indexed
    • About 375,000
    • pages
    • Search impressions
    • 910,622
    • times
    • Search clicks
    • 32,052
    • times
    • Click-through rate 3.52%
    • Organic Traffic (separate)
    • Microsoft brings
    • 20,053 visits
    • All sources
    • 309,826 visits
    • Organic Traffic and search clicks
    • each read in its own unit
    • Answers visible; actions and returns still tracked
    • S7 Copilot answer citations
    • 31,711 times
    • S8 Act
    • Tracking
    • S10 Return
    • Tracking
    • Three records, one segment each
    • Website requests
    • Daily crawler request log
    • Search platforms
    • Indexing, impressions, clicks
    • Answer monitoring
    • Citation counts visible
    • Weekly search click-through rate (search clicks ÷ search impressions)
    • Bing search platform · data available 7/21–10/6 · weeks start Monday
    • Higher
    • Lower
    • 7/20
    • 8/3
    • 8/17
    • 8/31
    • 9/14
    • 9/28
    • 10/5
    • Same period
    • 32,052 search clicks
    • 910,622 search impressions
    • Overall click-through rate 3.52%
    • Sources: crawler requests from the approved list; site-wide, indexing, Organic Traffic, and answer citations from approved figures.
    • Search impressions, clicks, and the weekly curve use the daily data available from the search platform, ending 10/6; the answer citation period is 7/22–10/8.
    • Bing indexing is the September snapshot; answer citations and search clicks are counted separately, and platform actions and return visits are still being tracked.

    Related figures:Figure 3-3、Figure 3-4、Figure 3-6

    Figure 3-5Microsoft: 12,050,061 search crawler reads|The platform that currently provides AI answer citation numbers
    How Do You Know AI Cites You? Measuring Both Ends of the Black Box Answers “How do you know AI cites you?” Citation happens inside the AI Black Box

    Answers “How do you know AI cites you?” Citation happens inside the AI Black Box

    On the left are first-party records: AI Real-Time Retrievals of 651,000. On the right are platform data and direct questions. Google's generative AI impression figures for this site are still pending. Copilot answer citations of the IDAEO platform total 31,711. TK Lin's personal IDA appeared in AI search source lists at a rate of 84% (four of the five models used the same search interface; the questions named the author himself; a single case). Below, reads, impressions, and citations form a checkable path. Requests, impressions, citations, and question ratios use different units and cannot be added together. This is a method diagram; cross-verification has not yet been completed.

    • ID
    • EO
    • How do you know AI cites you?
    • Cross-checking content use from both ends of the black box
    • Seeing content use
    • Seeing impressions, citations, answers
    • Site / edge first-party records
    • Platform data / asking AI directly
    • AI Black Box
    • Training · ranking
    • Mention · answer · action
    • S6 Mention
    • S7 Answer
    • 1
    • VPS access logs
    • Site requests · paths
    • 2
    • Cloudflare
    • AI crawler requests
    • AI referrals
    • Matched against VPS
    • Identifies the same read
    • First-party total
    • 651,000
    • AI real-time retrievals
    • 3
    • Google GSC
    • Generative AI impressions
    • and the URLs shown
    • Our site's figures pending
    • 4
    • Bing Webmaster Tools
    • Copilot answer citations
    • 31,711 times
    • 2026/7/22–10/8
    • 5
    • Asking multiple AIs
    • 100 questions · five models
    • 84%
    • IDA used as a source
    • Same URL · same period
    • Links evidence from both ends into one checkable path
    • Crawls
    • Exposure
    • Citation / answer
    • Requests, impressions, citations, question ratios: different units, not additive.
    • Bing cited URLs and tested answers check citation directly; front-end records fill in reads and impressions.
    • Case before vs. after
    • TK Lin's personal IDA, live test
    • 9/20
    • 0
    • 10/3
    • 84%
    • 100 questions, five AI models; 84% of answers used this IDA as a source.
    • IDAEO measures both ends of the black box, then uses platform dataand periodic live tests to measure the results of content use.
    • Original framework © 2026

    Related figures:Figure 3-2、Figure 3-5

    Figure 3-6How Do You Know AI Cites You? Measuring Both Ends of the Black Box
    OpenAI: 10,602,782 reads for training purposes|Nearly nine in ten requests are for training purposes; also the platform with the most real-time retrievals OpenAI crawls content for training and also retrieves it in real time to answer live questions

    OpenAI crawls content for training and also retrieves it in real time to answer live questions

    Compare with Figure 3-4 (Google): look first at retrievals and customer arrivals, then at the scope of ongoing tracking in the middle.

    • OpenAI: Of the three crawler types, the one for training purposes recorded the most reads: 10,602,782
    • Finding: Nearly nine in ten reads are for training purposes. It is also the platform with the most real-time retrievals.
    • The OpenAI path: crawlers come in, black box inside the platform, customers visit
    • 2026/3/3–10/8 · three crawlers, 11,998,898 requests total; OpenAI Organic Traffic breakdown still being tracked
    • Requests from three identified crawlers
    • Green band widths are allocated by 11,998,898 requests; each purpose is counted once.
    • S3 Train
    • 10,602,782 requests
    • S4 Index
    • 760,806 requests
    • S5 Ask
    • 635,310 requests
    • Black box inside the platform
    • AI mention, answer, and action flow
    • OpenAI-specific requests: Tracking in Progress
    • S1 Prepare
    • Our website
    • S2 Crawl
    • OpenAI's three crawlers
    • S3–S5 Entering the site
    • Site request log
    • S6–S8 Inside the platform
    • Black Box
    • S9 Visit
    • Organic Traffic
    • Whole site
    • 196,702,526
    • Requests · 2/12–10/8
    • OpenAI
    • 11,998,898
    • Requests
    • S3 Train
    • Training crawler
    • 10,602,782
    • Requests
    • Takes content back for model training
    • S4 Index
    • Search crawler
    • 760,806
    • S5 Ask
    • Real-time retrieval crawler
    • 635,310
    • Training requests visible
    • In AI Platforms: live tests
    • Indexing requests visible
    • In AI Platforms: live tests
    • Real-time retrievals visible
    • In AI Platforms: live tests
    • After training
    • In AI Platforms: live tests
    • S6 Mention
    • In AI Platforms: live tests
    • S7 Answer
    • In AI Platforms: live tests
    • S9 Visit
    • Organic Traffic
    • Tracking
    • Site-wide total
    • 309,826 visits
    • S8 Act
    • Tracking in Progress
    • S10 Return
    • Tracking in Progress
    • On this path, what we can count directly is crawler requests arriving at the site.
    • The training, indexing, and question request branches do not overlap; they sum to 11,998,898.
    • The platform's mentions, answers, and actions are each read in their own units.
    • The 309,826 in S9 is Organic Traffic from all sources; the OpenAI breakdown is still being tracked.
    • Sources: approved site-wide and Organic Traffic figures; the three crawlers' requests are summed from the 2026/3/3–10/8 approved list.
    • Green band widths are allocated by the request counts of the three crawlers; the dashed box marks the inside of the OpenAI platform, observed by live tests.
    • ID
    • EO

    Related figures:Figure 3-3、Figure 3-4、Figure 3-8

    Figure 3-7OpenAI: 10,602,782 reads for training purposes|Nearly nine in ten requests are for training purposes; also the platform with the most real-time retrievals
    Anthropic: 24,479,305 requests for training purposes|Highest number of requests for training purposes of any platform Most of Anthropic's crawls are for training, showing the scale of this type of crawling

    Most of Anthropic's crawls are for training, showing the scale of this type of crawling

    Compare with Figure 3-7 (OpenAI); read the requests arriving at the site and the platform's internal live-test topics separately.

    • Anthropic: 24,479,305 requests for training purposes
    • Finding: Almost all reads are for training purposes. It has the highest number of requests for training purposes of any platform.
    • The Anthropic (Claude) path: from crawlers to platform to customers
    • 2026/3/3–10/8 · five crawlers, 24,492,552 requests total
    • S1
    • Prepare
    • S2
    • Crawl
    • S3
    • Train
    • S4
    • Index
    • S5
    • Ask AI
    • S6
    • AI Mention
    • S7
    • AI Answer
    • S8
    • Act
    • S9
    • Visit
    • S10
    • Return
    • Site-arrival requests by four purposes
    • Training, indexing, and real-time retrieval, plus 48 requests with purpose still being tracked; each item is counted once.
    • S3 Train
    • 24,479,305 requests
    • S4 Index
    • 10,705 requests
    • S5 Ask
    • 2,494 requests
    • Black Box: inside AI Platforms
    • S6–S8 Mentions, answers, and actions
    • Tracking in Progress
    • S1 Prepare
    • Our website
    • S2 Crawl
    • Anthropic's five crawlers
    • S3–S5 Site-arrival purposes
    • Site request log
    • S6–S8 Inside the platform
    • Black Box
    • S9 Visit
    • Organic Traffic
    • Whole site
    • 196,702,526
    • Requests · 2/12–10/8
    • Anthropic
    • 24,492,552
    • Requests
    • S3 Train
    • Training crawler
    • 24,479,305
    • Requests
    • Takes content back for model training
    • S4 Index
    • Search crawler
    • 10,705
    • S5 Ask
    • Real-time retrieval crawler
    • 2,494
    • Site-arrival requests visible
    • In AI Platforms: live tests
    • Indexing requests visible
    • In AI Platforms: live tests
    • Real-time retrievals visible
    • In AI Platforms: live tests
    • After training
    • In AI Platforms: live tests
    • S6 Mention
    • In AI Platforms: live tests
    • S7 Answer
    • In AI Platforms: live tests
    • S9 Visit
    • Organic Traffic (own)
    • Tracking in Progress
    • Site-wide total
    • 309,826 visits
    • S8 Act
    • Tracking in Progress
    • S10 Return
    • Tracking in Progress
    • On this path, what can be counted directly is crawler requests arriving at the site.
    • S3 24,479,305 + S4 10,705 + S5 2,494 + purpose being tracked 48 = 24,492,552.
    • Crawler requests and the platform's mentions, answers, and actions are each read in their own units.
    • In-platform processing in S6–S8 and the S9 Organic Traffic breakdown are still being tracked.
    • Sources: site-wide and Organic Traffic from approved figures; each platform's crawler requests from the 2026/3/3–10/8 approved list.
    • Green bands show the purposes of site-arrival requests; dashed boxes mark in-platform or platform-specific numbers still being tracked.
    • ID
    • EO

    Related figures:Figure 3-3、Figure 3-7

    Figure 3-8Anthropic: 24,479,305 requests for training purposes|Highest number of requests for training purposes of any platform
    Apple: 24,615,429 indexing requests|Highest indexing volume of any platform Apple's crawling is concentrated on retrieving content for indexing

    Apple's crawling is concentrated on retrieving content for indexing

    Look at crawl volume first, then follow the journey to see the tracking scope of later use.

    • Apple: indexing requests reach 24,615,429
    • Finding: all reads go to building the search index (Siri, Spotlight, and other search features); the highest indexing volume of any platform.
    • The Apple path: from crawlers to platform to customers
    • 2026/3/3–10/8 · one crawler, 24,615,429 requests total
    • S1
    • Prepare
    • S2
    • Crawl
    • S3
    • Train
    • S4
    • Index
    • S5
    • Ask AI
    • S6
    • AI Mention
    • S7
    • AI Answer
    • S8
    • Act
    • S9
    • Visit
    • S10
    • Return
    • Site-arrival requests for indexing
    • All requests with an assigned purpose are in S4 Index; this batch is counted once.
    • S3 Train
    • Tracking in Progress
    • S4 Index
    • 24,615,429 requests
    • S5 Ask
    • Tracking in Progress
    • Black Box: inside AI Platforms
    • S6–S8 Mentions, answers, and actions
    • Tracking in Progress
    • S1 Prepare
    • Our website
    • S2 Crawl
    • Apple's single crawler
    • S3–S5 Site-arrival purposes
    • Site request log
    • S6–S8 Inside the platform
    • Black Box
    • S9 Visit
    • Organic Traffic
    • Whole site
    • 196,702,526
    • Requests · 2/12–10/8
    • Apple
    • 24,615,429
    • Requests
    • S3 Train
    • Platform-specific requests
    • Tracking in Progress
    • Takes content back for model training
    • S4 Index
    • Search crawler
    • 24,615,429
    • S5 Ask
    • Platform-specific requests
    • Tracking in Progress
    • Tracking in Progress
    • In AI Platforms: live tests
    • Indexing requests visible
    • In AI Platforms: live tests
    • Tracking in Progress
    • In AI Platforms: live tests
    • After training
    • In AI Platforms: live tests
    • S6 Mention
    • In AI Platforms: live tests
    • S7 Answer
    • In AI Platforms: live tests
    • S9 Visit
    • Organic Traffic (own)
    • Tracking in Progress
    • Site-wide total
    • 309,826 visits
    • S8 Act
    • Tracking in Progress
    • S10 Return
    • Tracking in Progress
    • On this path, what can be counted directly is crawler requests arriving at the site.
    • The 24,615,429 requests in S4 equal the Apple crawler total.
    • Crawler requests and the platform's mentions, answers, and actions are each read in their own units.
    • Apple's platform-specific numbers for S3 and S5–S10 are still being tracked.
    • Sources: site-wide and Organic Traffic from approved figures; each platform's crawler requests from the 2026/3/3–10/8 approved list.
    • Green bands show the purposes of site-arrival requests; dashed boxes mark in-platform or platform-specific numbers still being tracked.
    • ID
    • EO

    Related figures:Figure 3-3

    Figure 3-9Apple: 24,615,429 indexing requests|Highest indexing volume of any platform
    Meta: 11,583,411 requests for training purposes|All reads are for training purposes Meta's crawl records correspond to training use, while customer arrivals are read as organic traffic

    Meta's crawl records correspond to training use, while customer arrivals are read as organic traffic

    Look at AI crawls and customer arrivals separately, reading each result in its own unit.

    • Meta: 11,583,411 requests for training purposes
    • Finding: All reads are for training purposes. Separately, Organic Traffic totaled 9,388 visits over the same period.
    • Meta's path: from crawler to platform, then to customers
    • 2026/3/3–10/8 · one crawler, 11,583,411 requests in total
    • S1
    • Prepare
    • S2
    • Crawl
    • S3
    • Train
    • S4
    • Index
    • S5
    • Ask AI
    • S6
    • AI Mention
    • S7
    • AI Answer
    • S8
    • Act
    • S9
    • Visit
    • S10
    • Return
    • Site requests for training use
    • All requests with an assigned purpose fall under S3 Train; this batch is counted only once.
    • S3 Train
    • 11,583,411 requests
    • S4 Index
    • Tracking in Progress
    • S5 Ask
    • Tracking in Progress
    • Black Box: inside AI Platforms
    • S6–S8 Mentions, answers, and actions
    • Tracking in Progress
    • S1 Prepare
    • Our website
    • S2 Crawl
    • One Meta crawler
    • S3–S5 Site-arrival purposes
    • Site request log
    • S6–S8 Inside the platform
    • Black Box
    • S9 Visit
    • Organic Traffic
    • Whole site
    • 196,702,526
    • Requests · 2/12–10/8
    • Meta
    • 11,583,411
    • Requests
    • S3 Train
    • Training crawler
    • 11,583,411
    • Requests
    • Takes content back for model training
    • S4 Index
    • Platform-specific requests
    • Tracking in Progress
    • S5 Ask
    • Platform-specific requests
    • Tracking in Progress
    • Site-arrival requests visible
    • In AI Platforms: live tests
    • Tracking in Progress
    • In AI Platforms: live tests
    • Tracking in Progress
    • In AI Platforms: live tests
    • After training
    • In AI Platforms: live tests
    • S6 Mention
    • In AI Platforms: live tests
    • S7 Answer
    • In AI Platforms: live tests
    • S9 Visit
    • Organic Traffic
    • 9,388 visits
    • Site-wide total
    • 309,826 visits
    • S8 Act
    • Tracking in Progress
    • S10 Return
    • Tracking in Progress
    • On this path, what can be counted directly is crawler requests arriving at the site.
    • The 11,583,411 requests at S3 equal the Meta crawler total.
    • Crawler requests and the platform's mentions, answers, and actions are each read in their own units.
    • S9 Organic Traffic is a separate 9,388 visits; read requests and visits by humans each in their own unit.
    • Sources: site-wide and Organic Traffic from approved figures; each platform's crawler requests from the 2026/3/3–10/8 approved list.
    • Green bands show the purposes of site-arrival requests; dashed boxes mark in-platform or platform-specific numbers still being tracked.
    • ID
    • EO

    Related figures:Figure 3-3

    Figure 3-10Meta: 11,583,411 requests for training purposes|All reads are for training purposes

    IDAEO measurements

    Our Own Site and Early Field-Test Merchants

    3
    IDAEO Growth Milestones: From Zero to One Hundred Million Requests Eight milestones and the cumulative curve show the site’s track record from zero to one hundred million requests

    Eight milestones and the cumulative curve show the site’s track record from zero to one hundred million requests

    Read the title, approach, and reads over the same period for each milestone in order from 1–8, then compare against the cumulative curve. May 20–Aug 23 is the stage in which IDAEO methodology validation took shape. From Aug 24 on, counting uses platform-verified AI identities, which identifies them more precisely. Figures before Aug 24 may include duplicate requests. The corresponding theory is noted under each card.

    • IDAEO Growth Milestones: From Zero to One Hundred Million Requests
    • 2026/3/3–10/8 · Eight milestones: what was done, how reads grew
    • ①
    • 3/3
    • Measurement officially launched
    • Action: began measuring AI visits,
    • set a baseline.
    • Result: 53 requests on day one;
    • 635,000 requests in March.
    • Theory:
    • Law of Full-Journey Outcomes
    • Daily records
    • ②
    • 3/9–3/17
    • Search impressions begin
    • Action: company page began getting
    • search impressions.
    • Result: 1.59 million reads in April.
    • Theory:
    • Law of Audience Adaptation
    • Daily records
    • ③
    • 4/15
    • First visit from an AI answer
    • Action: began tracking AI answers
    • that bring visitors to the site.
    • Result: first verifiable
    • visit record.
    • Theory:
    • Journey Design · S9 Visit
    • Visit records
    • ④
    • 5/20–5/23
    • Brand info fully upgraded
    • Action: upgraded brand info,
    • strengthening AI understanding.
    • Result: 3.11 million reads in May.
    • Theory:
    • Identity Continuity (S1 Readiness)
    • Daily records
    • ⑤
    • 6/1–6/12
    • Evidence-driven optimization
    • Action: compiled relevant
    • papers online, optimized using
    • methods proven effective in tests.
    • Result: 16.07 million reads in June.
    • Theory:
    • Basis: 17 existing theories
    • Daily records
    • ⑥
    • 6/25–7/4
    • New IDAEO site built
    • Action: built the site directly
    • with the full IDAEO methodology.
    • Result: 25.97 million reads in July.
    • Theory:
    • Five Dimensions & Nine Elements
    • Daily records
    • ⑦
    • 7/17–8/22
    • Reads hit a new peak
    • Action: deepened optimization,
    • raising AI Content Use
    • efficiency and stability.
    • Result: 35.99 million in August.
    • Theory:
    • AI Impressions (S2–S4)
    • Daily records
    • ⑧
    • September to 10/8
    • Hundred-million-request mark
    • Action: kept tracking AI and
    • search engine cumulative reads.
    • Result: 15.79 million in September.
    • October to 10/8: 6.34 million reads.
    • Cumulative: 105.5 million.
    • Theory:
    • Compounding Lead & Living Theory
    • Daily records
    • April
    • May
    • June
    • July
    • August
    • Sep
    • 3/3
    • 10/8
    • ①
    • ②
    • ③
    • ④
    • ⑤
    • ⑥
    • ⑦
    • ⑧
    • Cumulative crawl requests (daily running total)
    • Unit: requests · y-axis 0–110 million, linear
    • 5/20–8/23: IDAEO methodology validation takes shape
    • From 8/24: platform-verified AI IDs, more precise →
    • 25M
    • 50M
    • 75M
    • 100M
    • ①
    • ②
    • ③
    • ④
    • ⑤
    • ⑥
    • ⑦
    • ⑧
    • 10/8 cumulative 105.5 million
    • AI Agents automated browsing 17.95 million (8/26–10/8) listed separately
    • 3/3
    • April
    • May
    • June
    • July
    • August
    • Sep
    • 10/8
    • Cumulative (month-end)
    • 635,000
    • 2.22 million
    • 5.33 million
    • 21.4 million
    • 47.37 million
    • 83.36 million
    • 99.15 million
    • 105.5 million
    • Basis: cumulative total includes AI tools 7.079 million; AI Agents automated browsing 17.95 million (8/26–10/8) listed separately.
    • Monthly volumes in the figure are compiled from daily records; from 8/24 on, counting uses platform-verified AI identities.
    • S1 Prepare → S2 Crawl; subsequent answers, actions, and return visits are each shown on their own basis.
    • ID
    • EO

    Related figures:Figure 7-2、Figure 6-6、Figure 0-2、Figure 7-3

    IDAEO Growth Milestones: From Zero to One Hundred Million Requests
    ItemCumulative (month-end)
    3/3635,000
    April2.22 million
    May5.33 million
    June21.4 million
    July47.37 million
    August83.36 million
    Sep99.15 million
    10/8105.5 million
    CSV
    Figure 7-1IDAEO Growth Milestones: From Zero to One Hundred Million Requests
    Monthly Ranking Shifts of AI Platforms Monthly ranking changes in crawl volume by platform

    Monthly ranking changes in crawl volume by platform

    Each row is one rank; follow the same-colored line to see each platform’s monthly rank, then read it together with the crawl volume for the same period.

    • Monthly ranking changes by platform
    • 2026/3/3–10/8 · Top ten by monthly crawl requests (first place at top) · October through 10/8
    • Colors:
    • Apple
    • Anthropic
    • OpenAI
    • Microsoft
    • Meta
    • Amazon
    • Google
    • Our AI Search
    • Perplexity
    • DuckDuckGo
    • Neutral (names at band ends):
    • Yandex
    • ByteDance
    • Sogou
    • Huawei
    • Parallel
    • TollBit
    • Common Crawl
    • March
    • April
    • May
    • June
    • July
    • August
    • Sep
    • October (through 10/8)
    • Below top ten
    • Below top ten
    • 1
    • 237,000
    • 2
    • 141,000
    • 3
    • 102,000
    • 4
    • 5
    • 6
    • 7
    • 8
    • 9
    • 10
    • 1
    • 444,000
    • 2
    • 363,000
    • 3
    • 349,000
    • 4
    • 5
    • 6
    • 7
    • 8
    • 9
    • 10
    • 1
    • 1.65 million
    • 2
    • 766,000
    • 3
    • 302,000
    • 4
    • 5
    • 6
    • 7
    • 8
    • 9
    • 10
    • 1
    • 5.73 million
    • 2
    • 3.94 million
    • 3
    • 2.45 million
    • 4
    • 5
    • 6
    • 7
    • 8
    • 9
    • 10
    • 1
    • 10.71 million
    • 2
    • 4.36 million
    • 3
    • 3.83 million
    • 4
    • 5
    • 6
    • 7
    • 8
    • 9
    • 10
    • 1
    • 12.66 million
    • 2
    • 10.22 million
    • 3
    • 6.01 million
    • 4
    • 5
    • 6
    • 7
    • 8
    • 9
    • 10
    • 1
    • 2.69 million
    • 2
    • 1.78 million
    • 3
    • 1.68 million
    • 4
    • 5
    • 6
    • 7
    • 8
    • 9
    • 10
    • 1
    • 1.63 million
    • 2
    • 803,000
    • 3
    • 326,000
    • 4
    • 5
    • 6
    • 7
    • 8
    • 9
    • 10
    • OpenAI
    • Yandex
    • Amazon
    • Google
    • Microsoft
    • ByteDance
    • Perplexity
    • Apple
    • Anthropic
    • DuckDuckGo
    • Meta
    • Microsoft
    • Anthropic
    • Amazon
    • OpenAI
    • Apple
    • Google
    • Perplexity
    • Yandex
    • Sogou
    • Source: IDAEO first-party measurement records; each month, AI Platforms are ranked by request volume, and only the top ten are drawn.
    • October through 10/8; AI Platforms are ranked by counting each source separately; AI Agents automated browsing, AI tools, and Tracking in Progress are listed separately.
    • Band width scales with the square root of monthly requests; when one request serves two purposes, it is counted only once for the same platform in the AI Platforms ranking.
    • ID
    • EO

    Related figures:Figure 7-1、Figure 7-3

    Monthly Ranking Shifts of AI Platforms
    ItemMarchValueOctober (through 10/8)Value
    1OpenAI237,000Meta1.63 million
    2Yandex141,000Microsoft803,000
    3Amazon102,000Anthropic326,000
    CSV
    Figure 7-2Monthly Ranking Shifts of AI Platforms
    Early Field-Test Merchant Results: Changes During the Field-Test Period Early field-test merchants verify it too

    Early field-test merchants verify it too

    Read from top to bottom. First, look at Google search clicks for IDAEO platform merchant pages, then the cumulative number of times AI brought customers into merchant pages, to see changes during the field-test period. Next, look at changes in the first batch of merchant websites after joining the IDAEO field test. Then look at search clicks, AI crawls, and bookings brought by AI for our own Washinmura website (hotel and tourism industry). Finally, look at AI impressions, the platforms that came to read, and their purposes for the IDA pages of the second batch of field-test industries. Read each figure according to the labeled subject, period, and purpose. The figures for the first batch of merchant websites are site-wide opens. There is no control group yet; these results do not establish causation.

    • Early Field-Test Merchant Results: Changes During the Field-Test Period
    • 2026/3–10 · See each panel for its period · IDAEO first-party measurement records
    • A | Google search clicks on merchant pages (monthly)
    • Merchant pages on the IDAEO platform
    • March
    • 297
    • April
    • 2,810
    • May
    • 8,127
    • June
    • 9,673
    • July
    • 10,734
    • August
    • 12,119
    • Sep
    • 15,128
    • Up seven months in a row; September is 5.4 times April
    • B | AI brings customers to merchant pages (cumulative)
    • Visits brought by AI answers · cumulative from 4/15
    • March
    • April
    • 3
    • May
    • 53
    • June
    • 336
    • July
    • 524
    • August
    • 651
    • Sep
    • 760
    • 774 cumulative through 10/8
    • about 50.67 million
    • AI Impressions of merchant pages (read by AI, 5/19–10/9)
    • AI Impressions come first; the rest of the journey follows
    • C | Websites of the first batch of field-test merchants
    • Changes during participation in the IDAEO field test (no control group yet; this does not establish causation)
    • Official Website
    • Participating in the Field Test
    • First batch of field-test merchants
    • 373,254
    • website opens
    • cumulative from 4/11
    • 341
    • times
    • Visits brought by AI
    • Industry
    • May → September
    • Visits brought by AI
    • Parenting content site
    • 52,817
    • 55,286
    • 294 visits
    • ChatGPT 236, Gemini 35,
    • Perplexity 15, Claude 6, Copilot 2
    • Food equipment maker
    • 842
    • 1,275
    • ChatGPT 15 visits
    • Event staging design
    • 442
    • 1,741
    • —
    • Leather goods brand
    • 555
    • 908
    • ChatGPT 2 visits
    • Hair salon
    • 74
    • 128
    • —
    • Studio
    • 3
    • 329
    • —
    • Among official websites with complete records for both May and September, most grew; some did not
    • D | Our own site: the Washinmura website (hotel and tourism industry)
    • www.washinmura.jp · The first field-test site of the IDAEO methodology
    • 1 in every 8 reads is someone asking AI right now
    • AI real-time retrievals: 11,333, or 11.9% of the 95,333 reads by AI and search engines
    • S2–S4 AI Information Acquisition
    • 95,333 reads
    • Reads by AI and search engines
    • 8/20–10/8
    • S5 Ask
    • 11,333 reads
    • AI real-time retrievals
    • ChatGPT 7,720, Claude 1,983,
    • Perplexity 1,630
    • S9 Visit
    • AI-referred bookings
    • Booking data to be published later
    • Google search clicks 109,140; search impressions 1,344,589
    • 3/3–10/8
    • E | Second batch of field-test industries: joined July–August
    • 373,776 AI impressions
    • IDA pages of the second batch of field-test industries · times read by AI, 7/18–10/8
    • Who reads
    • What they do
    • Meta
    • 170,137
    • OpenAI
    • 60,869
    • Anthropic
    • 59,178
    • Amazon
    • 37,218
    • Apple
    • 36,744
    • Microsoft
    • 9,407
    • Common Crawl
    • 107
    • Google
    • 102
    • Perplexity
    • 11
    • ByteDance
    • 3
    • Copies back for training
    • 327,365 reads
    • Building AI and search indexes
    • 46,399 reads
    • Real-Time Retrieval
    • 12 reads
    • Real-time retrieval: AI reads these pages as someone asks.
    • Search clicks and customer visits for IDA pages: Tracking in Progress, to be published later.
    • Industry websites (April–September total)
    • Copilot citations
    • 37,793 citations
    • Bing search clicks
    • 10,177 clicks
    • AI citations, compared with search clicks:
    • 3.7 times
    • IDAEO is field-tested at Washinmura, the first merchants, and a second wave of industries; wider public testing is next.
    • ID
    • EO
    • Merchant website figures are site-wide opens.

    Related figures:Figure 7-2、Figure 7-1、Figure 1-1

    Figure 7-3Early Field-Test Merchant Results: Changes During the Field-Test Period

    Cite this book

    IDAEO: Marketing in the Age of AI · 林毅祥(TK Lin) · 1st edition, 8th revision · · https://km.idaeo.ai/idaeo/atlas?lang=en · CC BY 4.0