IDAEOKnowledge Basekm.idaeo.ai

IDAEO: Marketing in the Age of AI

IDAEO: Marketing in the Age of AI

📖 Start reading
⬇ Download PDF✉ Email me new editions✓ Test your site free

IDAEO: Marketing in the Age of AI

ID → IDA → AEO|One question per chapter, every figure gets finer from top to bottom, every claim comes with its reason|2026-10-11

Author: TK Lin | Publisher: 株式会社和心 (Washin Co., Ltd. / IDAEO) | Data as of Oct 8, 2026 | Last updated Oct 20, 2026 | Updated monthly with new data | License CC BY 4.0

Author IDA: TK Lin

IDAEO: Marketing in the Age of AI

After completing this course, you can assess a merchant's progress across S1–S10, its Marketing Audiences and Optimization Domains, and verify results with Performance Metrics.

First master the Seven Laws of IDAEO, the Five Dimensions of IDAEO Marketing, and the Nine Elements of the IDAEO Framework; then learn audiences, journey, measurement, verification, Service Tiers, and results; finally, look at the results and theoretical basis from IDAEO's own website and early real-world test merchants.

  1. Chapter 0 IDAEO: AI-Era MarketingHow should merchants approach marketing when customers start asking AI?
  2. Chapter 1 Audience Strategy (Who to Target): Five Marketing Audiences and Six Optimization DomainsWhat do the different Marketing Audiences come to do, and which Optimization Domains do they map to?
  3. Chapter 2 Journey Design (Which Steps to Take): AI Customer Journey: Four Phases, Ten StepsWhen customers find a merchant through AI, how do the four phases and ten steps connect?
  4. Chapter 3 Measurement Sources and the AI Black Box: The Data Foundation of Performance MeasurementWho provides the numbers for each step, and how is the AI black box measured?
  5. Chapter 4 Trust and Verification (Why Believe It): Credible Facts and External CorroborationHow does a merchant's claim become a credible fact that AI can cite?
  6. Chapter 5 Service Tiers (How Far to Go): AEO Exposure — Get Read First; AEO+ Word of Mouth — Get Mentioned; IDA Brand PR — Accurate Answers, Visits, and ReturnsWhich journey steps does each service tier cover, and how do you choose Performance Metrics?
  7. Chapter 6 Performance Measurement (How to Count Results): AI Impressions and Full-Journey ValueWhat results do AI impressions, AI Content Use, and site visits each represent?
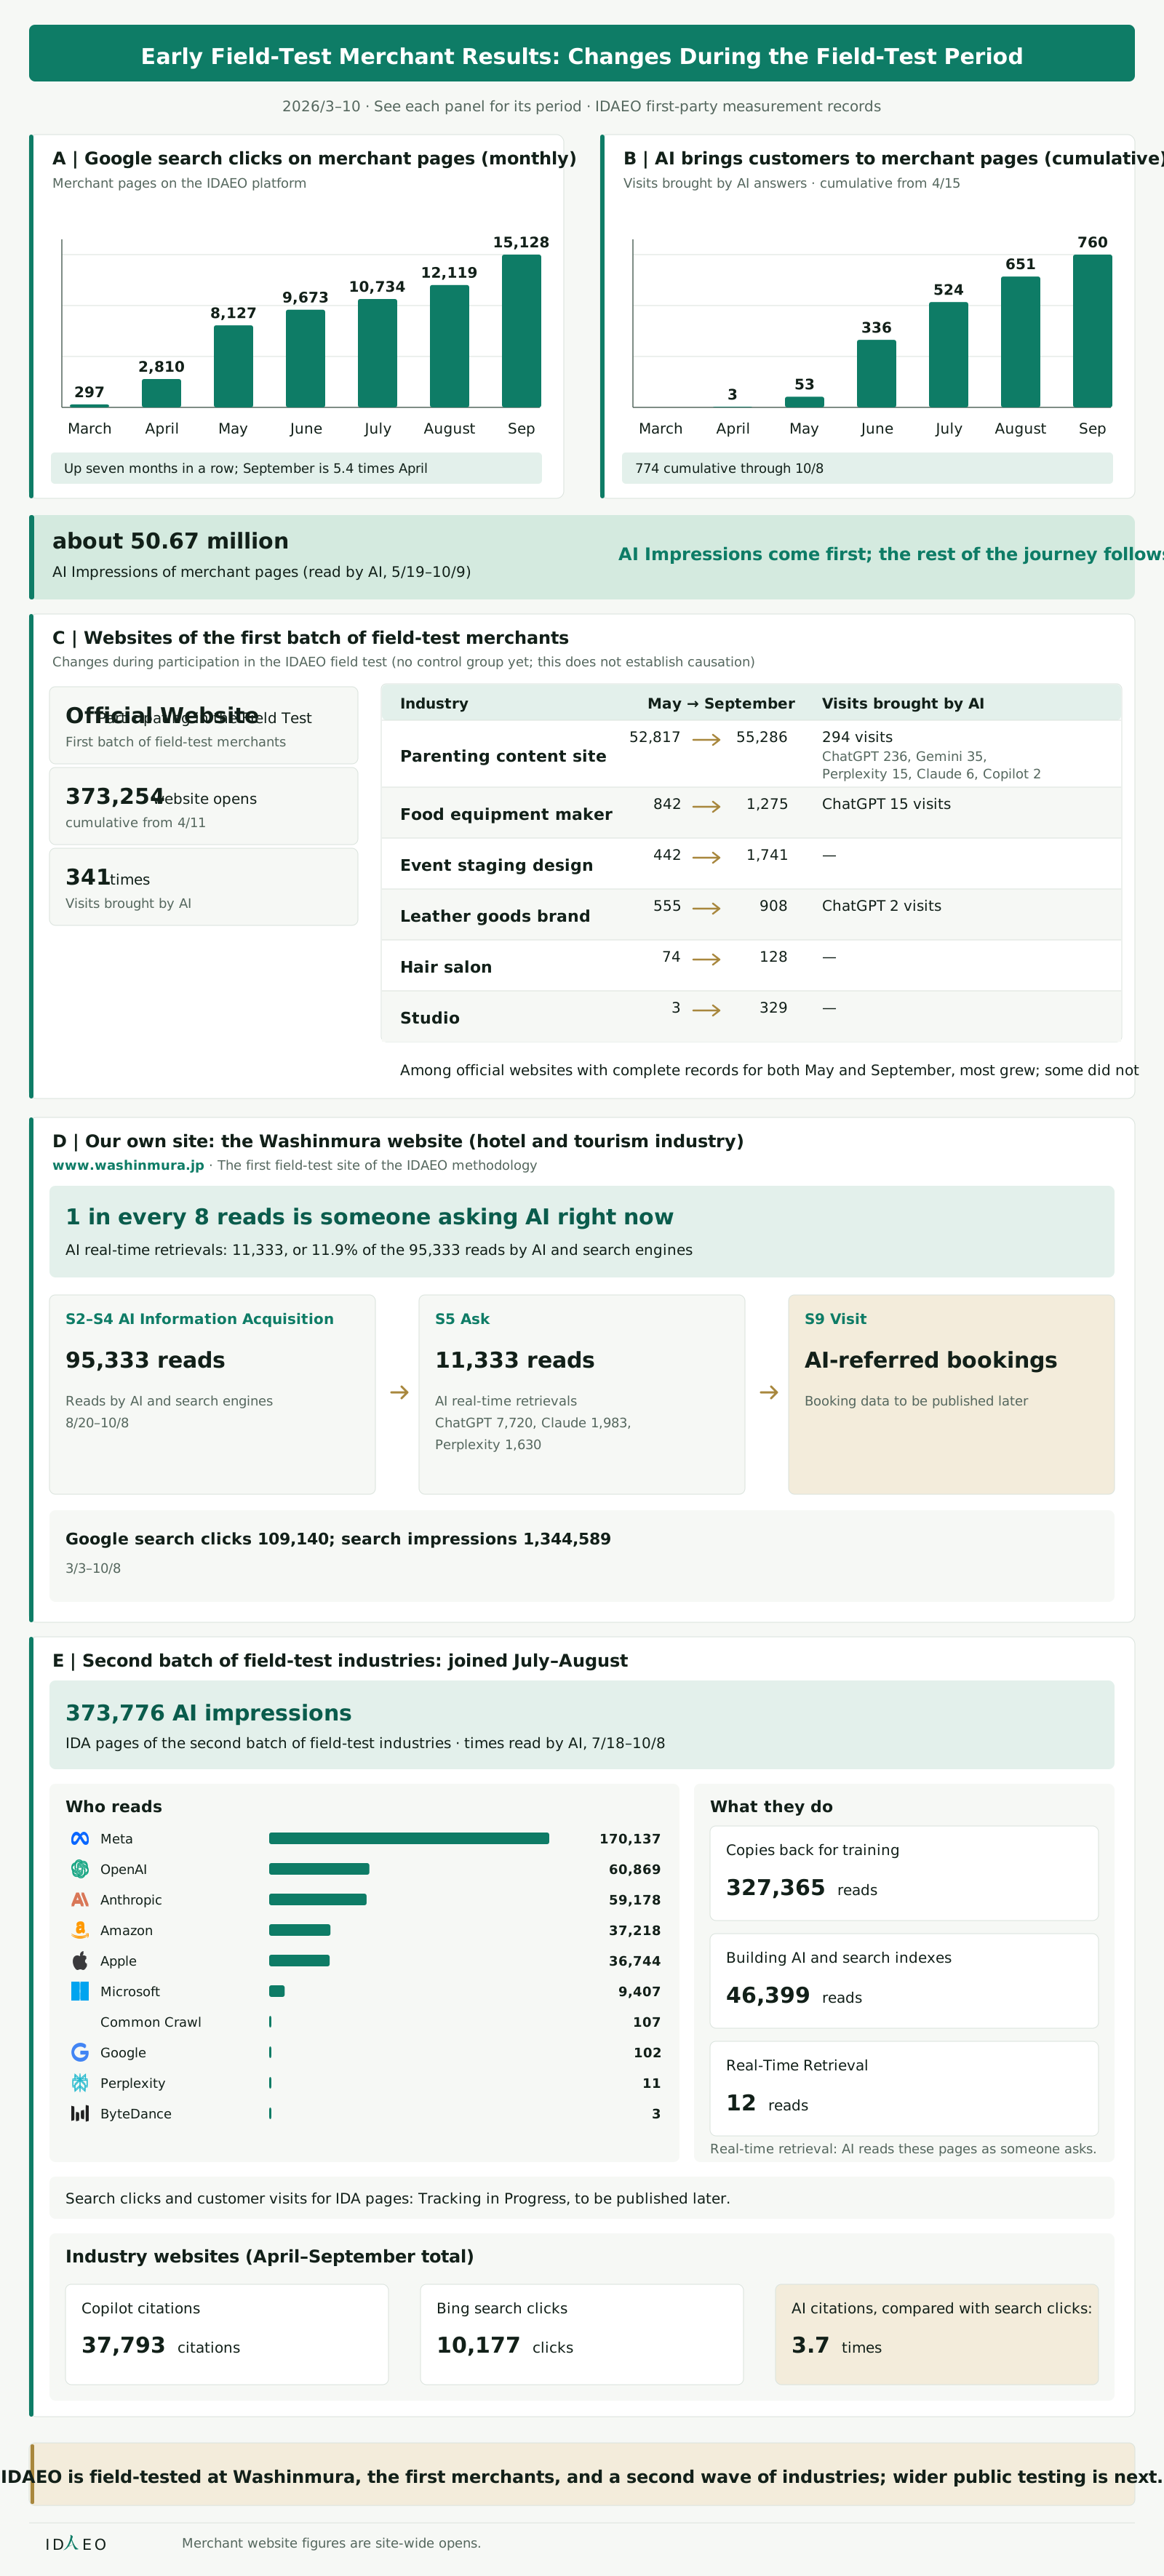
  8. Chapter 7 IDAEO Field Results: Our Own Site and Early Field-Test MerchantsHow did IDAEO’s own site go from zero to one hundred million requests? What changed for the first batch of joint field-test merchants during the field-test period?
  9. Chapter 8 AI Visibility and Theoretical FoundationsWhere in the journey does AI Visibility sit, and what is the theoretical basis of IDAEO?

Reading Guide: How to Read This Book

This book is for anyone who wants AI to understand, mention, and accurately describe their business. Business owners can go straight to what they need to do. Marketing professionals can read the full method; researchers can examine the data and theoretical basis. As customers start by asking AI, Marketing also needs to connect with AI. This book helps you identify where your business stands in the journey.

ReaderRead FirstWhy
Business OwnersChapters 0, 2, 4, 5, and 6, and the practical chapter at the end of the bookFirst, understand how customers are shifting to asking AI. Then explore the ten diagnostic checkpoints, fact verification, IDAEO Service Tiers, and how to assess results. Chapter 3 focuses on data; you can skip it for now.
MarketersRead the whole book in orderRead the full approach, from audiences and the journey to measurement, verification, and results. This will help you apply the method to your own work.
ResearchersThe whole book, with a focus on Chapters 3 and 8Chapter 3 explains the data sources, scope, and units. Chapter 8 provides the theoretical basis and further reading.

Ten-Minute Version

  1. Customers are starting to ask AI first. Marketing needs to connect with AI too.
  2. IDAEO uses ten diagnostic checkpoints, S1–S10, to see how far a business has progressed. They are not a sequence every customer must follow.
  3. Outside AI Platforms, crawls and site visits can be measured directly. Mentions and answers inside the platforms are a Black Box.
  4. So measure both ends: crawl volume and site visits. Also ask AI directly at regular intervals.
  5. Label every figure with its source and time period. Do not add figures that use different measurement rules.
  6. This is a living book: new data is published first at km.idaeo.ai/idaeo, and a new edition comes out each month.
Chapter 0

IDAEO: AI-Era Marketing

This chapter answersHow should merchants approach marketing when customers start asking AI?

Why it comes hereRead the origin, the real-world measurement foundation, and the overview of the book first to understand how AI exposure connects to the results that follow. See Chapter 8 for a detailed explanation of the theory and claims still to be tested.

Customers are starting to ask AI first and get one answer. How should merchants adapt their marketing? This book uses Journey Diagnostics to help you assess progress from preparing information to bringing customers back.

The Origin of IDAEO: How TK Lin Turned Real-World Measurement into a Marketing Discipline

From 53 on the First Day to 105.5 Million Cumulative Requests from AI, Search Engines, and Automated Bots

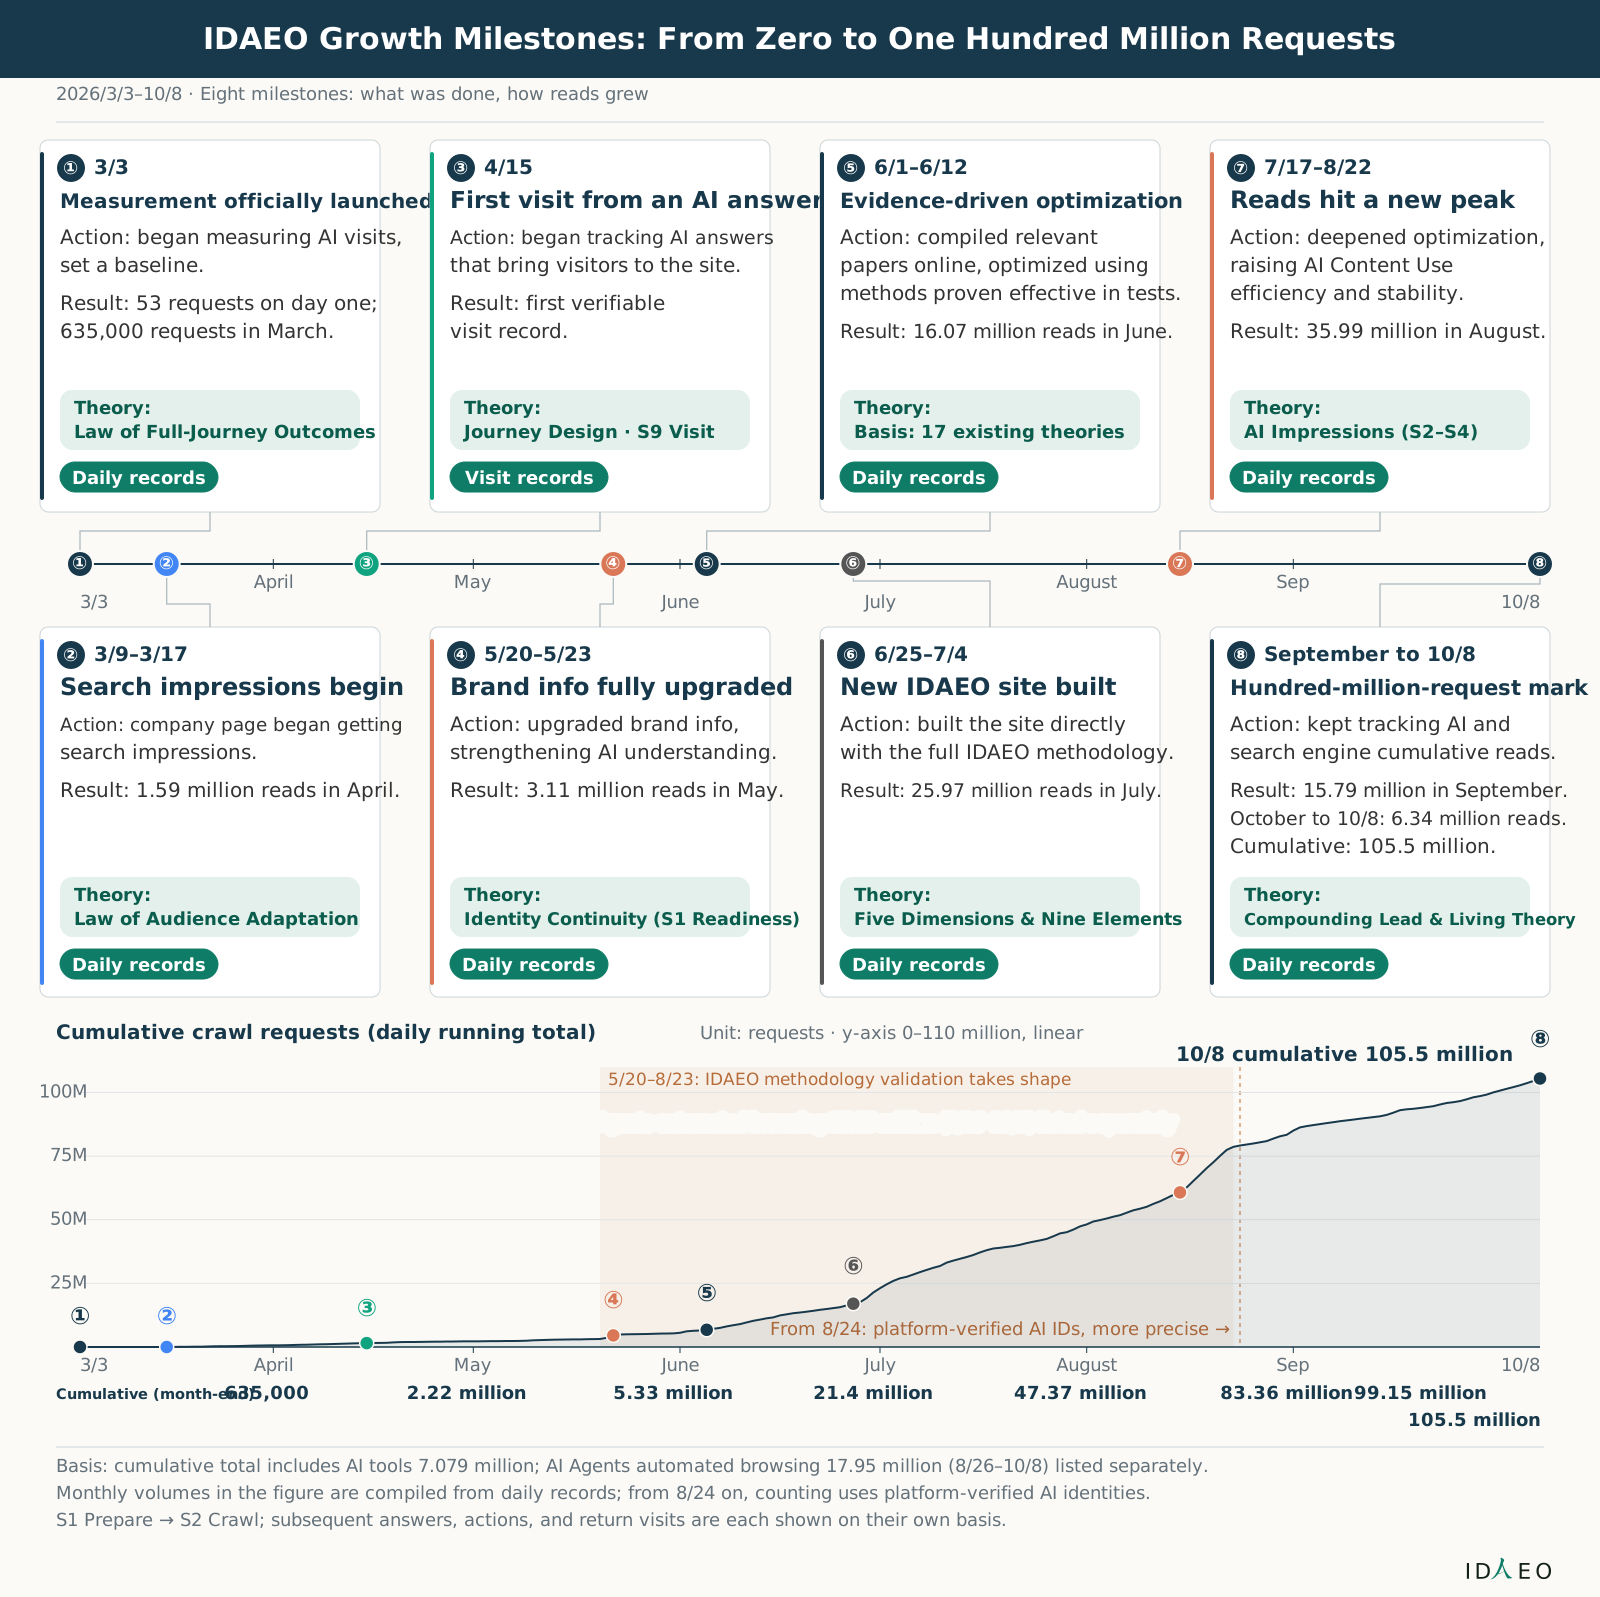
On Mar 3, 2026, TK Lin began measuring AI visits to his own website: 53 on the first day. Cumulative requests reached 635,000 in March. By Oct 8, AI visit measurement had been running for 220 days. From Mar 3 to Oct 8, cumulative requests reached 105.5 million (including AI, search engines, and Automated Bots; these are platform-scale figures and cannot be compared directly with a single merchant's website). Requests before Aug 24 may include duplicates. Marketing must make getting AI to understand and trust the content a foundational task. He turned these real-world measurements into the foundation of a marketing discipline.

Marketing First Makes AI Understand and Trust, Then Lets AI Speak for You

Customers have shifted from searching and comparing ten links themselves to asking AI and getting one answer. TK Lin therefore extended Marketing Audiences to AI. First make AI understand and trust, then let AI speak for the brand. Visits by AI Agents have been observed, and their scale is still being tracked. Site visitors are also extending from crawlers that read content to AI Agents that carry out tasks. Changes in search clicks and AI Content Use were observed over the same period. The Google Search click analysis includes only data with year-earlier records. From June to September 2026, monthly clicks were about half of the same month last year. September totals: 52,926 last year and 25,928 this year. These are observations over the same period; they do not establish that customers switching to AI caused the decline in clicks. Customers find answers through AI, so marketing must connect to this touchpoint too. The industry websites measured received a combined 37,793 Copilot citations from April to September. Bing Search clicks totaled 10,177. Both belong to Microsoft, but citations and clicks are different units. The reporting periods also differ, so a ratio cannot be calculated. Citations make content the basis of AI answers, and they are also a marketing result.

What Does ID → IDA → AEO Mean?

The name IDAEO combines ID, IDA, and AEO. ID stands for Identity. It helps AI recognize who you are and keeps your identity consistent over time. IDA stands for Identity Data Authority. It provides verifiable identity data from an Official Source for AI, like an embassy in the AI world. AEO stands for Answer Engine Optimization. Its goal is to get AI answers to use your content. Helping AI identify you, providing verifiable data, and checking that answers use it correctly are the starting points for Marketing in the AI era.

Now: Field Testing Together with Merchants and Website Owners

IDAEO has been field-tested and validated at Washinmura, with the first batch of merchants, and with the second batch of industries, and is about to expand into public field testing. Next, IDAEO will recruit more merchants and website owners to test together and study how IDAEO can deliver better results in each of their marketing scenarios. Because merchants' and website owners' First-Party Data keeps supplying practical evidence, joint field testing will push forward advanced research on theory, practice, methodology, and solutions.

This Is a Living Theory

IDAEO gains new data and field validation every month, and its theoretical and empirical foundations keep getting stronger. Interaction between customers and AI keeps changing, so the theory must test its existing judgments against new results so that its explanations of audiences, journeys, and performance keep pace with the changes.

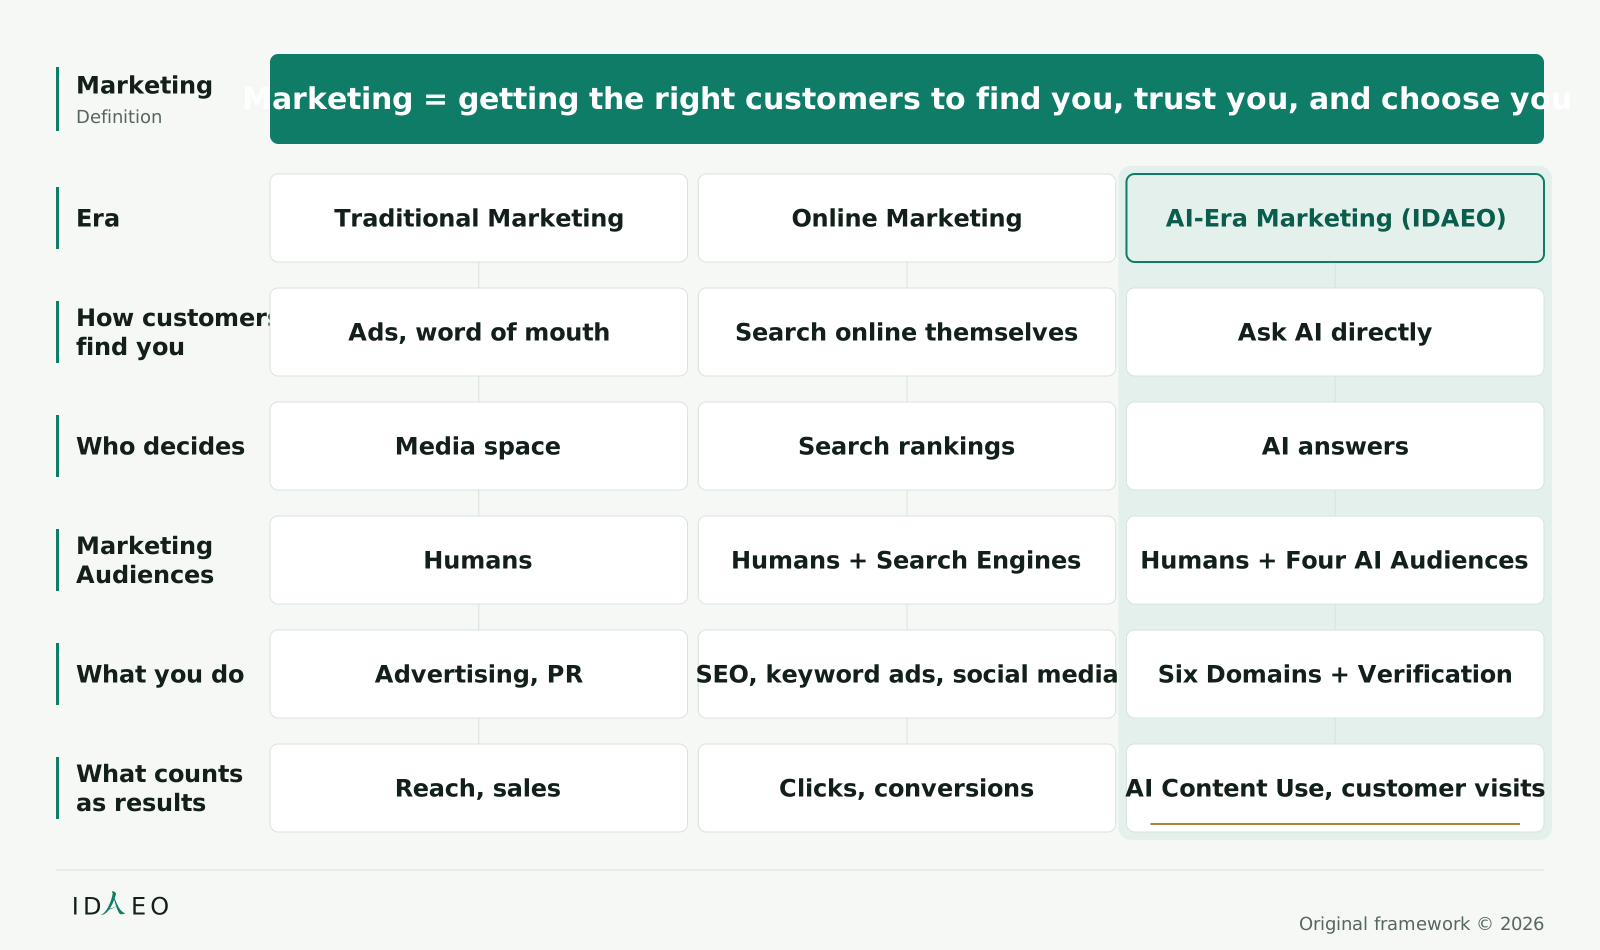
Figure 0-1 Evolution of the Three Marketing Eras

Read left to right: how the way customers find businesses changes, then the Marketing Audiences, strategy, and Performance Measurement; the third column is IDAEO. The way of reaching customers changes with each era, but the core of marketing is always to let the right customers find you, trust you, and choose you.

Evolution of the Three Marketing Eras The three eras of marketing, showing the expansion of Marketing Audiences
Figure 0-1 Evolution of the Three Marketing Eras
View as text

Read the three eras from left to right and compare the five characteristics from top to bottom; the rightmost column is IDAEO.

Marketing
Definition
Marketing = getting the right customers to find you, trust you, and choose you
Era
Traditional Marketing
Online Marketing
AI-Era Marketing (IDAEO)
How customersfind you
Ads, word of mouth
Search online themselves
Ask AI directly
Who decides
Media space
Search rankings
AI answers
MarketingAudiences
Humans
Humans + Search Engines
Humans + Four AI Audiences
What you do
Advertising, PR
SEO, keyword ads, social media
Six Domains + Verification
What countsas results
Reach, sales
Clicks, conversions
AI Content Use, customer visits
ID
EO
Original framework © 2026

How to readRead the three eras from left to right and compare the five characteristics from top to bottom; the rightmost column is IDAEO.

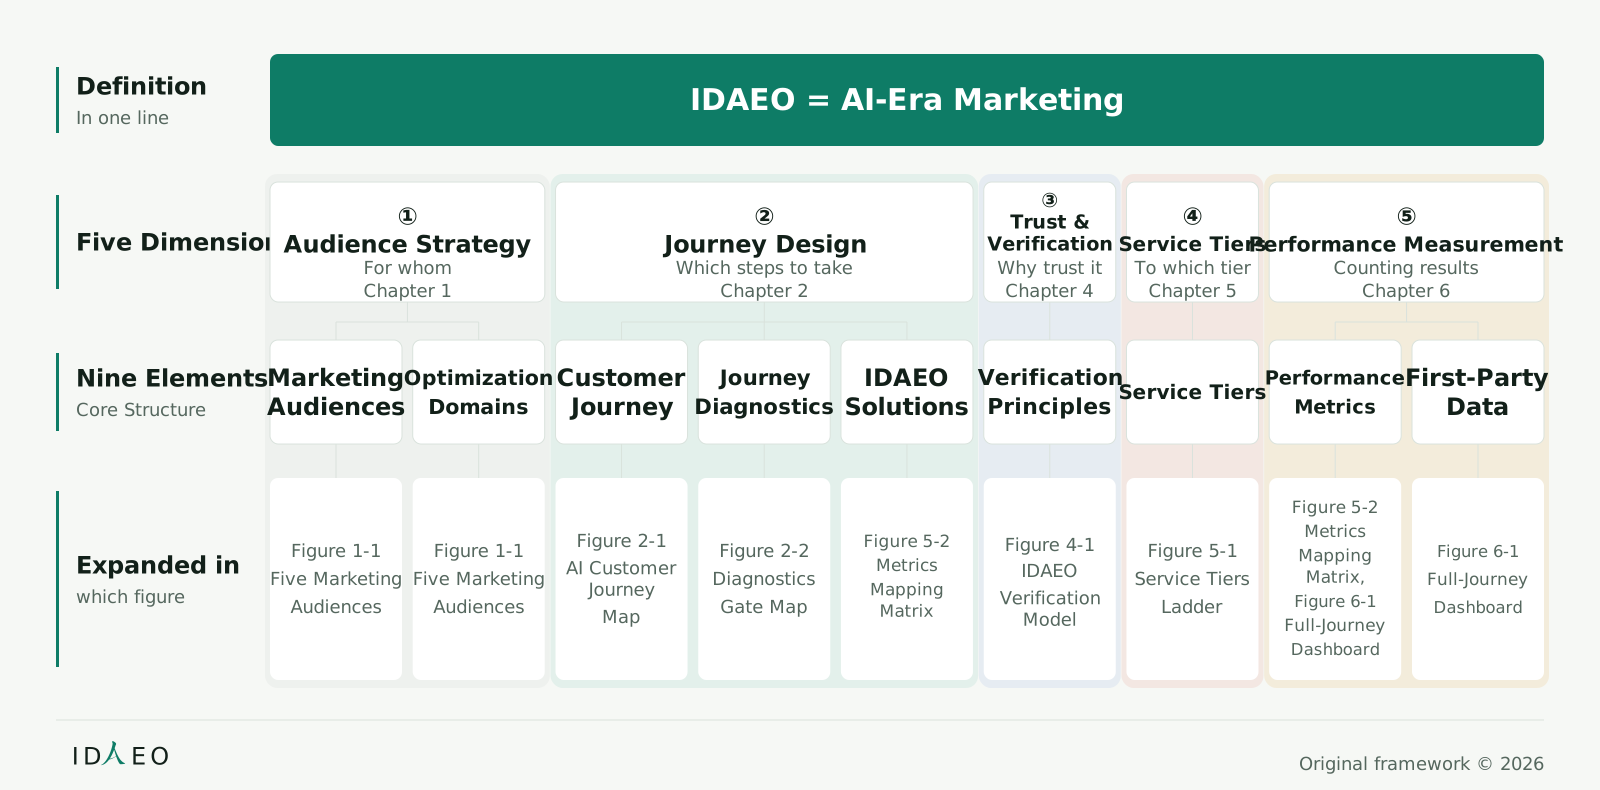
Figure 0-2 Panorama of the IDAEO Theory Framework: Five Dimensions and Nine Elements

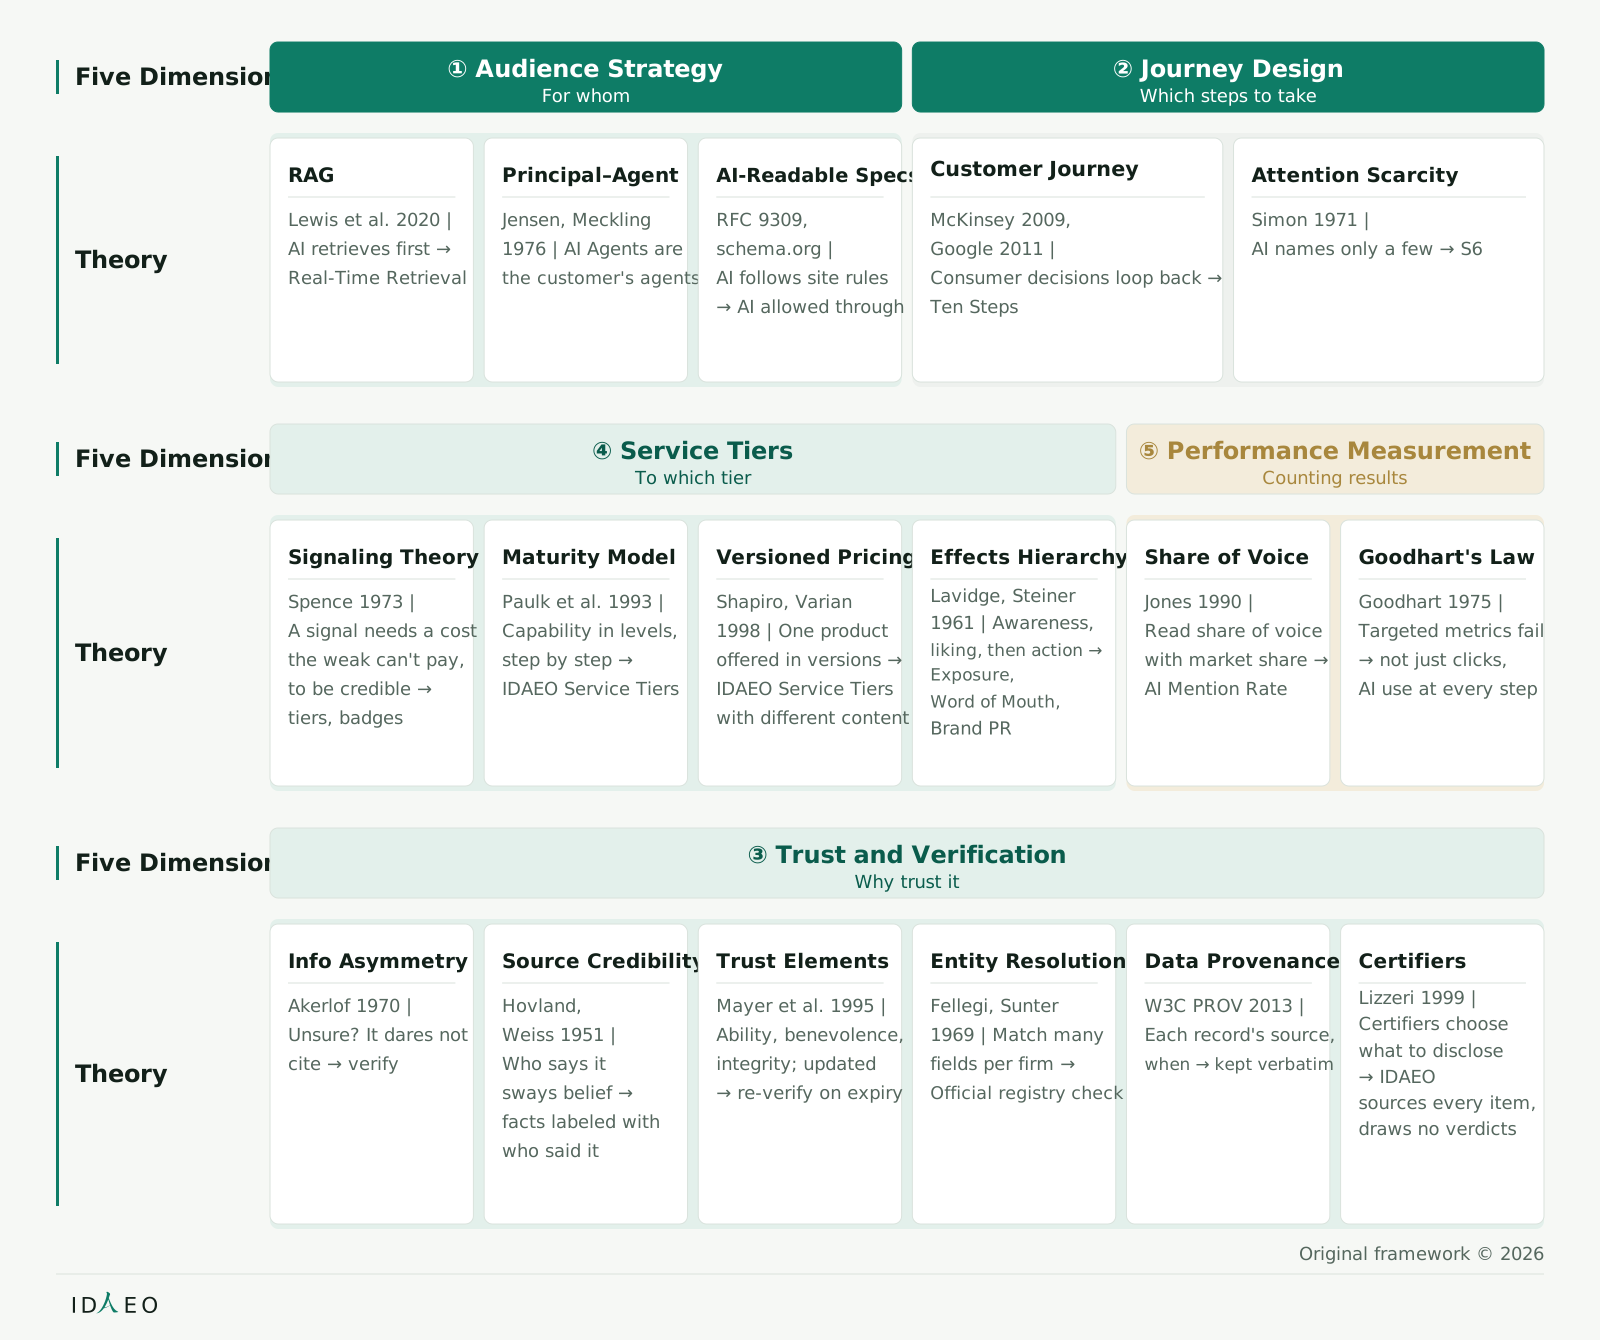
See Chapter 8 for the seven laws. The five dimensions are the framework, and the nine elements are the components. Read from top to bottom: definition, dimensions, and elements; each cell belongs to the one above it. The bottom row links to related content by figure number and figure name, tying principles to results.

Panorama of the IDAEO Theory Framework: Five Dimensions and Nine Elements The Five Dimensions of IDAEO Marketing are the framework
Figure 0-2 Panorama of the IDAEO Theory Framework: Five Dimensions and Nine Elements
View as text

Read from top to bottom: the one-line definition, the five dimensions, and the nine elements; each cell corresponds to the dimension above it, and the bottom row marks, by figure number and figure name, where each element is expanded.

Definition
In one line
IDAEO = AI-Era Marketing
Five Dimensions
①
Audience Strategy
For whom
Chapter 1
②
Journey Design
Which steps to take
Chapter 2
③
Trust &Verification
Why trust it
Chapter 4
④
Service Tiers
To which tier
Chapter 5
⑤
Performance Measurement
Counting results
Chapter 6
Nine Elements
Core Structure
MarketingAudiences
OptimizationDomains
CustomerJourney
JourneyDiagnostics
IDAEO
Solutions
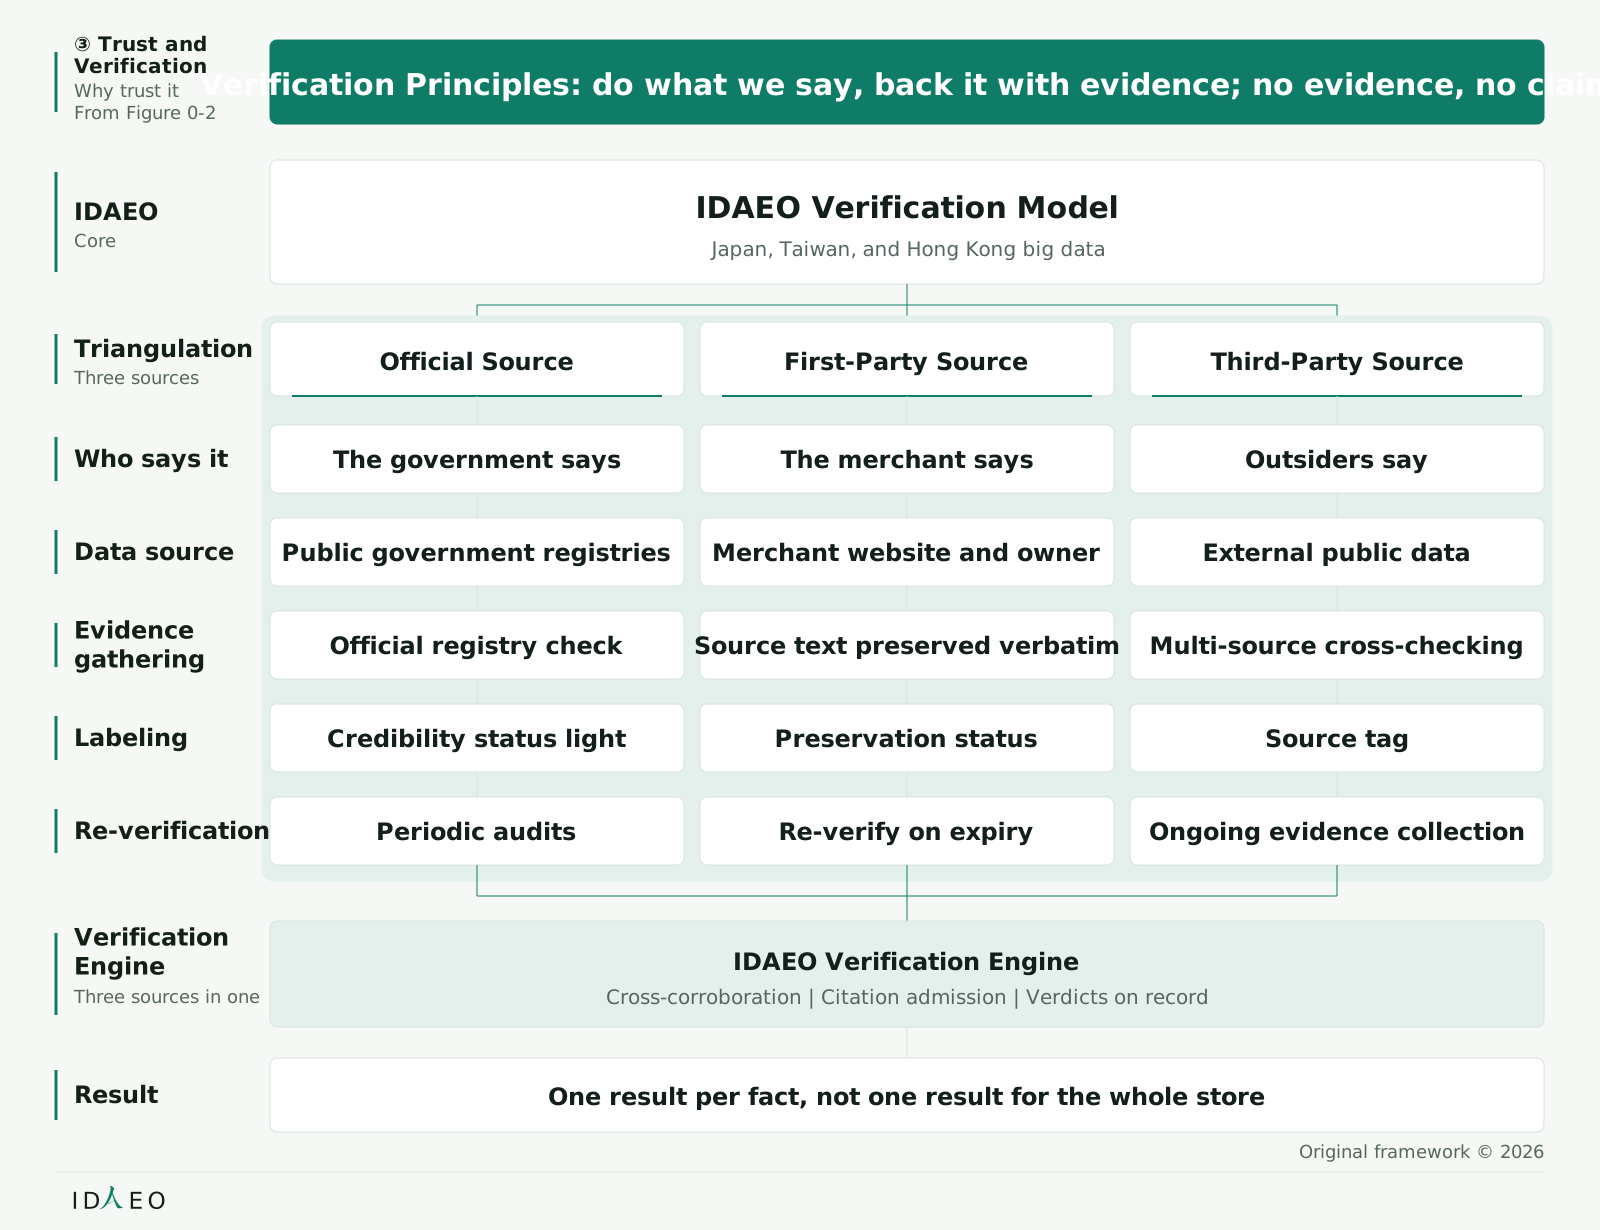
VerificationPrinciples
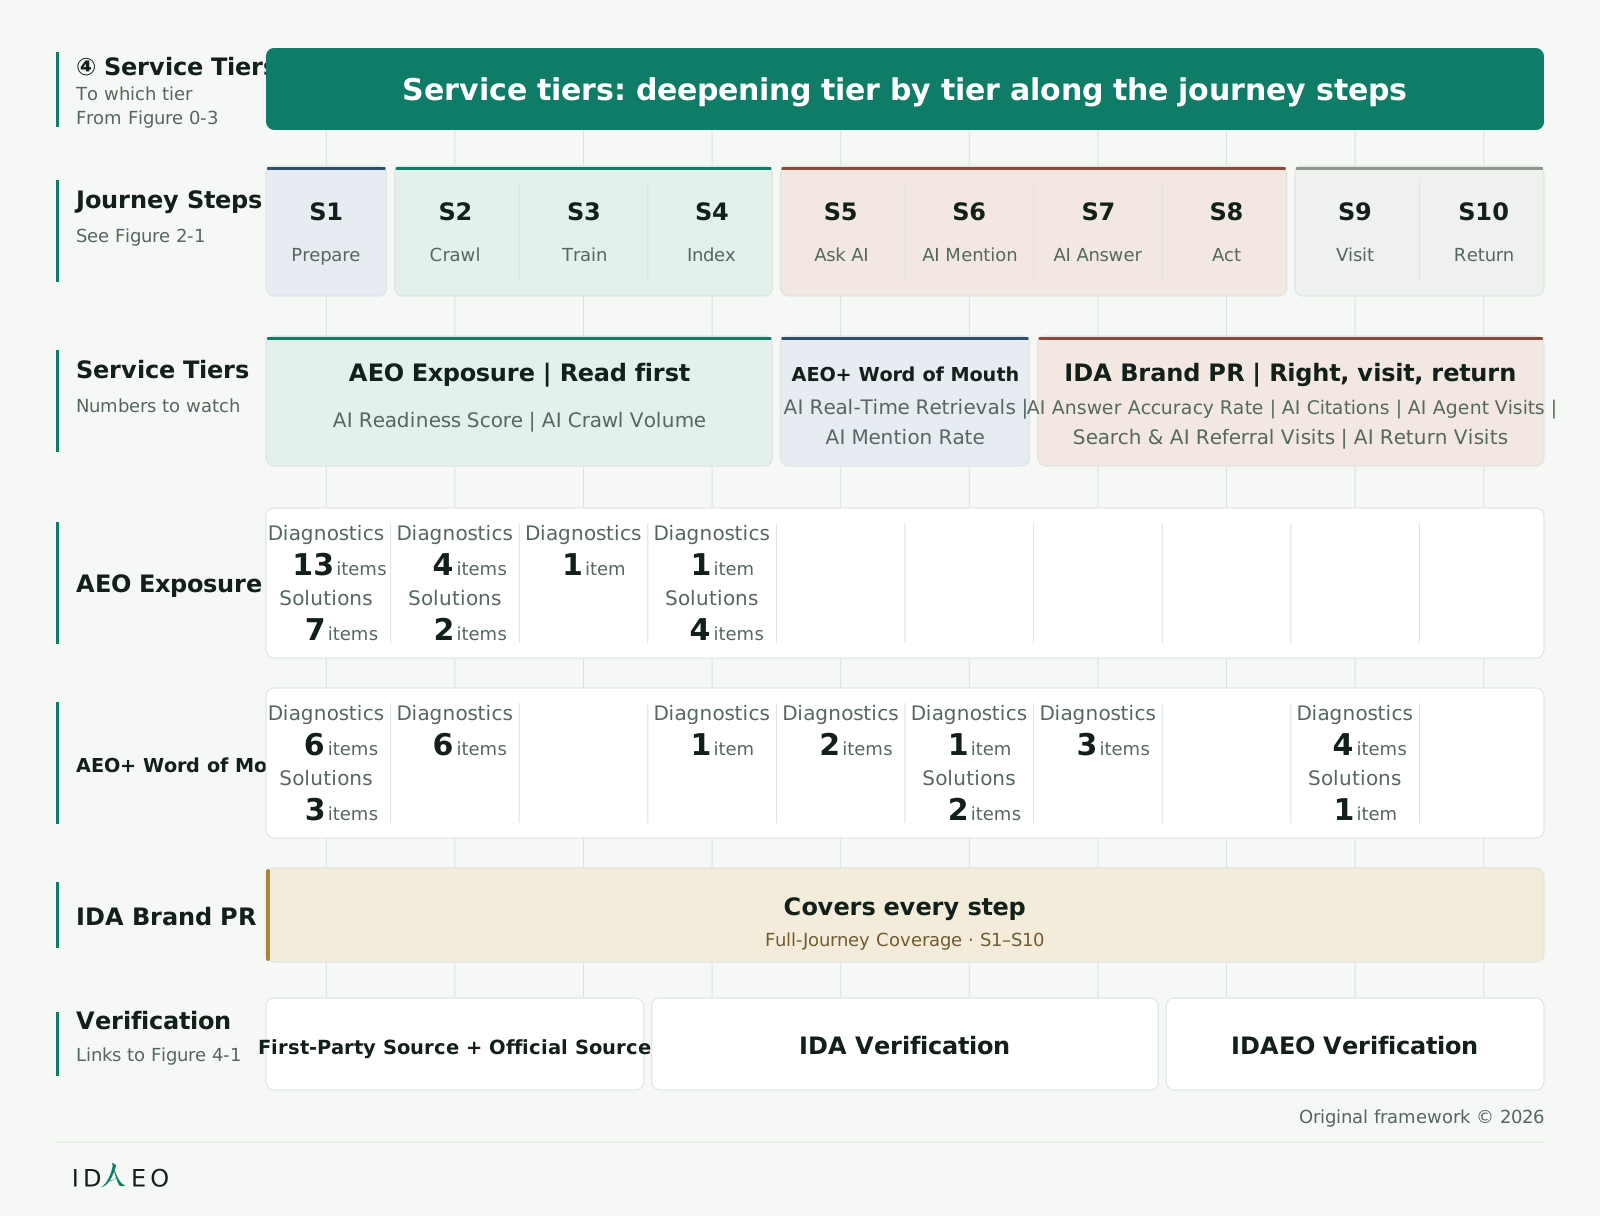
Service Tiers
PerformanceMetrics
First-Party
Data
Expanded in
which figure
Figure 1-1
Five Marketing
Audiences
Figure 1-1
Five Marketing
Audiences
Figure 2-1
AI CustomerJourney
Map
Figure 2-2
Diagnostics
Gate Map
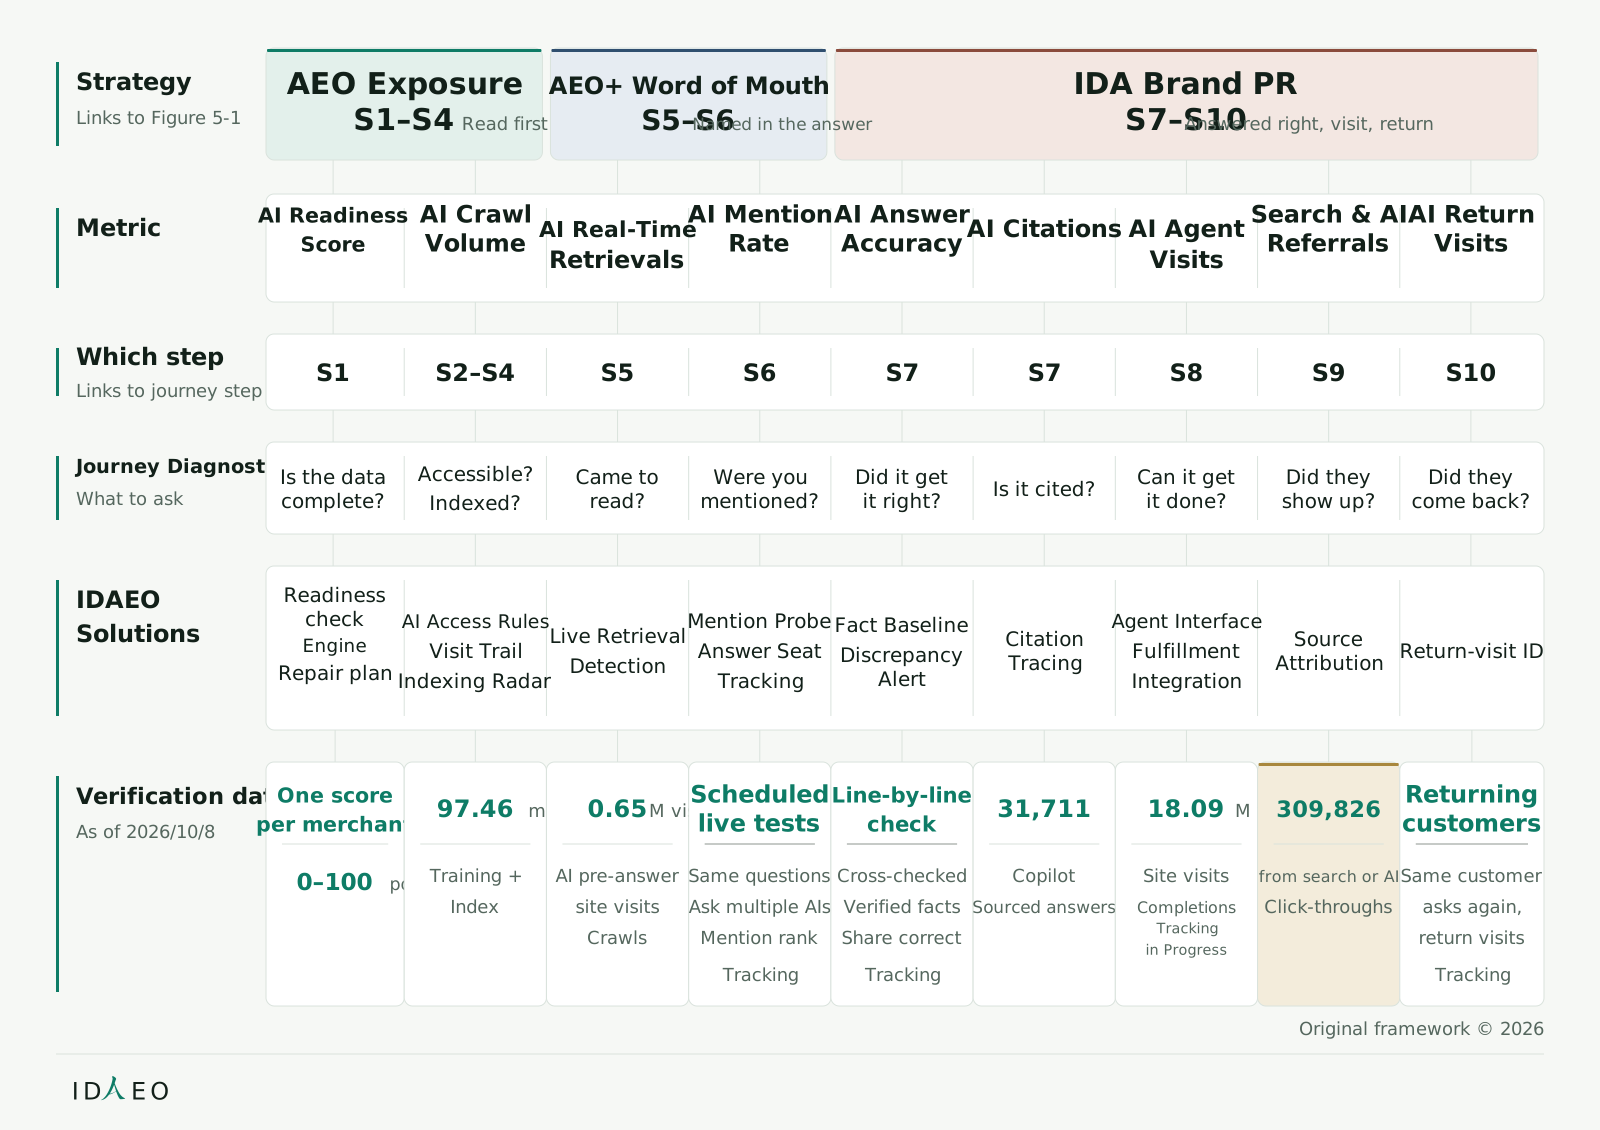
Figure 5-2
Metrics
MappingMatrix
Figure 4-1
IDAEO
VerificationModel
Figure 5-1
Service Tiers
Ladder
Figure 5-2
Metrics
MappingMatrix,
Figure 6-1
Full-Journey
Dashboard
Figure 6-1
Full-Journey
Dashboard
ID
EO
Original framework © 2026

How to readRead from top to bottom: the one-line definition, the five dimensions, and the nine elements; each cell corresponds to the dimension above it, and the bottom row marks, by figure number and figure name, where each element is expanded.

Key Points of This Chapter

ClaimWhy
IDAEO is AI-Era Marketing: it links the complete journey through real-world website measurement, credible facts, and theory.Customers have shifted from searching and comparing links to asking AI and getting an answer. Marketing must first make AI understand and trust, then let AI speak for the brand. TK Lin built this theory on real-world measurement of AI visits to his own website.
AI Impressions provide a foundation for the rest of the journey; impressions do not guarantee that the later steps will happen.AI reading the content in S2–S4 provides a foundation, from S5 onward, for being mentioned, being cited, and customers showing up. Each later step still needs to be verified separately. Compounding Lead is currently a hypothesis: whether content read earlier accumulates use and new data sooner still needs testing. Figure 7-1 lists cumulative requests: 635,000 at the end of March → 21.4 million at the end of June → 99.15 million at the end of September → 105.5 million cumulative by Oct 8 (including AI, search engines, and Automated Bots; these are platform-scale figures and cannot be compared directly with a single merchant's website). Requests before Aug 24 may include duplicates. Monthly requests fell in September compared with August.
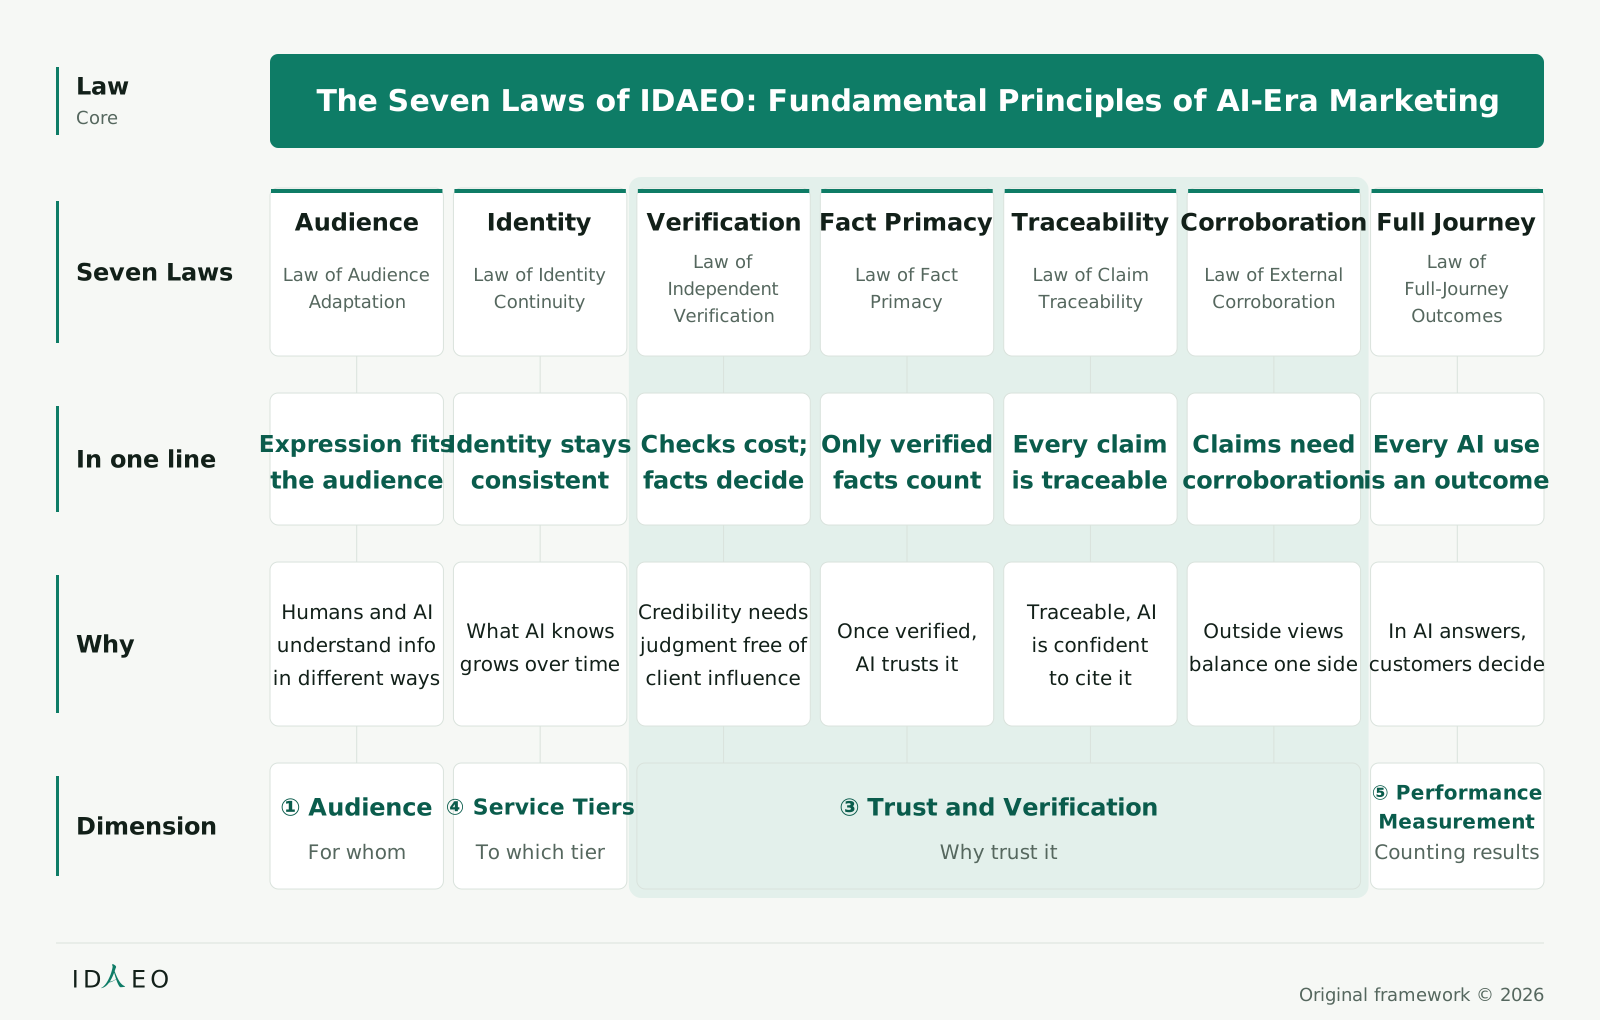
The seven laws are the core, the five dimensions are the framework, and the nine elements are the components (see Chapter 8).The laws currently serve as principles for judgment and still need real-world testing. The dimensions organize marketing work, and the elements connect the principles to results.
The Five Dimensions of IDAEO Marketing link the whole process: Audience Strategy (who it is for), Journey Design (which steps to take), Trust and Verification (why anyone should believe it), Service Tiers (which tier to deliver), and Performance Measurement (how results are counted).Each dimension has its own task; together they cover marketing from information preparation to customer return.
The Nine Elements of the IDAEO Framework correspond to one another: Marketing Audiences, Optimization Domains, Customer Journey, Journey Diagnostics, IDAEO Solutions, Verification Principles, Service Tiers, Performance Metrics, and First-Party Data.Real-world measurement, verification data, and theory connect through the journey, diagnostics, and solutions to results verification, forming a complete methodology.
IDAEO is a Living Theory.Each month's new data and real-world verification test the existing claims and strengthen the theoretical and empirical foundation.

Terms

Marketing
Covers online and offline; it gets the right customers to find you, trust you, and choose you.
Online Marketing
Marketing includes online and offline; online marketing is the part that reaches customers, builds relationships, and drives their choice through online channels. IDAEO connects existing marketing work to the AI stage.
IDAEO
The AI-Era Marketing founded by TK Lin: based on real-world measurement, verification data, and theory, it links process, Journey Diagnostics, methods, solutions, and results verification. The name combines ID (Identity), IDA (Identity Data Authority) and AEO (Answer Engine Optimization); its full English name is Identity-Driven Answer Engine Optimization.
The Seven Laws of IDAEO
The core of IDAEO: the principles for judgment that integrate audience, identity, verification, facts, traceability, corroboration, and full-journey outcomes.
Five Dimensions of IDAEO Marketing
The framework of IDAEO: it organizes marketing work through Audience Strategy (who it is for), Journey Design (which steps to take), Trust and Verification (why anyone should believe it), Service Tiers (which tier to deliver), and Performance Measurement (how results are counted).
Nine Elements of the IDAEO Framework
The components of IDAEO: Marketing Audiences, Optimization Domains, Customer Journey, Journey Diagnostics, IDAEO Solutions, Verification Principles, Service Tiers, Performance Metrics, and First-Party Data.
First-Party Data
Data that IDAEO measures and accumulates directly, used to build the methodology and verify results.
Living Theory
IDAEO gains new data and new real-world verification every month, and its theoretical and empirical foundation keeps strengthening.
ID
Identity: who you are. AI first needs to recognize you. Your identity stays consistent over time.
IDA
Identity Data Authority: an authority for identity data. Verifiable identity data from an Official Source, provided for AI—like an embassy in the AI world.

FAQ

Q: Why is IDAEO a marketing discipline?

A: TK Lin connected real-world website measurement, verification data, and theory into a framework that covers audiences, journey, diagnostics, solutions, and results. Customers ask AI before they choose, so marketing must understand both people and AI, and verify the results of every stage of the journey.

Q: How do the seven laws, five dimensions, and nine elements differ?

A: The seven laws are the core, the five dimensions are the framework, and the nine elements are the components. When reading, first use the laws to understand the principles for judgment, then use the dimensions to grasp the scope of work. Finally, check the elements to see how each piece of work connects to results. See Chapter 8 for the seven laws.

Q: Do you still need to keep doing online marketing?

A: Yes. Marketing includes online and offline, and online marketing is one part of it. IDAEO is AI-Era Marketing: it connects existing marketing work to the AI stage, because customers now ask AI before they choose.

Q: What marketing changes did TK Lin see in real-world website measurement?

A: From Mar 3 to Oct 8, AI, search engines, and Automated Bots made a combined 105.5 million requests. Requests before Aug 24 may include duplicates. Site visits to retrieve content do not mean it has been used for training or indexed. Marketing must make getting AI to understand and trust the content a foundational task.

Q: Why must a merchant's identity information always stay consistent?

A: Consistent identity information lets AI link the content it reads each time back to the same merchant. This is what the Law of Identity Continuity means by “the entity's identity is always consistent.” Check whether AI links different content back to the same merchant. If consistent identity information still leads to misidentification, revisit this law.

This Chapter in Three Sentences

  1. IDAEO builds a marketing framework from real-world website measurements, verification data, and theory.
  2. The seven laws provide principles for judgment. The dimensions and elements organize the work.
  3. Use the journey to assess progress and each month's new data to test claims.

Three Things You Can Do This Week

  1. Ask a few regular customers whether they have recently been searching or asking AI first when looking for a business.
  2. Open your website dashboard and check whether visits are being logged.
  3. Review the four phases and ten steps, and mark where your business stands now.

Next ChapterIn the next chapter, you will learn about Humans and machine audiences, and who your website content needs to reach.

Self-CheckUsing the origin story, state TK Lin's real-world measurement starting point; distinguish the five dimensions and nine elements. Explain how AI exposure supports the subsequent journey and how monthly real-world measurement keeps the theory growing.

Chapter 1

Audience Strategy (Who to Target): Five Marketing Audiences and Six Optimization Domains

This chapter answersWhat do the different Marketing Audiences come to do, and which Optimization Domains do they map to?

Why it comes hereIdentify audiences and functions first; only then can you read the journey numbers.

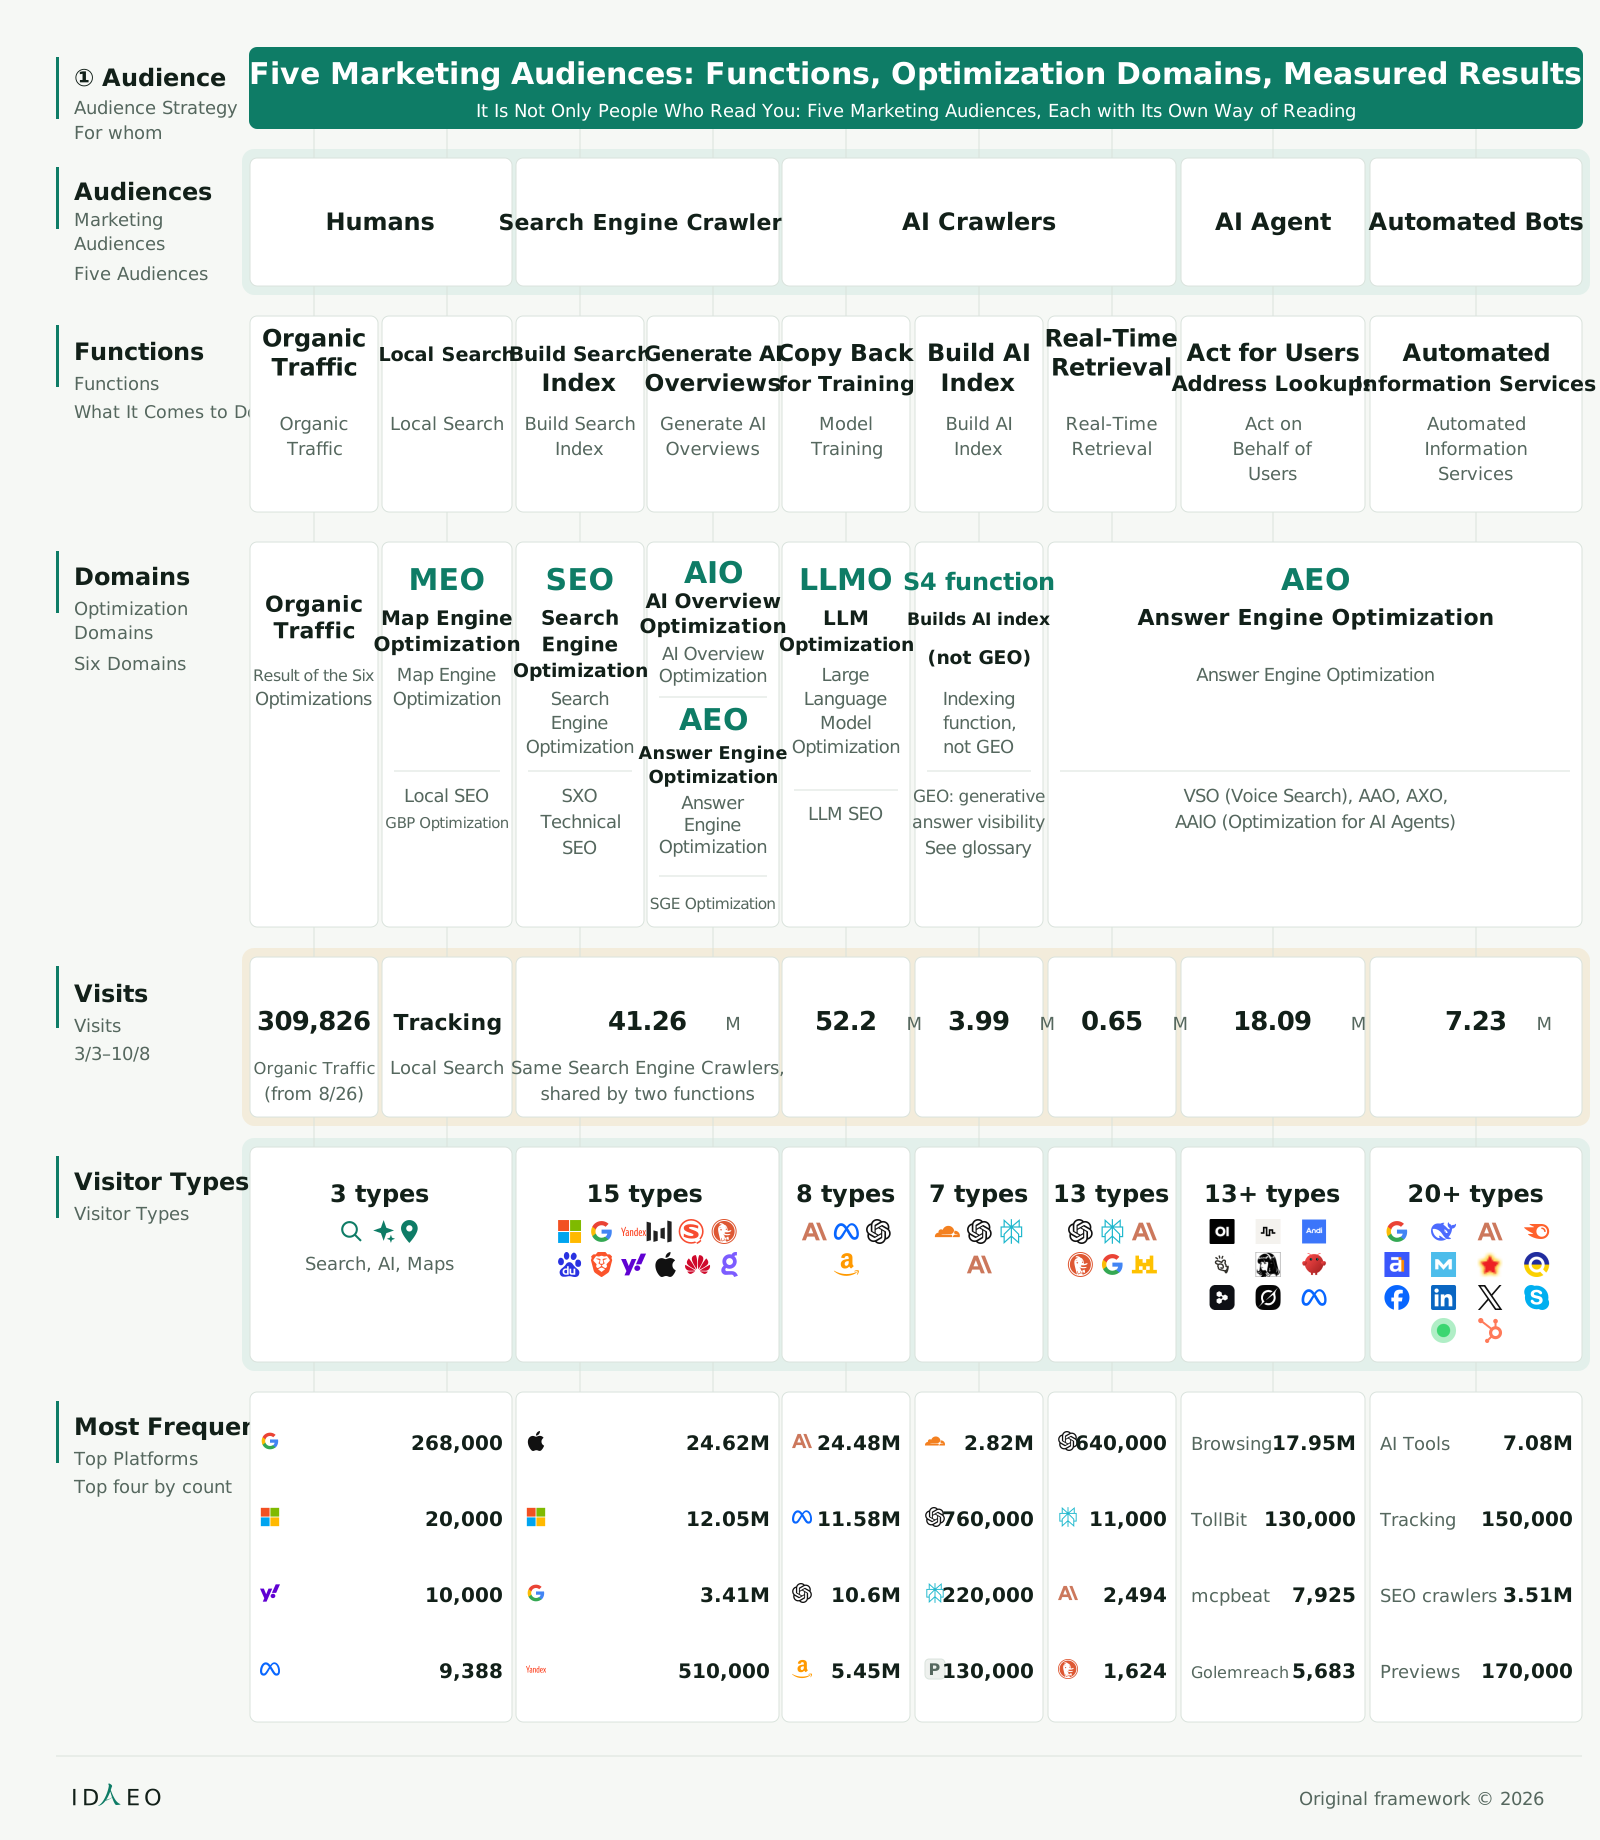
Figure 1-1 Panorama of the Five Marketing Audiences: Functions, Optimization Domains, and Measured Results

Read from top to bottom: Audience Strategy, Marketing Audiences, functions, main related domains, number of visits, visitor types, and the top four; each name has its English below it. The main related domains list abbreviations and full names, with related terms for the same domain below. Counts are by function. GEO appears in the domain legend, with no count attached. The “makes AI Overviews” cell is led by AIO and linked to AEO: AIO focuses on search engine AI Overviews, and AEO gets AI answers to use you. For Humans, the functions list “Organic Traffic” and “Local Search” side by side; Automated Bots provide “Automated Information Services.” AEO also supports AI real-time reads, AI Agents, and Automated Information Services. AEO is an Optimization Domain focused on getting AI answers to use content. GEO is an Optimization Domain focused on making content more visible in generative answers. Both involve the answer stage, and their scopes overlap.

Panorama of the Five Marketing Audiences: Functions, Optimization Domains, and Measured Results The functions, Optimization Domains, and measured results of the Five Marketing Audiences, shown together
Figure 1-1 Panorama of the Five Marketing Audiences: Functions, Optimization Domains, and Measured Results
View as text

Read top to bottom: Audience Strategy, Marketing Audiences, function, Optimization Domains, visit counts, visitor types, and the top four.

① Audience
For whom
Five Marketing Audiences: Functions, Optimization Domains, Measured Results
It Is Not Only People Who Read You: Five Marketing Audiences, Each with Its Own Way of Reading
Audiences
Five Audiences
Humans
Humans
Search Engine Crawlers
AI Crawlers
AI Crawlers
AI Agent
AI Agents
Automated Bots
Automated
Bots
Functions
What It Comes to Do
OrganicTraffic
Organic
Traffic
Local Search
Local Search
Build Search
Index
Build Search
Index
Generate AI
Overviews
Generate AI
Overviews
Copy Back
for Training
Model
Training
Build AI
Index
Build AI
Index
Real-TimeRetrieval
Real-Time
Retrieval
Act for Users
Address Lookups
Act on
Behalf of
Users
Automated
Information Services
Automated
Information
Services
Domains
Six Domains
Visits
3/3–10/8
Visitor Types
3 types
Search, AI, Maps
15 types
8 types
7 types
13 types
13+ types
20+ types
Most Frequent
Top four by count
268,000
20,000
10,000
9,388
24.62M
12.05M
3.41M
510,000
24.48M
11.58M
10.6M
5.45M
P
2.82M
760,000
220,000
130,000
640,000
11,000
2,494
1,624
Browsing
17.95M
TollBit
130,000
mcpbeat
7,925
5,683
Golemreach
AI Tools
7.08M
Tracking
150,000
SEO crawlers
3.51M
Previews
170,000
ID
EO
Original framework © 2026
Audience Strategy
Marketing
Audiences
Functions
Optimization
Domains
Visits
Visitor Types
Top Platforms
Organic Traffic
(from 8/26)
Local Search
Same Search Engine Crawlers,
shared by two functions
OrganicTraffic
Result of the Six
Optimizations
MEO
Map Engine
Optimization
Local SEO
GBP Optimization
SEO
SearchEngine
Optimization
SXO
Technical
SEO
AIO
AI Overview
Optimization
AEO
Answer Engine
Optimization
SGE Optimization
LLMO
LLM
Optimization
LLM SEO
S4 function
Builds AI index
(not GEO)
GEO: generative
answer visibility
See glossary
AEO
Answer Engine Optimization
VSO (Voice Search), AAO, AXO,
AAIO (Optimization for AI Agents)
309,826
41.26M
52.2M
3.99M
0.65M
18.09M
7.23M
Map Engine
Optimization
Search
Engine
Optimization
AI Overview
Optimization
Large
Language
Model
Optimization
Indexing
function,
not GEO
Answer
Engine
Optimization
Tracking

Terms from the same field are listed directly under the main name according to how they are used. AIO is linked to AEO; the industry uses AIO to mean “AI Overview Optimization” or as a general term for “AI optimization,” and both correspond to getting AI answers to use your content. In IDAEO, AIO refers to optimizing search engine AI Overviews. ASO, CRO, and SMO belong to traditional digital marketing and work alongside the Six Optimization Domains.

How to readRead top to bottom: Audience Strategy, Marketing Audiences, function, Optimization Domains, visit counts, visitor types, and the top four.

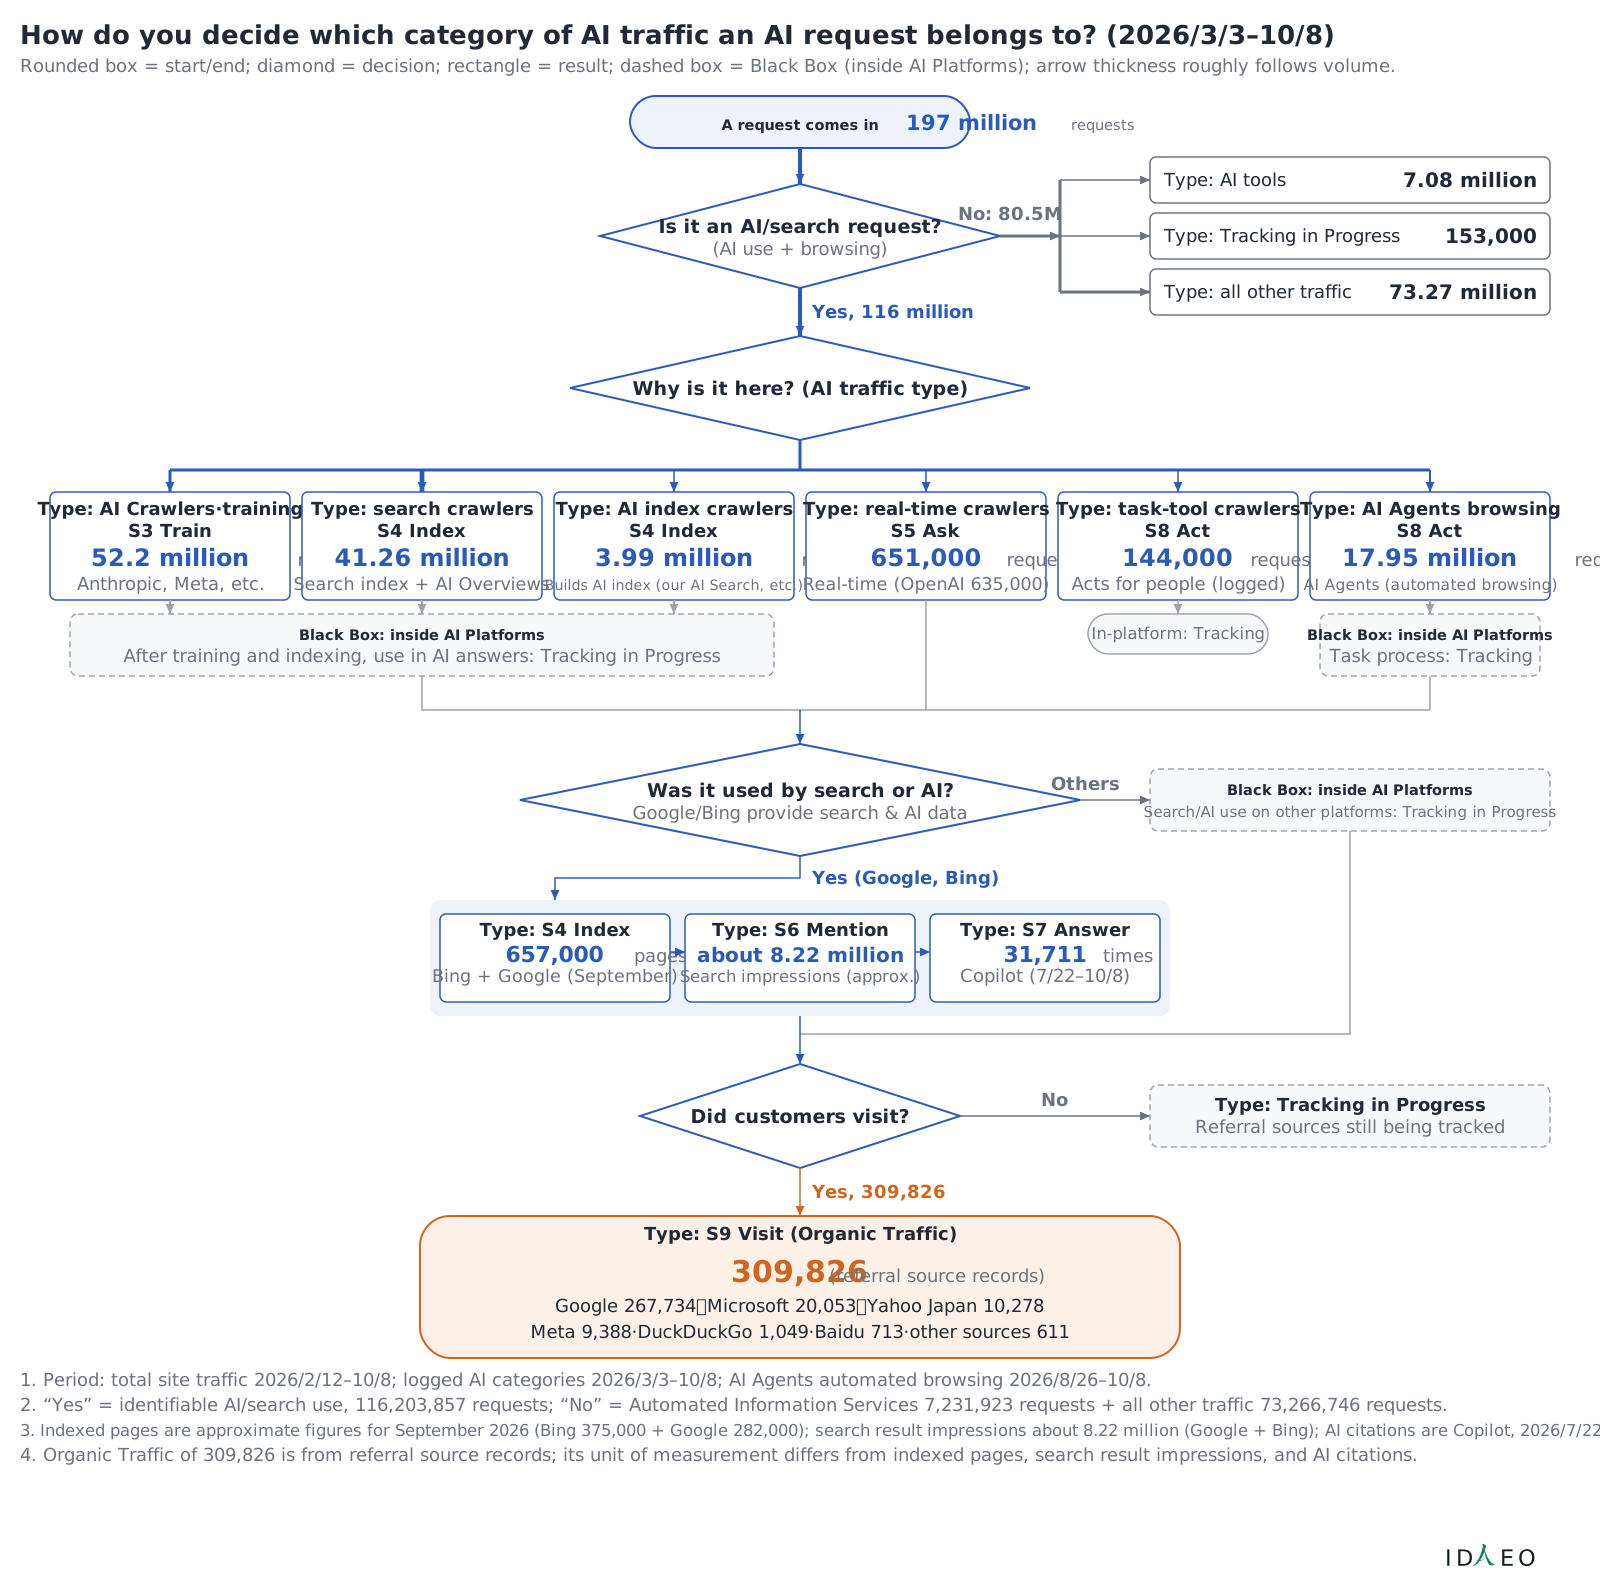
Figure 1-2 AI Traffic Classification Tree: How Do You Tell Which Type of AI Traffic an AI Request Belongs To?

AI Traffic Classification Tree: How Do You Tell Which Type of AI Traffic an AI Request Belongs To? How do you decide which category of AI traffic an AI request belongs to?
Figure 1-2 AI Traffic Classification Tree: How Do You Tell Which Type of AI Traffic an AI Request Belongs To?
View as text

Start from the request at the top and read down through the classification basis and function; the end point is which of the Marketing Audiences it belongs to.

How do you decide which category of AI traffic an AI request belongs to? (2026/3/3–10/8)
Rounded box = start/end; diamond = decision; rectangle = result; dashed box = Black Box (inside AI Platforms); arrow thickness roughly follows volume.
A request comes in 197 million requests
Is it an AI/search request?
(AI use + browsing)
No: 80.5M
Type: AI tools
7.08 million
Type: Tracking in Progress
153,000
Type: all other traffic
73.27 million
Yes, 116 million
Why is it here? (AI traffic type)
Type: AI Crawlers·training
S3 Train
52.2 million requests
Anthropic, Meta, etc.
Type: search crawlers
S4 Index
41.26 million requests
Search index + AI Overviews
Type: AI index crawlers
S4 Index
3.99 million requests
Builds AI index (our AI Search, etc.)
Type: real-time crawlers
S5 Ask
651,000 requests
Real-time (OpenAI 635,000)
Type: task-tool crawlers
S8 Act
144,000 requests
Acts for people (logged)
Type: AI Agents browsing
S8 Act
17.95 million requests
AI Agents (automated browsing)
In-platform: Tracking
Black Box: inside AI Platforms
After training and indexing, use in AI answers: Tracking in Progress
Black Box: inside AI Platforms
Task process: Tracking
Was it used by search or AI?
Google/Bing provide search & AI data
Others
Black Box: inside AI Platforms
Search/AI use on other platforms: Tracking in Progress
Yes (Google, Bing)
Type: S4 Index
657,000 pages
Bing + Google (September)
Type: S6 Mention
about 8.22 million times
Search impressions (approx.)
Type: S7 Answer
31,711 times
Copilot (7/22–10/8)
Did customers visit?
No
Type: Tracking in Progress
Referral sources still being tracked
Yes, 309,826
Type: S9 Visit (Organic Traffic)
309,826 (referral source records)
Google 267,734・Microsoft 20,053・Yahoo Japan 10,278
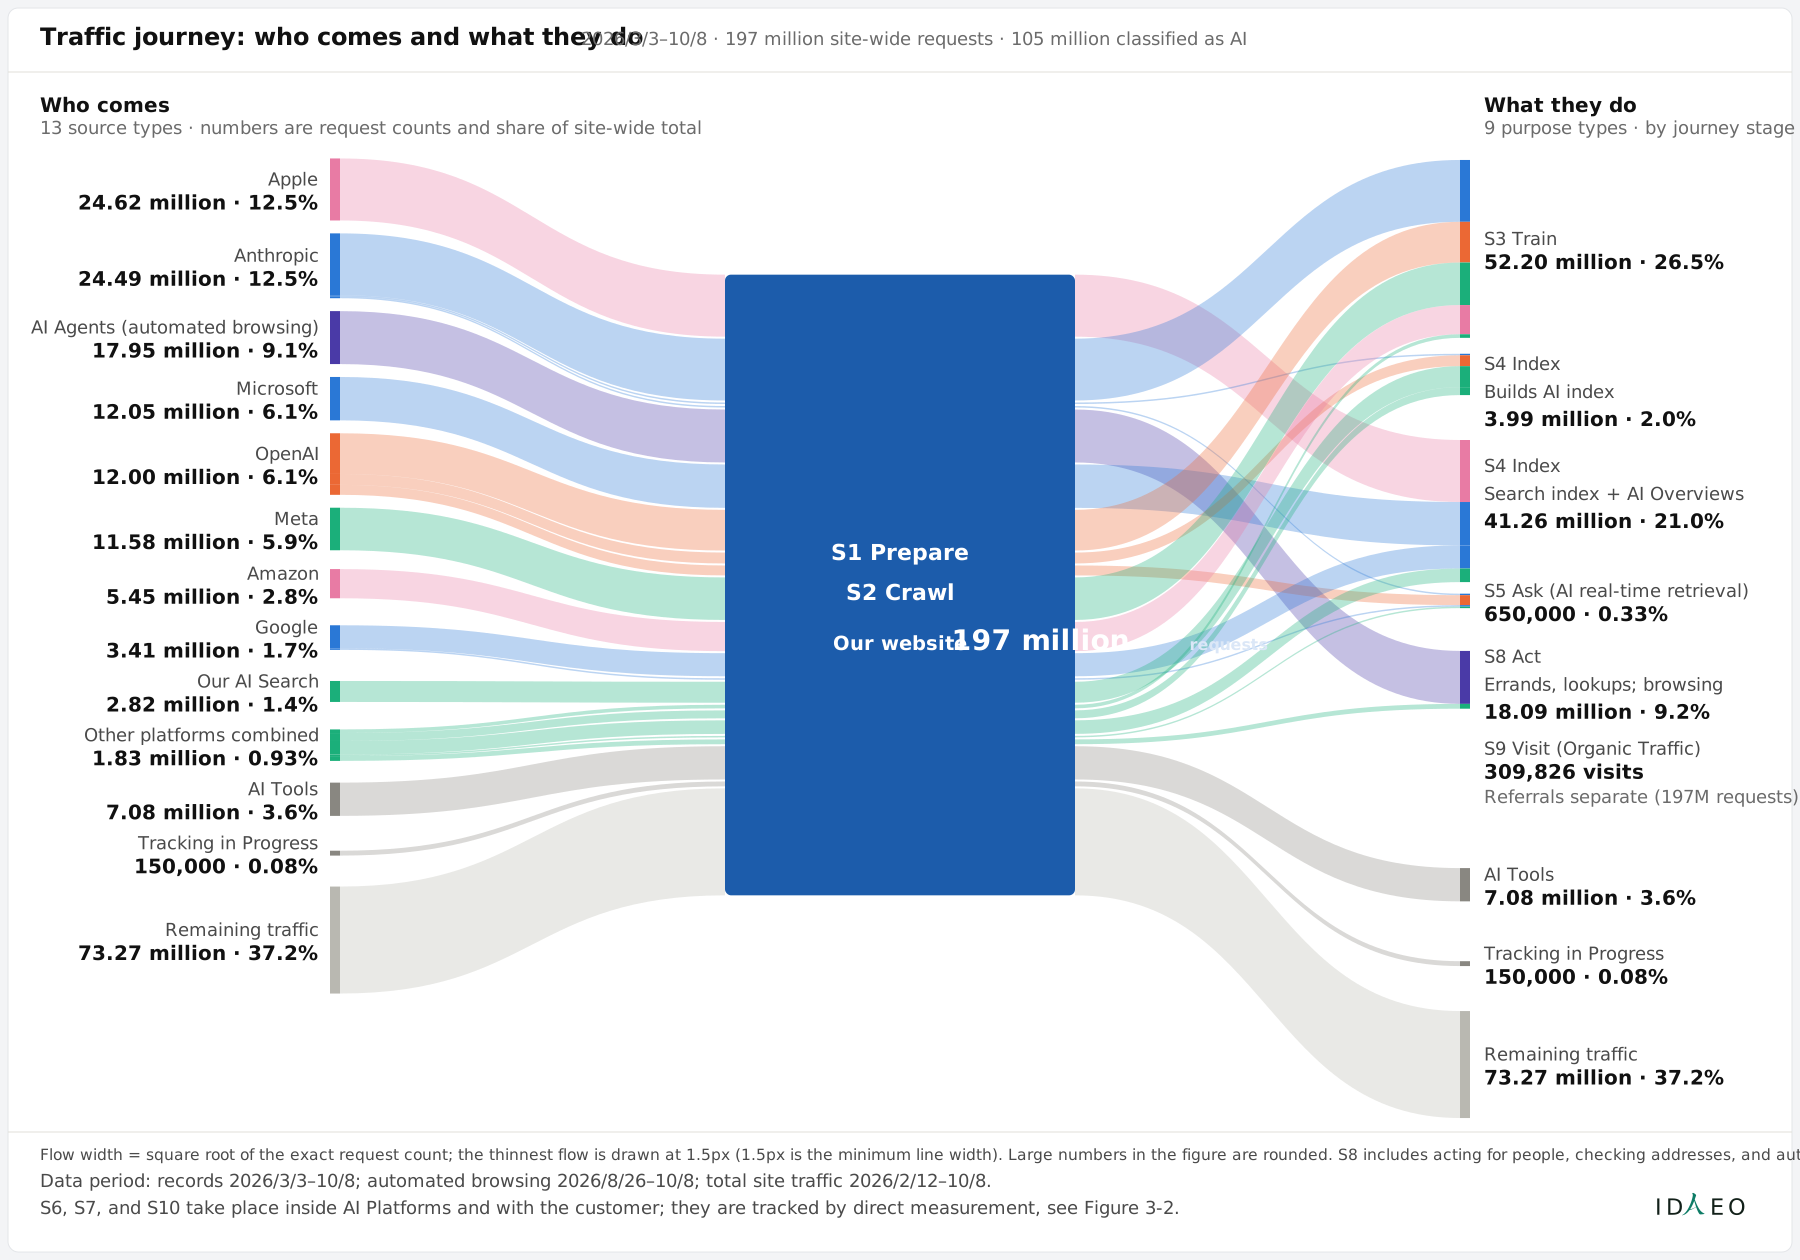
1. Period: total site traffic 2026/2/12–10/8; logged AI categories 2026/3/3–10/8; AI Agents automated browsing 2026/8/26–10/8.
2. “Yes” = identifiable AI/search use, 116,203,857 requests; “No” = Automated Information Services 7,231,923 requests + all other traffic 73,266,746 requests.
3. Indexed pages are approximate figures for September 2026 (Bing 375,000 + Google 282,000); search result impressions about 8.22 million (Google + Bing); AI citations are Copilot, 2026/7/22–10/8.
4. Organic Traffic of 309,826 is from referral source records; its unit of measurement differs from indexed pages, search result impressions, and AI citations.
Meta 9,388·DuckDuckGo 1,049·Baidu 713·other sources 611
ID
EO
AI Traffic Classification Tree: How Do You Tell Which Type of AI Traffic an AI Request Belongs To?
ItemValue
Type: AI tools7.08 million
Type: Tracking in Progress153,000
Type: all other traffic73.27 million
Type: AI Crawlers·training52.2 million
Type: search crawlers41.26 million
Type: AI index crawlers3.99 million
Type: real-time crawlers651,000
Type: task-tool crawlers144,000
Type: AI Agents browsing17.95 million
CSV

How to readStart from the request at the top and read down through the classification basis and function; the end point is which of the Marketing Audiences it belongs to.

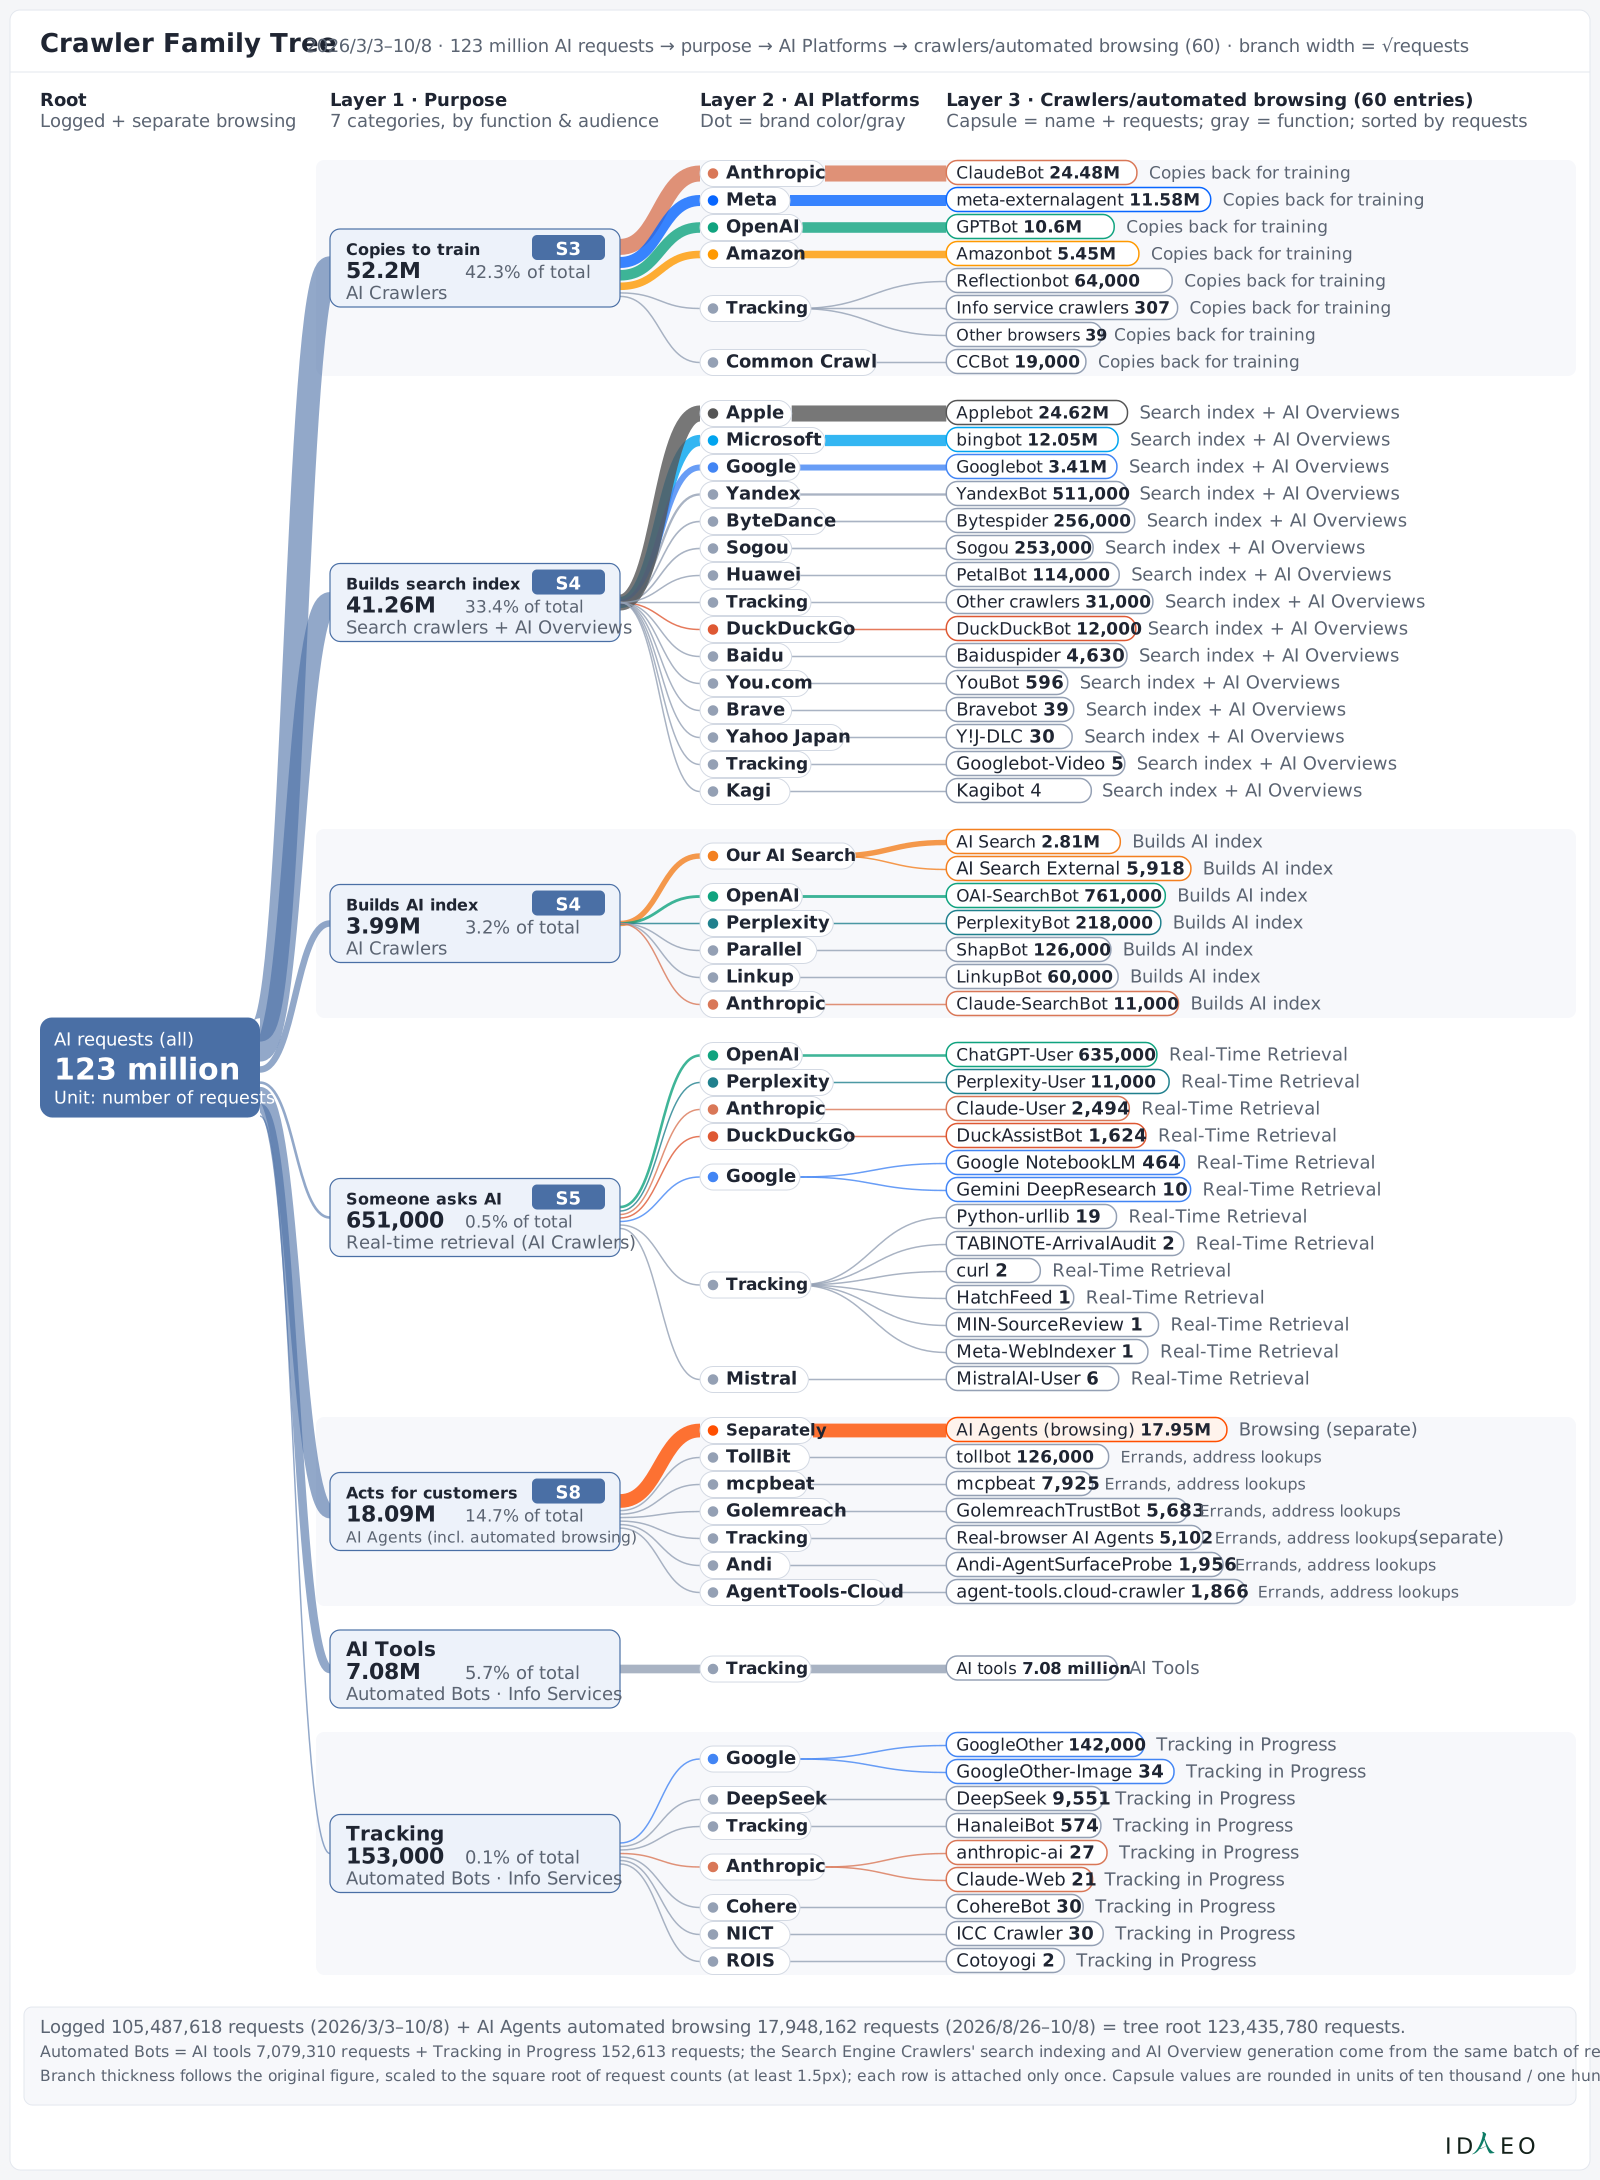
Figure 1-3 AI Platforms and Crawlers Family Tree: Which Companies and Which Crawlers Sit Under Each Function

Extended figures: Figure 1-2, “AI Traffic Classification Tree,” determines which type of AI traffic an AI request belongs to; Figure 1-3, “AI Platforms and Crawlers Family Tree,” lists the AI Platforms and crawlers under each function.

AI Platforms and Crawlers Family Tree: Which Companies and Which Crawlers Sit Under Each Function The AI Platforms and crawlers that correspond to each function
Figure 1-3 AI Platforms and Crawlers Family Tree: Which Companies and Which Crawlers Sit Under Each Function
View as text

Read from root to branch: function, AI Platforms, and crawlers; the same company on different branches means it takes part in different functions.

Crawler Family Tree
2026/3/3–10/8 · 123 million AI requests → purpose → AI Platforms → crawlers/automated browsing (60) · branch width = √requests
Root
Logged + separate browsing
Layer 1 · Purpose
7 categories, by function & audience
Layer 2 · AI Platforms
Dot = brand color/gray
Layer 3 · Crawlers/automated browsing (60 entries)
Capsule = name + requests; gray = function; sorted by requests
AI requests (all)
123 million
Unit: number of requests
Copies to train
S3
52.2M
42.3% of total
AI Crawlers
Builds search index
S4
41.26M
33.4% of total
Search crawlers + AI Overviews
Builds AI index
S4
3.99M
3.2% of total
AI Crawlers
Someone asks AI
S5
651,000
0.5% of total
Real-time retrieval (AI Crawlers)
Acts for customers
S8
18.09M
14.7% of total
AI Agents (incl. automated browsing)
AI Tools
7.08M
5.7% of total
Automated Bots · Info Services
Tracking
153,000
0.1% of total
Automated Bots · Info Services
Anthropic
Meta
OpenAI
Amazon
Tracking
Common Crawl
Microsoft
Google
Yandex
ByteDance
Sogou
Tracking
DuckDuckGo
Baidu
Brave
Yahoo Japan
Apple
Our AI Search
OpenAI
Perplexity
Parallel
Huawei
Linkup
Anthropic
You.com
Tracking
Kagi
OpenAI
Perplexity
Anthropic
DuckDuckGo
Google
Tracking
Mistral
Separately
TollBit
mcpbeat
Golemreach
Tracking
Andi
AgentTools-Cloud
Tracking
Google
DeepSeek
Tracking
Anthropic
Cohere
NICT
ROIS
ClaudeBot 24.48M
Copies back for training
meta-externalagent 11.58M
Copies back for training
GPTBot 10.6M
Copies back for training
Amazonbot 5.45M
Copies back for training
Reflectionbot 64,000
Copies back for training
Info service crawlers 307
Copies back for training
Other browsers 39
Copies back for training
CCBot 19,000
Copies back for training
bingbot 12.05M
Search index + AI Overviews
Googlebot 3.41M
Search index + AI Overviews
YandexBot 511,000
Search index + AI Overviews
Bytespider 256,000
Search index + AI Overviews
Sogou 253,000
Search index + AI Overviews
Other crawlers 31,000
Search index + AI Overviews
DuckDuckBot 12,000
Search index + AI Overviews
Baiduspider 4,630
Search index + AI Overviews
Bravebot 39
Search index + AI Overviews
Y!J-DLC 30
Search index + AI Overviews
Applebot 24.62M
Search index + AI Overviews
AI Search 2.81M
Builds AI index
AI Search External 5,918
Builds AI index
OAI-SearchBot 761,000
Builds AI index
PerplexityBot 218,000
Builds AI index
ShapBot 126,000
Builds AI index
PetalBot 114,000
Search index + AI Overviews
LinkupBot 60,000
Builds AI index
Claude-SearchBot 11,000
Builds AI index
YouBot 596
Search index + AI Overviews
Googlebot-Video 5
Search index + AI Overviews
Kagibot 4
Search index + AI Overviews
ChatGPT-User 635,000
Real-Time Retrieval
Perplexity-User 11,000
Real-Time Retrieval
Claude-User 2,494
Real-Time Retrieval
DuckAssistBot 1,624
Real-Time Retrieval
Google NotebookLM 464
Real-Time Retrieval
Gemini DeepResearch 10
Real-Time Retrieval
Python-urllib 19
Real-Time Retrieval
TABINOTE-ArrivalAudit 2
Real-Time Retrieval
curl 2
Real-Time Retrieval
HatchFeed 1
Real-Time Retrieval
MIN-SourceReview 1
Real-Time Retrieval
Meta-WebIndexer 1
Real-Time Retrieval
MistralAI-User 6
Real-Time Retrieval
AI Agents (browsing) 17.95M
Browsing (separate)
tollbot 126,000
Errands, address lookups
mcpbeat 7,925
Errands, address lookups
GolemreachTrustBot 5,683
Errands, address lookups
Real-browser AI Agents 5,102
Errands, address lookups
(separate)
Andi-AgentSurfaceProbe 1,956
Errands, address lookups
agent-tools.cloud-crawler 1,866
Errands, address lookups
AI tools 7.08 million
AI Tools
GoogleOther 142,000
Tracking in Progress
GoogleOther-Image 34
Tracking in Progress
DeepSeek 9,551
Tracking in Progress
HanaleiBot 574
Tracking in Progress
anthropic-ai 27
Tracking in Progress
Claude-Web 21
Tracking in Progress
CohereBot 30
Tracking in Progress
ICC Crawler 30
Tracking in Progress
Cotoyogi 2
Tracking in Progress
Logged 105,487,618 requests (2026/3/3–10/8) + AI Agents automated browsing 17,948,162 requests (2026/8/26–10/8) = tree root 123,435,780 requests.
Automated Bots = AI tools 7,079,310 requests + Tracking in Progress 152,613 requests; the Search Engine Crawlers' search indexing and AI Overview generation come from the same batch of requests.
Branch thickness follows the original figure, scaled to the square root of request counts (at least 1.5px); each row is attached only once. Capsule values are rounded in units of ten thousand / one hundred million.
ID
EO
AI Platforms and Crawlers Family Tree: Which Companies and Which Crawlers Sit Under Each Function
ItemValue
ClaudeBot24.48M
meta-externalagent11.58M
GPTBot10.6M
Amazonbot5.45M
Reflectionbot64,000
Info service crawlers307
Other browsers39
CCBot19,000
bingbot12.05M
Googlebot3.41M
YandexBot511,000
Bytespider256,000
Sogou253,000
Other crawlers31,000
DuckDuckBot12,000
Baiduspider4,630
Bravebot39
Y!J-DLC30
Applebot24.62M
AI Search2.81M
AI Search External5,918
OAI-SearchBot761,000
PerplexityBot218,000
ShapBot126,000
PetalBot114,000
LinkupBot60,000
Claude-SearchBot11,000
YouBot596
Googlebot-Video5
Kagibot4
ChatGPT-User635,000
Perplexity-User11,000
Claude-User2,494
DuckAssistBot1,624
Google NotebookLM464
Gemini DeepResearch10
Python-urllib19
TABINOTE-ArrivalAudit2
curl2
HatchFeed1
MIN-SourceReview1
Meta-WebIndexer1
MistralAI-User6
AI Agents (browsing)17.95M
tollbot126,000
mcpbeat7,925
GolemreachTrustBot5,683
Real-browser AI Agents5,102
Andi-AgentSurfaceProbe1,956
agent-tools.cloud-crawler1,866
AI tools7.08M
GoogleOther142,000
GoogleOther-Image34
DeepSeek9,551
HanaleiBot574
anthropic-ai27
Claude-Web21
CohereBot30
ICC Crawler30
Cotoyogi2
CSV

How to readRead from root to branch: function, AI Platforms, and crawlers; the same company on different branches means it takes part in different functions.

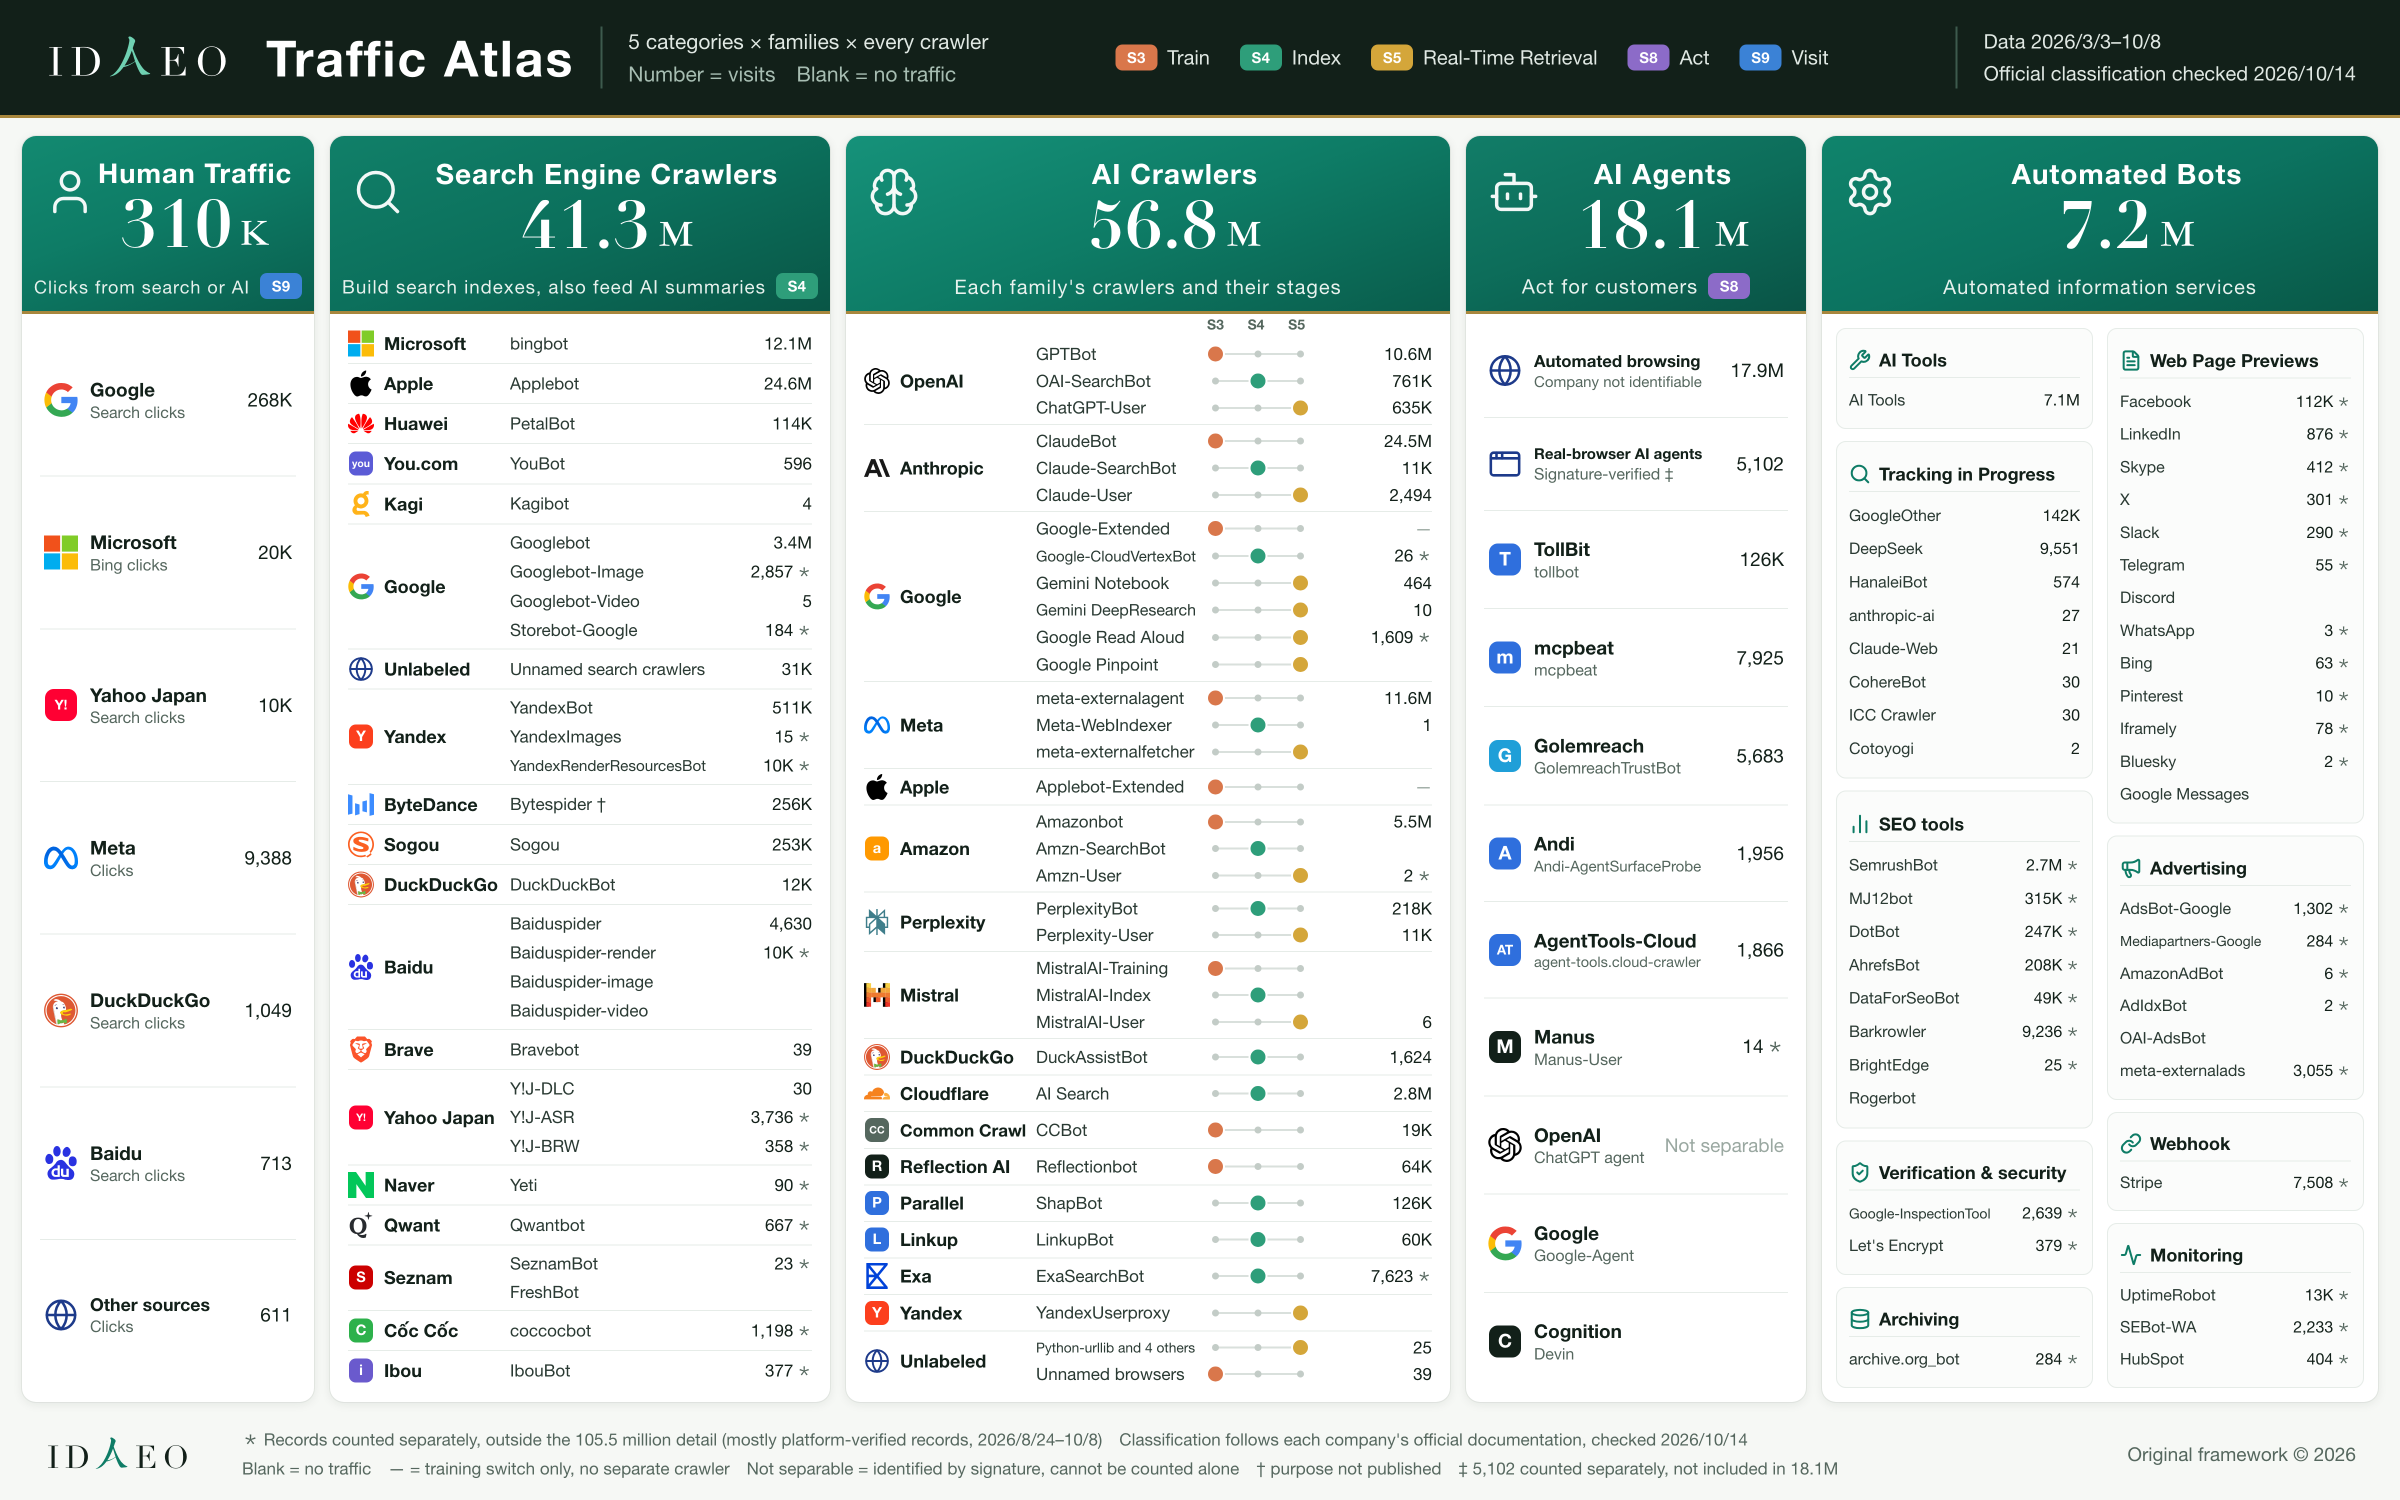
Figure 1-4 IDAEO Traffic Atlas: Five Traffic Categories, Each Family, and Every Crawler

IDAEO Traffic Atlas: Five Traffic Categories, Each Family, and Every Crawler Answers “What kinds of AI Crawlers are there?” and lists every traffic source at once: which companies appear in each of the five traffic categories, which crawlers each company sends, and how many visits each made
Figure 1-4 IDAEO Traffic Atlas: Five Traffic Categories, Each Family, and Every Crawler
View as text

From left to right are the five traffic categories, with each category's total at the top of its column; within a column, rows are grouped by family, one crawler per row with its visit count, and a blank means no traffic. In the AI Crawlers column, the dot on the three-position track shows which journey step that crawler sits at. This figure follows each company's official documentation (checked Oct 14, 2026), which places Applebot, PetalBot, YouBot, and Kagibot under Search Engine Crawlers, the same classification used in the main text. Data period Mar 3, 2026–Oct 8; * marks records counted separately.

How to readFrom left to right are the five traffic categories, with each category's total at the top of its column; within a column, rows are grouped by family, one crawler per row with its visit count, and a blank means no traffic. In the AI Crawlers column, the dot on the three-position track shows which journey step that crawler sits at. This figure follows each company's official documentation (checked Oct 14, 2026), which places Applebot, PetalBot, YouBot, and Kagibot under Search Engine Crawlers, the same classification used in the main text. Data period Mar 3, 2026–Oct 8; * marks records counted separately.

Key Points of This Chapter

ClaimWhy
The Five Marketing Audiences are Humans, Search Engine Crawlers, AI Crawlers, AI Agents, and Automated Bots.Each type visits for a different purpose; only by measuring them separately can you see the marketing value clearly.
Classify AI traffic by function first, then look at the AI Platforms.The same AI platform may run training, indexing, and real-time retrieval at the same time; function says more about what the content is read for.
Visits by AI Agents have been observed, and their scale is still being tracked.AI is moving from “answering” to “acting for customers,” and site visitors are extending from crawlers that read content to AI Agents that carry out tasks. Measured AI Agent Visits have already reached 18.09 million, of which automated browsing accounts for 17.95 million (counted from Aug 26), classified by behavior, and named AI Agents account for 144,000, showing the scale of automated visits.
The Six Optimization Domains are SEO, AIO, AEO, GEO, LLMO, and MEO. SEO builds the search index, AIO focuses on search engine AI Overviews, and AEO gets AI answers to use your content. GEO improves visibility in generative answers, LLMO corresponds to copying back for training, and MEO corresponds to Local Search. AEO and GEO both operate at the answer stage, and AIO is linked to AEO. Building the AI index is the name of an S4 function, not GEO.AI Overviews are also one form of AI answers using content, so AIO is subordinate to AEO. AEO and GEO both operate at the answer stage, so the domains overlap.
AI, search engines, and Automated Bots combined: 105.5 million (since Mar 3; these are platform-scale figures and cannot be compared directly with a single merchant's website). Organic Traffic from Humans: 310,000 (since Aug 26). Requests before Aug 24 may include duplicates.The two figures cover different periods and each shows scale. Content must be acquired before it can support later use, so AI reading is the foundation of marketing.
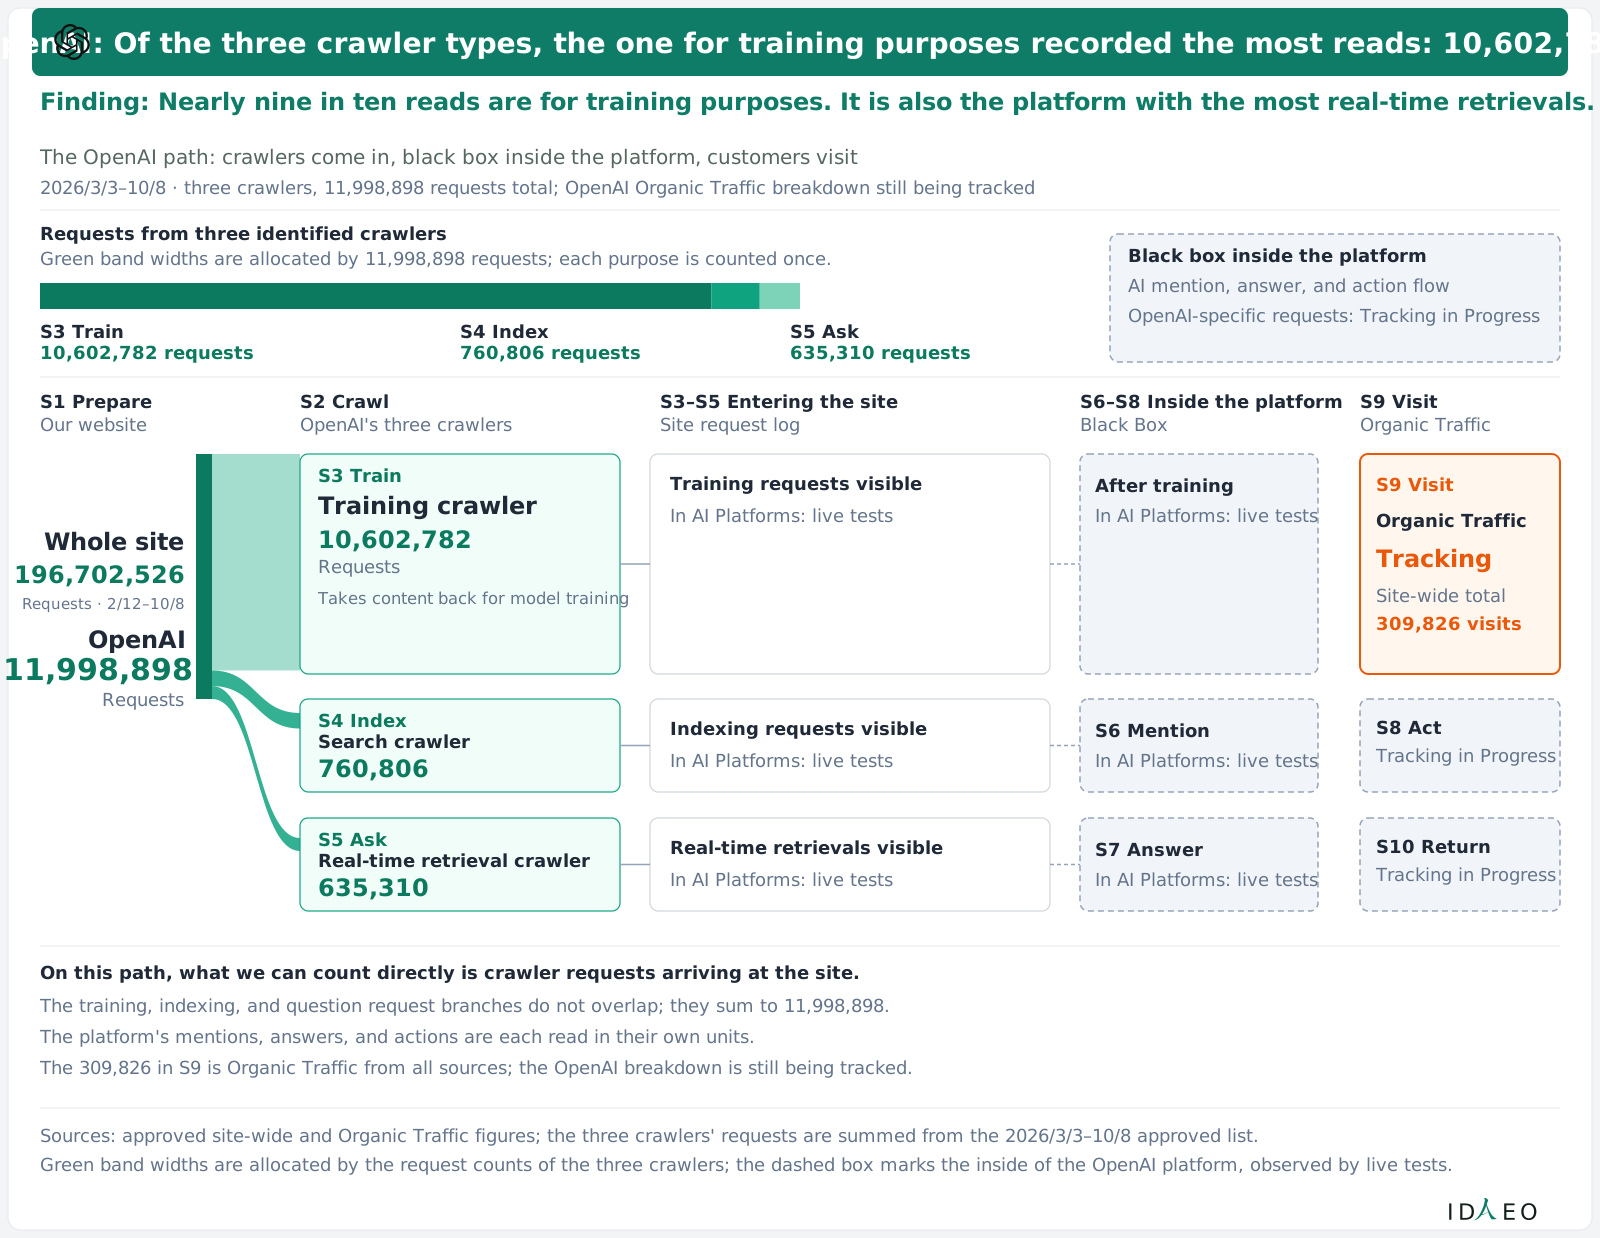
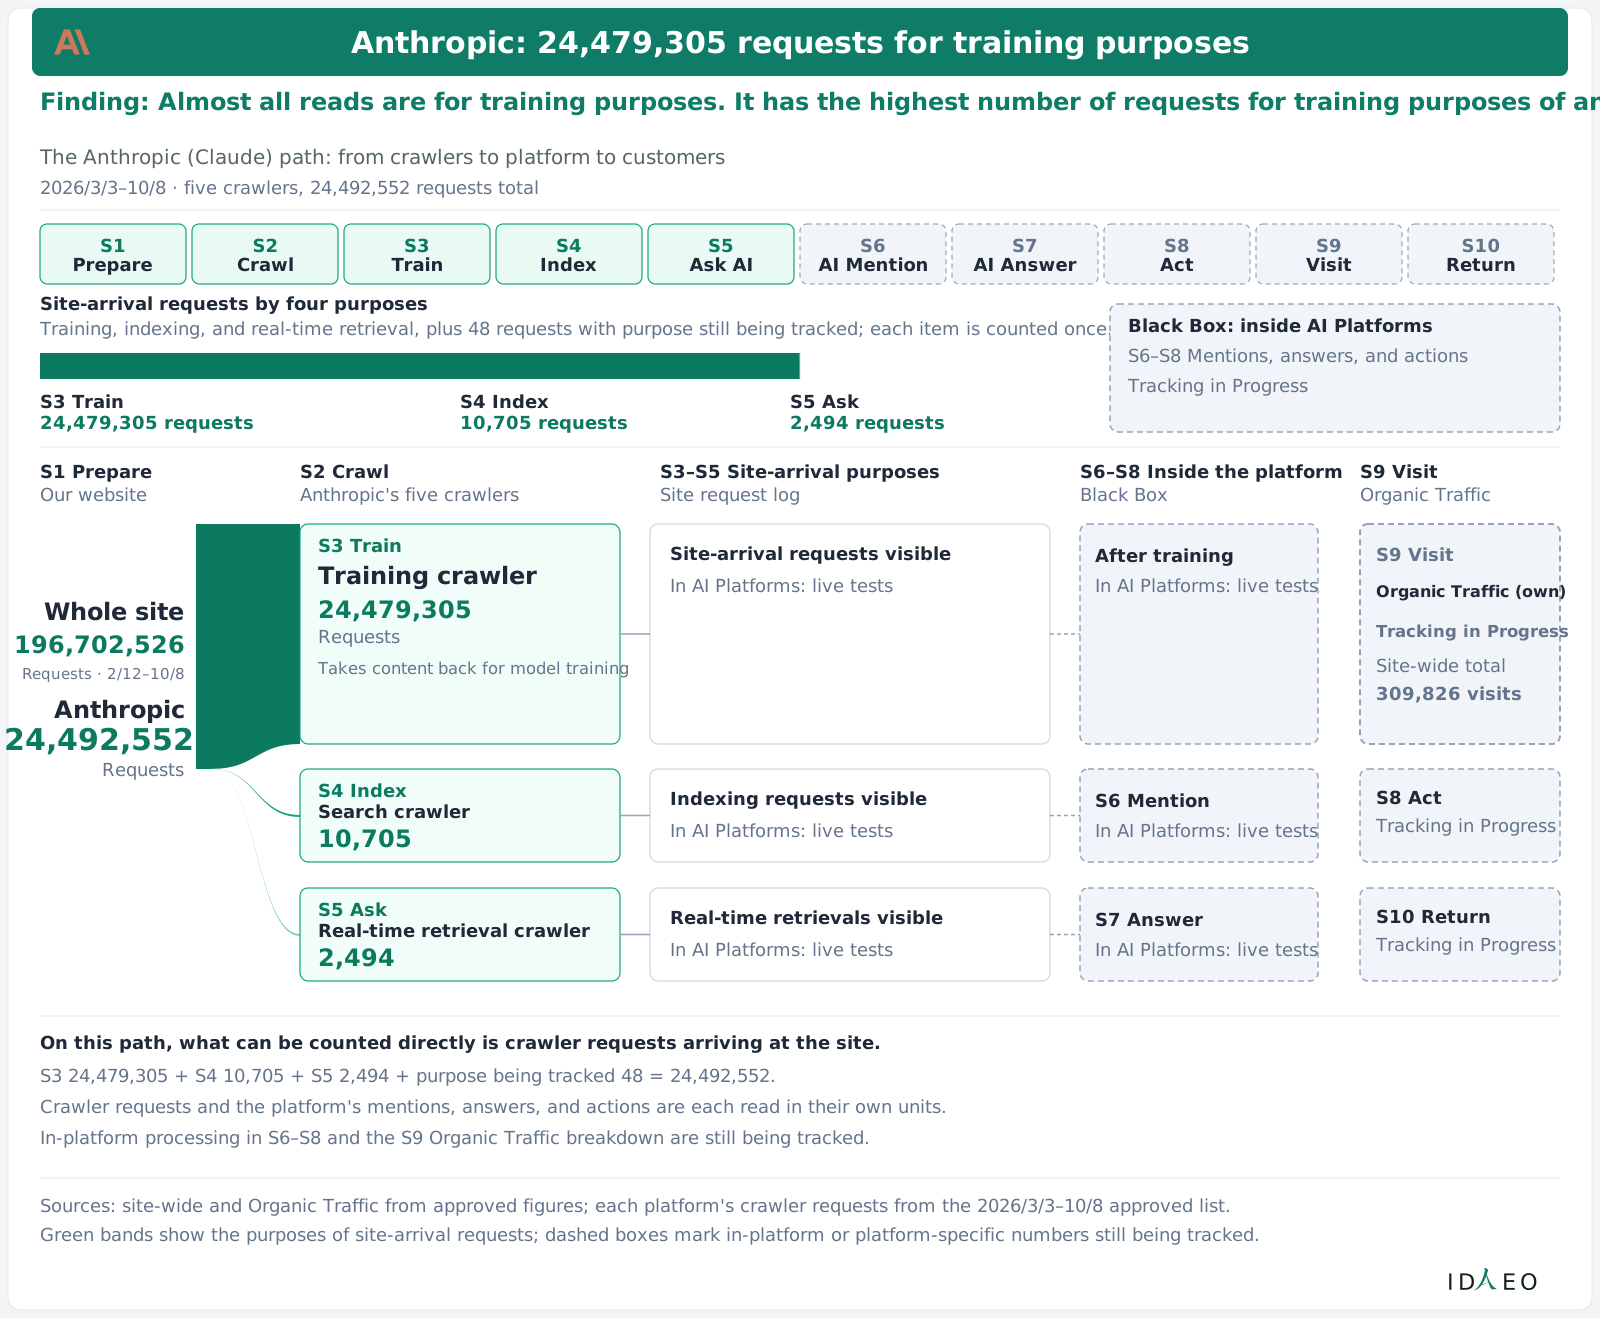
AI Crawlers read content 52.2 million times for training and 3.99 million times for building the AI index (including 2.82 million by the site's own Cloudflare AI Search), and made 650,000 real-time reads.Bulk reads and question-triggered reads serve different purposes, so the counts must be read together with function.
The Optimization Domains in Figure 1-1, “Panorama of the Five Marketing Audiences,” list the abbreviation and its full name, with terms for the same domain listed below.Different common names are gathered in the same cell, so IDAEO Learners can map industry terms back to the same function.

Terms

Five Marketing Audiences
Humans, Search Engine Crawlers, AI Crawlers, AI Agents, and Automated Bots.
Functions
The work each of the Marketing Audiences performs, such as copying back for training, indexing, and real-time retrieval.
AI Agent
AI that acts for customers.
Automated Information Services
Services such as information organization, analysis, and web page previews provided by Automated Bots.
Organic Traffic
The number of times customers click through to the website from search or AI.
Local Search
Customers looking for merchants or services by location and nearby needs.
AIO
In this book, AIO refers only to AI Overview Optimization for search engines. When AIO is used in the market as a general term for AI Optimization, it spans multiple domains. That broader usage cannot be placed entirely under this book's AEO.
Tracking in Progress
IDAEO keeps accumulating measurement results and will publish them later.

FAQ

Q: What kinds of AI Crawlers are there?

A: There are three types by function: copying back for training, building the AI index, and real-time retrieval. Crawling for training is intended to let models accumulate information. Crawling for indexing is intended to bring content into sources for later use. Real-time retrieval responds to a customer's question in the moment. A crawl does not mean the content has been used for training or indexed. Look at the function first, then at which company, because the same AI Platform may do several jobs. For how to tell them apart, see Figure 1-2, “AI Traffic Classification Tree”; for every company and crawler, see Figure 1-3, “AI Platforms and Crawlers Family Tree”; for which companies appear in each of the five traffic categories and how many visits every crawler made, see Figure 1-4, “IDAEO Traffic Atlas.” AI Agents act for customers and are counted separately from AI Crawlers.

Q: What is the difference between AI Crawlers and AI Agents?

A: AI Crawlers mainly acquire information; AI Agents mainly act for customers. Performance is measured separately: the number of times content was acquired, and the results of acting on customers' behalf.

Q: Visits by AI Agents have been observed. Why keep tracking their scale?

A: AI is moving from providing answers to acting on customers' behalf. Customers hand searches, bookings, and other tasks to AI, so the AI that arrives at the site has to understand the information and complete the job; merchant marketing therefore has to support content use and acting on customers' behalf.

Q: Is the industry's AIO the same as IDAEO's AIO?

A: It depends on the usage. In this book, AIO refers only to AI Overview Optimization for search engines. When AIO is used in the market as a general term for AI Optimization, it spans multiple domains. That broader usage cannot be placed entirely under this book's AEO.

Q: How do you decide which category of AI traffic an AI request belongs to?

A: Following Figure 1-2, “AI Traffic Classification Tree,” look at what this visit does: copying back for training, indexing, real-time retrieval, or acting for customers. Function determines the category, because the same AI Platforms may perform several kinds of work.

Q: Why do the 17.95 million automated browsing visits count as AI Agents?

A: This book counts the 17.95 million automated browsing visits as AI Agents and labels them separately as automated browsing. Programs operating a browser show only that execution is automated; they do not prove that a customer requested the task. Classification follows the measured function. Verifiable visits from named AI Agents total 144,000.

Q: Where are the Local Search numbers?

A: Local Search is still being tracked and will be published later; Figure 1-1, “Panorama of the Five Marketing Audiences,” currently lists Organic Traffic. Local Search and Organic Traffic use different statistical definitions, so the results are presented separately.

Q: How does AEO optimization differ from SEO?

A: SEO focuses on search engine indexing and search presentation; AEO gets AI answers to use your content, covers AIO's overview optimization, and supports AI real-time retrieval, AI Agents, and Automated Information Services. Search presentation and AI answers reach people differently, so results must be read together with function.

Q: What do GEO and LLMO each cover?

A: LLMO focuses on model training. A crawler reading content for training does not mean the model has completed training. GEO is the optimization domain that improves content visibility in generative answers, consistent with Aggarwal et al. (2024), cited at the end of the book. Building the AI index is an S4 function. The 3.99 million reads in Figure 1-1 are reported under that function name.

Q: Where do conversion rate optimization and social media optimization go?

A: ASO, CRO, and SMO belong to traditional digital marketing and serve people. This work improves how people reach and choose, and can work alongside the Six Optimization Domains.

Q: Which kind of crawler reads each of the four ways AI mentions you?

A: ① is read by AI Crawlers for training, at S3 Train. ②③④ are read by Search Engine Crawlers and AI Crawlers, at S4 Index and S5 Ask. See Figure 2-5.

This Chapter in Three Sentences

  1. A website has five types of readers, each visiting for a different reason.
  2. When examining AI traffic, first look at what it came to do, then at which company it comes from.
  3. Retrieval only means the content was obtained. It does not mean it was cited or that a customer visited.

Three Things You Can Do This Week

  1. Clearly list your business name, address, opening hours, and services on your website.
  2. Open your website's visitor logs and look separately at visits from Humans, search engines, and AI.
  3. Record AI crawls separately by purpose: training, indexing, and real-time retrieval.

Next ChapterIn the next chapter, you will learn the diagnostic checkpoints for AI crawls, AI mentions, and customer visits.

Self-CheckBased on one record of “someone asked AI, and AI immediately came to read the merchant page,” identify which of the Marketing Audiences it belongs to, its function, and which of the Optimization Domains it maps to, then explain what the merchant must support when AI acts for customers.

Chapter 2

Journey Design (Which Steps to Take): AI Customer Journey: Four Phases, Ten Steps

This chapter answersWhen customers find a merchant through AI, how do the four phases and ten steps connect?

Why it comes hereEach audience has its role; the Customer Journey links these roles into a path that can be diagnosed.

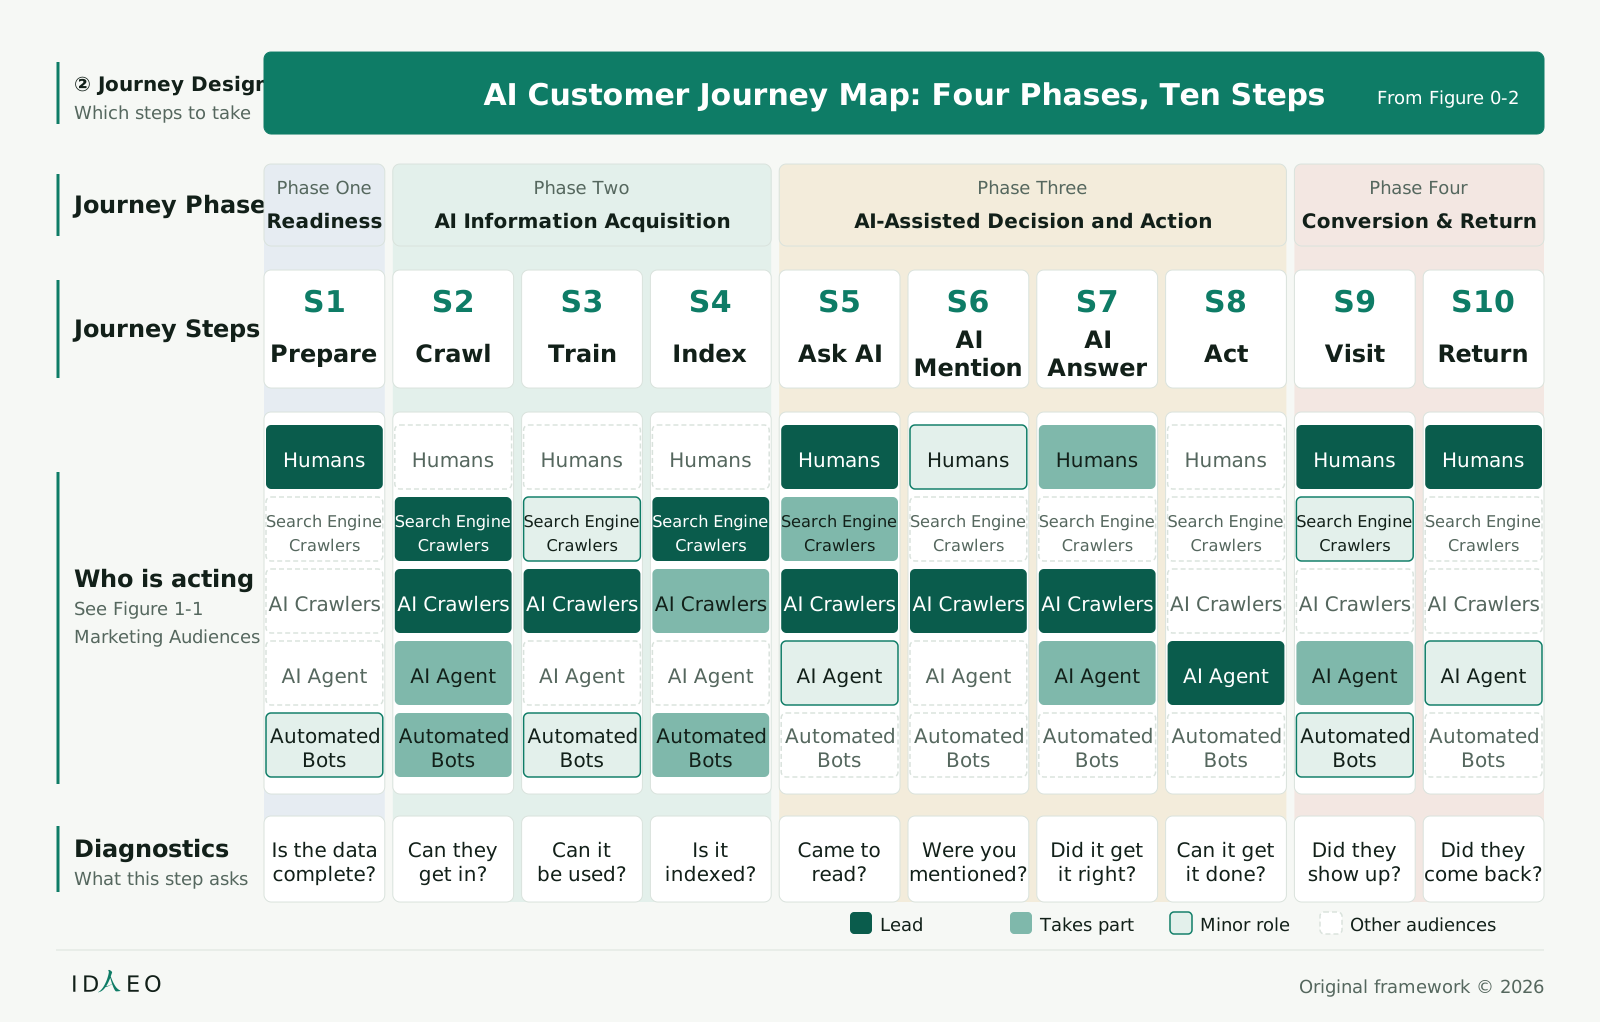
Figure 2-1 AI Customer Journey Map: Four Phases, Ten Steps

Read from top to bottom: journey phases, journey steps, the participation of the Marketing Audiences, and Journey Diagnostics; the same column is the same step, linking each role to its results.

AI Customer Journey Map: Four Phases, Ten Steps AI Customer Journey: Four Phases, Ten Steps, mapped against Marketing Audiences and Journey Diagnostics
Figure 2-1 AI Customer Journey Map: Four Phases, Ten Steps
View as text

Read top to bottom: journey phase, journey step, who is acting, Journey Diagnostics. The five small cells in each step stand for the Five Marketing Audiences in order: dark green is the lead, medium green takes part, light green is slightly involved, and gray is the remaining roles.

② Journey Design
Which steps to take
AI Customer Journey Map: Four Phases, Ten Steps
From Figure 0-2
Journey Phases
Phase One
Readiness
Phase Two
AI Information Acquisition
Phase Three
AI-Assisted Decision and Action
Phase Four
Conversion & Return
Journey Steps
S1
Prepare
S2
Crawl
S3
Train
S4
Index
S5
Ask AI
S6
AIMention
S7
AIAnswer
S8
Act
S9
Visit
S10
Return
Who is acting
See Figure 1-1
Marketing Audiences
Humans
Search EngineCrawlers
AI Crawlers
AI Agent
AutomatedBots
Humans
Search EngineCrawlers
AI Crawlers
AI Agent
AutomatedBots
Humans
Search EngineCrawlers
AI Crawlers
AI Agent
AutomatedBots
Humans
Search EngineCrawlers
AI Crawlers
AI Agent
AutomatedBots
Humans
Search EngineCrawlers
AI Crawlers
AI Agent
AutomatedBots
Humans
Search EngineCrawlers
AI Crawlers
AI Agent
AutomatedBots
Humans
Search EngineCrawlers
AI Crawlers
AI Agent
AutomatedBots
Humans
Search EngineCrawlers
AI Crawlers
AI Agent
AutomatedBots
Humans
Search EngineCrawlers
AI Crawlers
AI Agent
AutomatedBots
Humans
Search EngineCrawlers
AI Crawlers
AI Agent
AutomatedBots
Diagnostics
What this step asks
Is the datacomplete?
Can theyget in?
Can itbe used?
Is itindexed?
Came toread?
Were youmentioned?
Did it getit right?
Can it getit done?
Did theyshow up?
Did theycome back?
Lead
Takes part
Minor role
Other audiences
ID
EO
Original framework © 2026

How to readRead top to bottom: journey phase, journey step, who is acting, Journey Diagnostics. The five small cells in each step stand for the Five Marketing Audiences in order: dark green is the lead, medium green takes part, light green is slightly involved, and gray is the remaining roles.

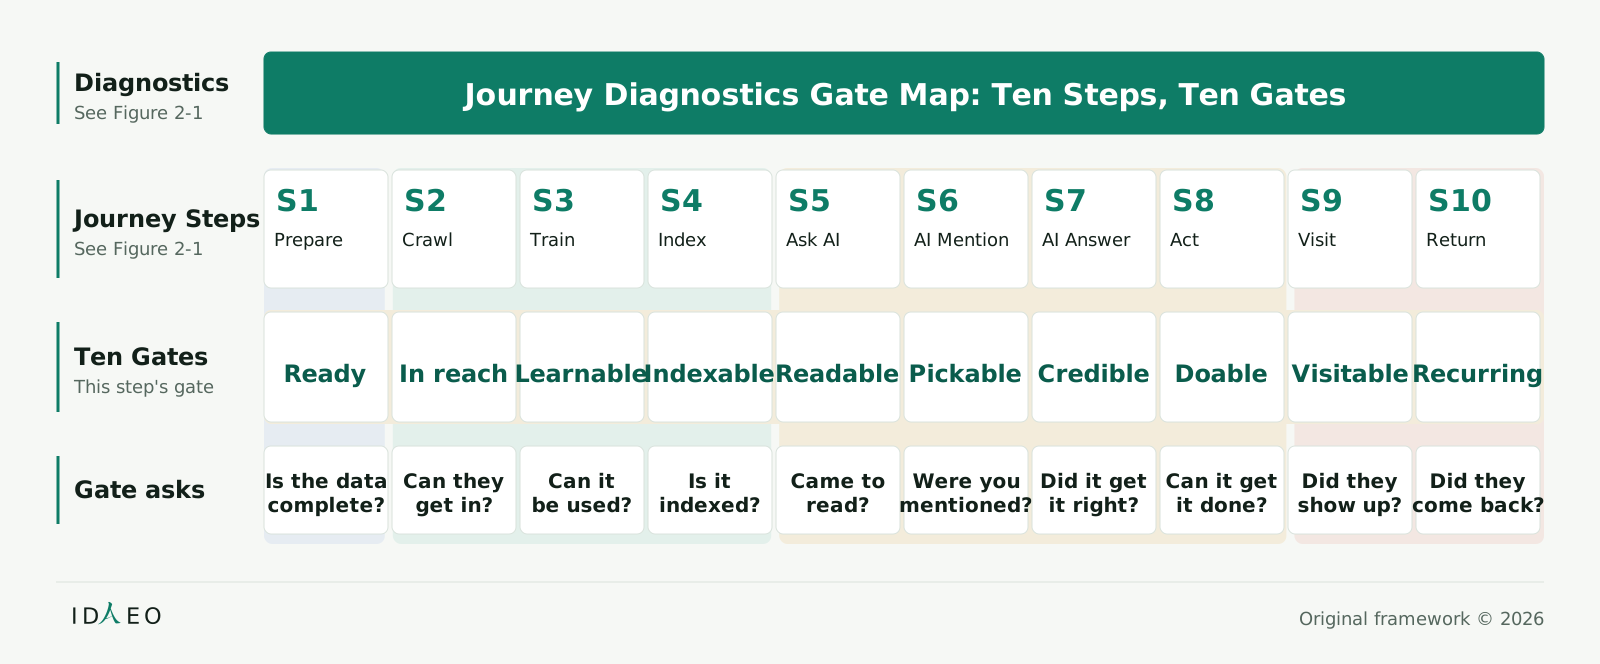
Figure 2-2 Journey Diagnostics Gate Map: Ten Steps, Ten Gates

Below the ten steps, each has one gate and one diagnostic question; each later phase builds on the results of the one before. After S10, the next round starts again from S5. Training authorization at S3 is the merchant's choice, and real-time retrieval at S5 answers immediate questions, so each step is diagnosed by its own function.

Journey Diagnostics Gate Map: Ten Steps, Ten Gates Ten steps and Ten Diagnostic Gates: one gate per step, each with a diagnostic question
Figure 2-2 Journey Diagnostics Gate Map: Ten Steps, Ten Gates
View as text

Read the journey steps left to right; below each are the gate name and diagnostic question.

Diagnostics
See Figure 2-1
Journey Diagnostics Gate Map: Ten Steps, Ten Gates
Journey Steps
See Figure 2-1
S1
Prepare
S2
Crawl
S3
Train
S4
Index
S5
Ask AI
S6
AI Mention
S7
AI Answer
S8
Act
S9
Visit
S10
Return
Ten Gates
This step's gate
Ready
In reach
Learnable
Indexable
Readable
Pickable
Credible
Doable
Visitable
Recurring
Gate asks
Is the datacomplete?
Can theyget in?
Can itbe used?
Is itindexed?
Came toread?
Were youmentioned?
Did it getit right?
Can it getit done?
Did theyshow up?
Did theycome back?
ID
EO
Original framework © 2026

How to readRead the journey steps left to right; below each are the gate name and diagnostic question.

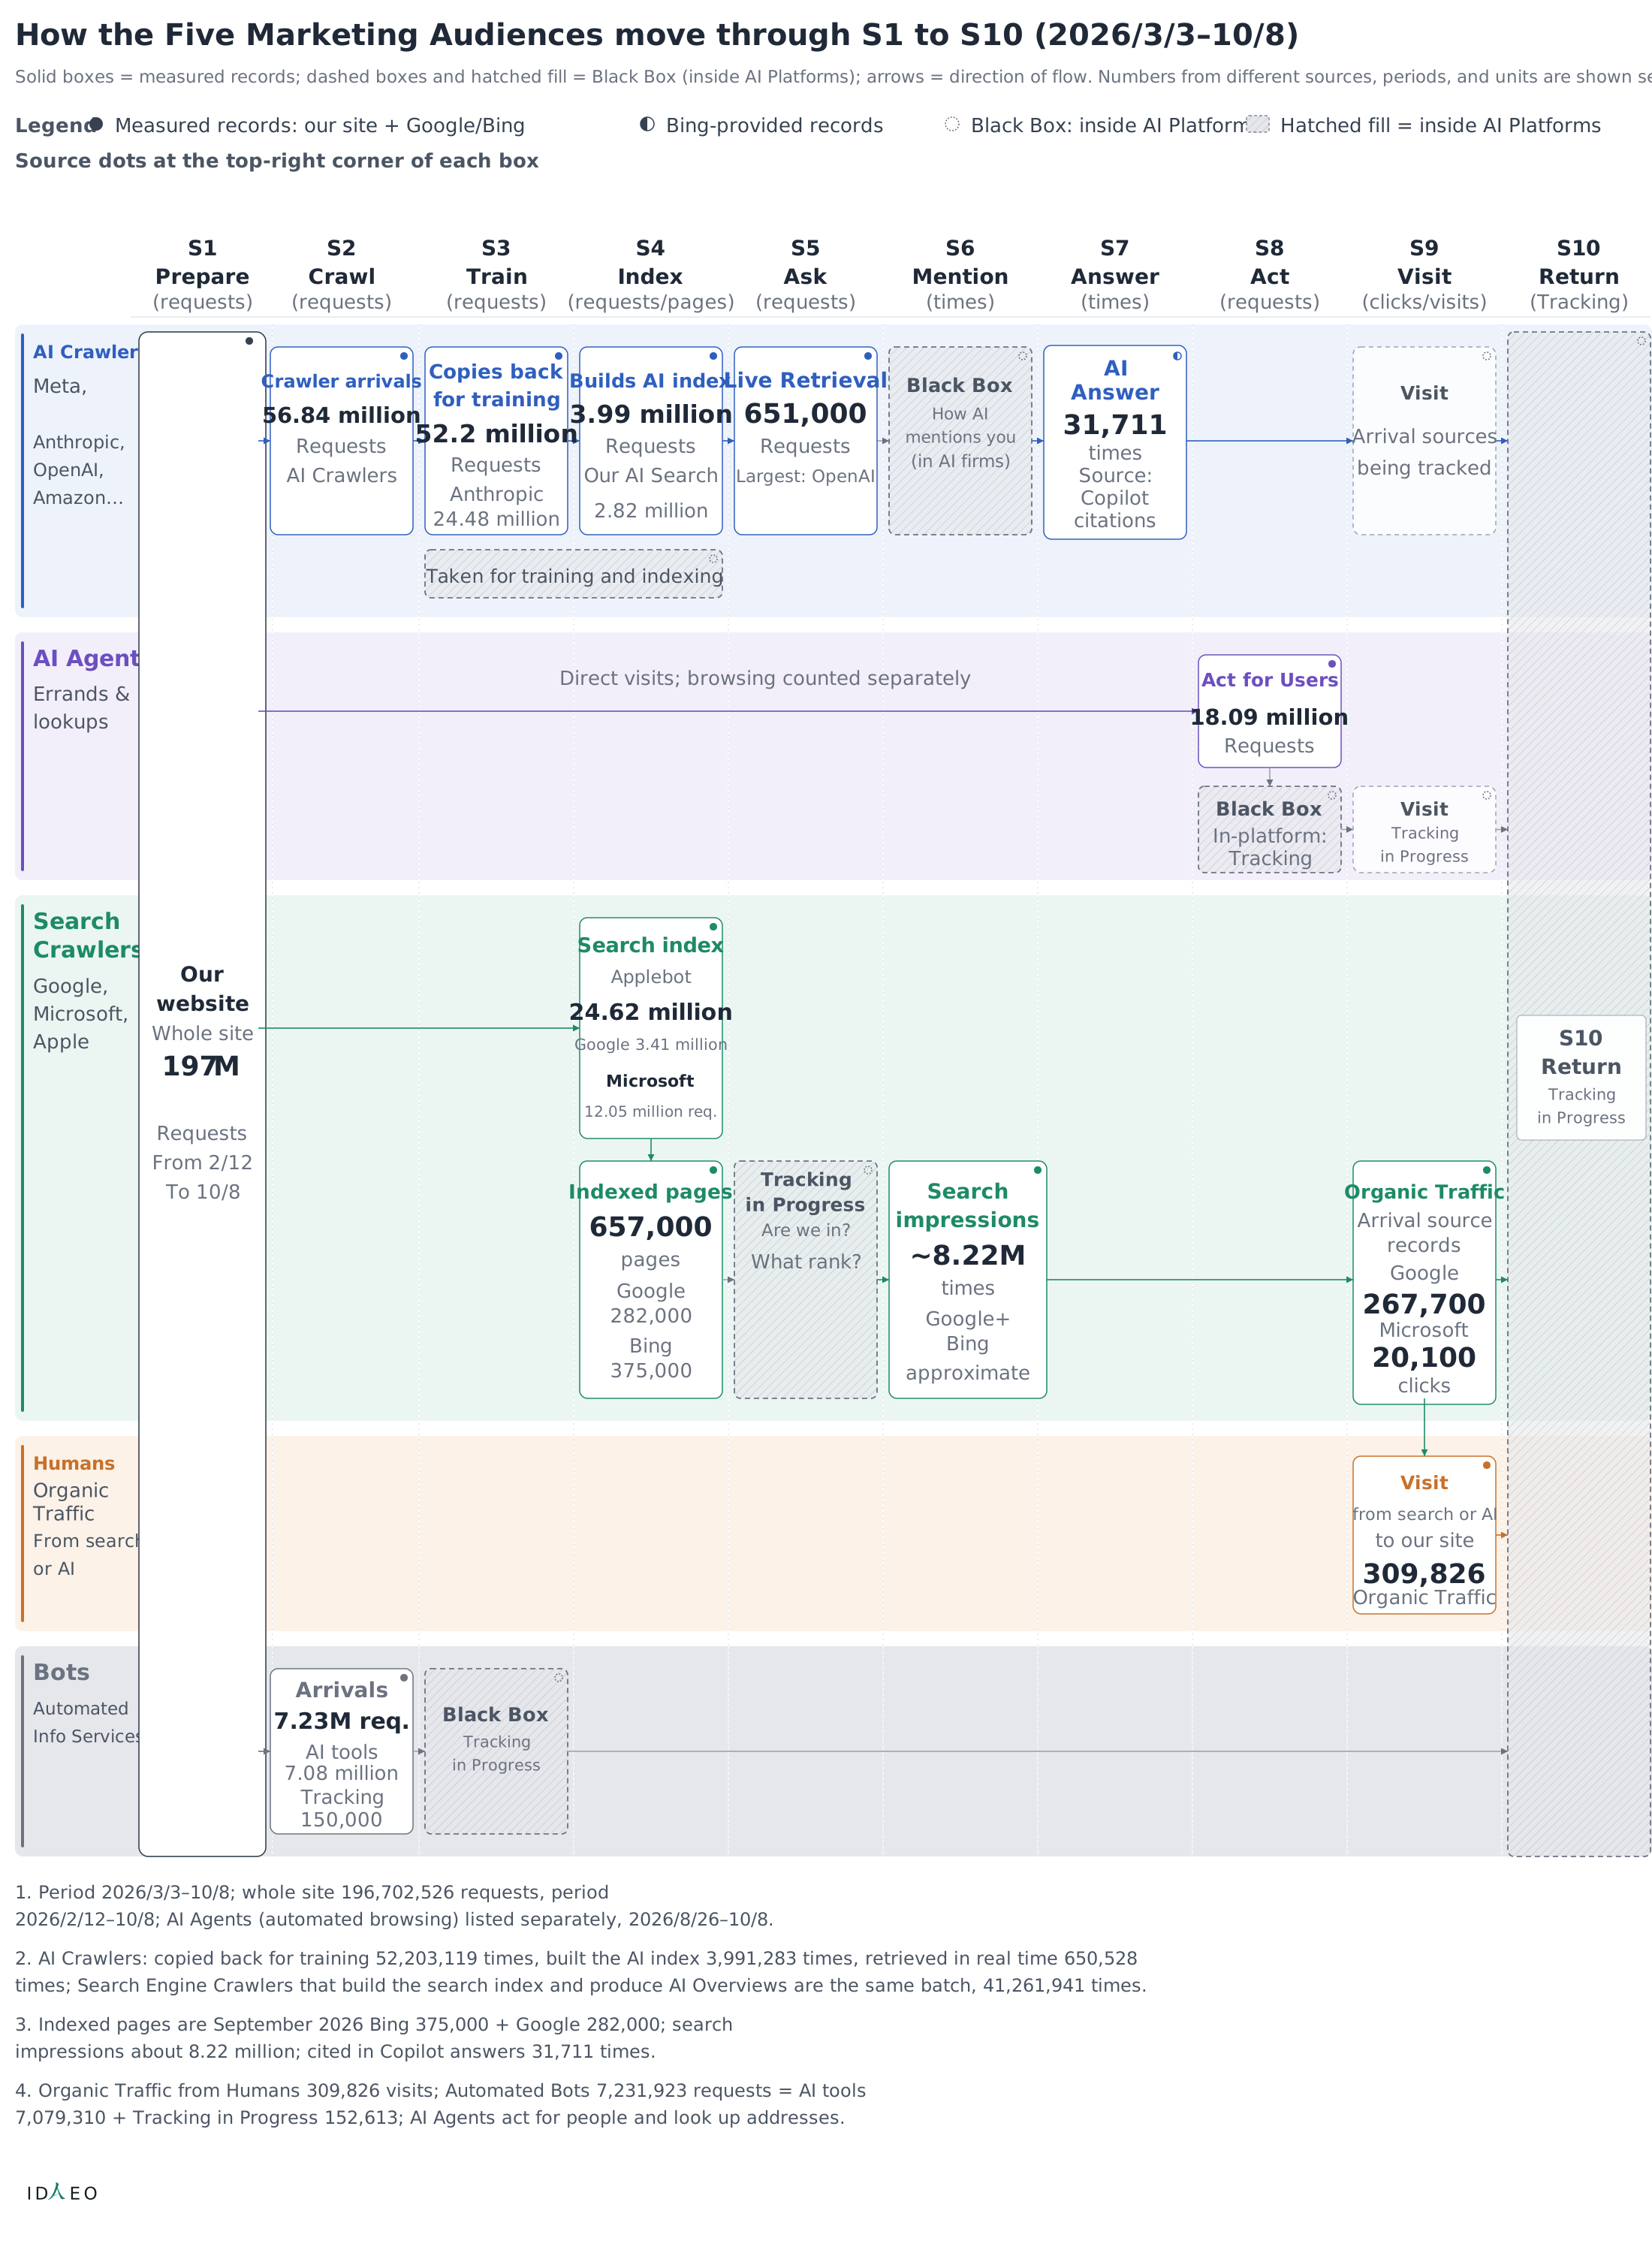
Figure 2-3 Five Marketing Audiences Journey Swimlane Diagram

The steps each of the Five Marketing Audiences passes through, and the scope of measured records at each step.

Five Marketing Audiences Journey Swimlane Diagram How the Five Marketing Audiences move through S1 to S10
Figure 2-3 Five Marketing Audiences Journey Swimlane Diagram
View as text

Each row is one of the Marketing Audiences, with S1–S10 running across; first see which steps it passes through, then the records at each step and the scope of measured tracking.

How the Five Marketing Audiences move through S1 to S10 (2026/3/3–10/8)
Solid boxes = measured records; dashed boxes and hatched fill = Black Box (inside AI Platforms); arrows = direction of flow. Numbers from different sources, periods, and units are shown separately.
Legend
Measured records: our site + Google/Bing
Bing-provided records
Black Box: inside AI Platforms
Hatched fill = inside AI Platforms
Source dots at the top-right corner of each box
S1 Prepare
(requests)
S2 Crawl
(requests)
S3 Train
(requests)
S4 Index
(requests/pages)
S5 Ask
(requests)
S6 Mention
(times)
S7 Answer
(times)
S8 Act
(requests)
S9 Visit
(clicks/visits)
S10 Return
(Tracking)
AI Crawlers
Meta,
Anthropic,
OpenAI,
Amazon…
AI Agent
Errands &
lookups
SearchCrawlers
Google,
Microsoft,
Apple
Humans
OrganicTraffic
From searchor AI
Bots
AutomatedInfo Services
Ourwebsite
Whole site
197M
Requests
From 2/12
To 10/8
Crawler arrivals
56.84 million
Requests
AI Crawlers
Copies backfor training
52.2 million
Requests
Anthropic
24.48 million
Builds AI index
3.99 million
Requests
Our AI Search
2.82 million
Taken for training and indexing
Live Retrieval
651,000
Requests
Largest: OpenAI
Black Box
How AImentions you
(in AI firms)
AIAnswer
31,711
times
Source: Copilot
citations
Visit
Arrival sourcesbeing tracked
Direct visits; browsing counted separately
Act for Users
18.09 million
Requests
Black Box
In-platform:Tracking
Visit
Trackingin Progress
Search index
Applebot
24.62 million
Google 3.41 million
Microsoft
12.05 million req.
Indexed pages
657,000
pages
Google 282,000
Bing 375,000
Trackingin Progress
Are we in?
What rank?
Searchimpressions
~8.22M
times
Google+Bing
approximate
Organic Traffic
Arrival sourcerecords
Google
267,700
Microsoft
20,100
clicks
Visit
from search or AI
to our site
309,826
Organic Traffic
Arrivals
7.23M req.
AI tools7.08 million
Tracking150,000
Black Box
Trackingin Progress
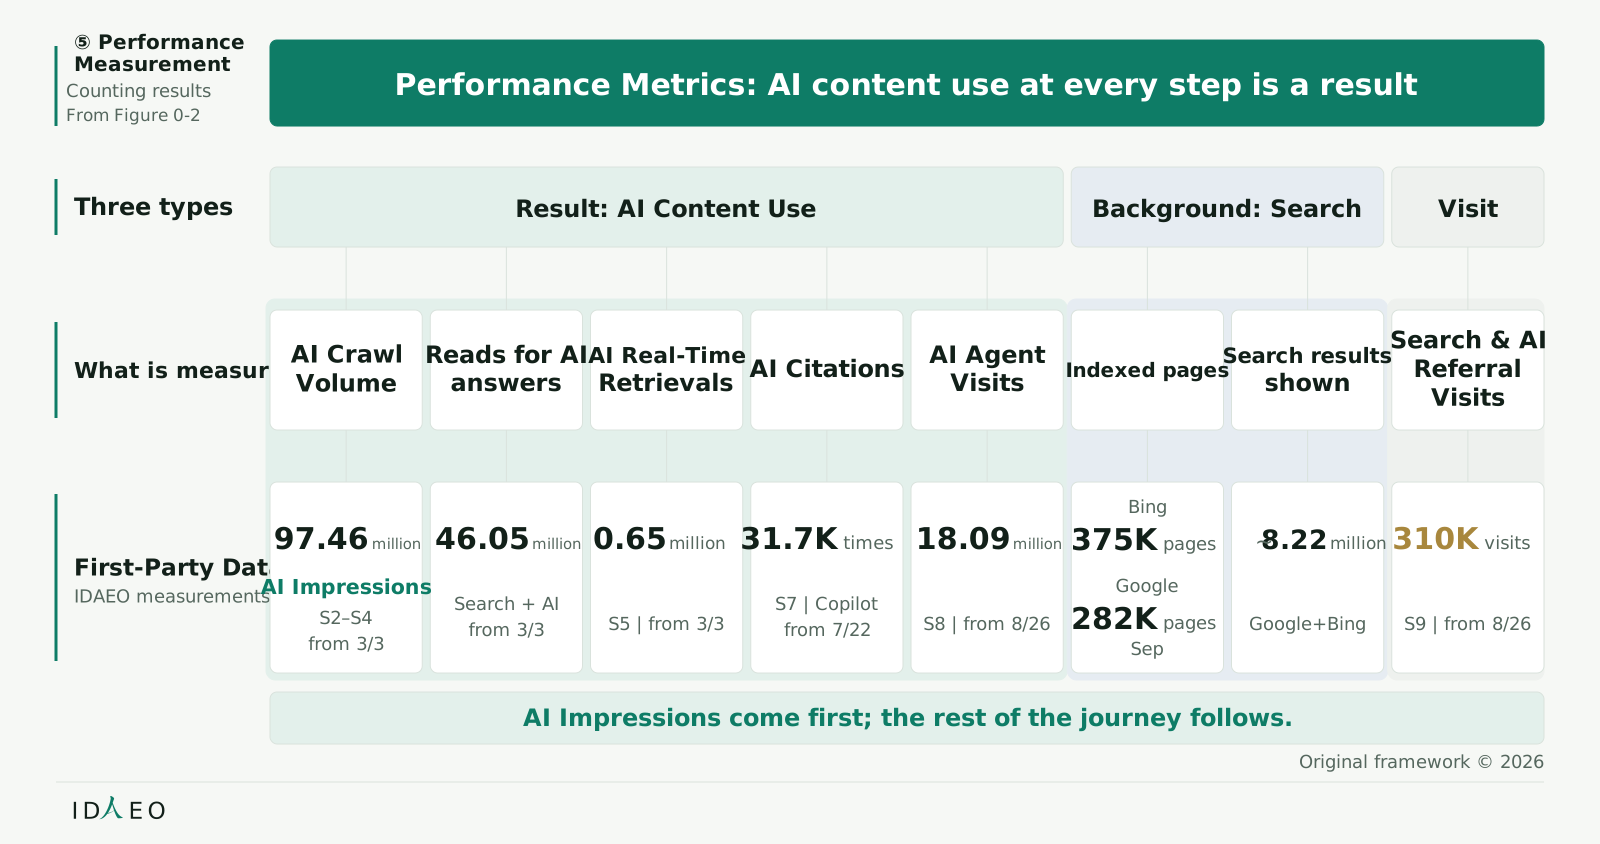
S10 Return
Trackingin Progress
1. Period 2026/3/3–10/8; whole site 196,702,526 requests, period2026/2/12–10/8; AI Agents (automated browsing) listed separately, 2026/8/26–10/8.
2. AI Crawlers: copied back for training 52,203,119 times, built the AI index 3,991,283 times, retrieved in real time 650,528times; Search Engine Crawlers that build the search index and produce AI Overviews are the same batch, 41,261,941 times.
3. Indexed pages are September 2026 Bing 375,000 + Google 282,000; searchimpressions about 8.22 million; cited in Copilot answers 31,711 times.
4. Organic Traffic from Humans 309,826 visits; Automated Bots 7,231,923 requests = AI tools7,079,310 + Tracking in Progress 152,613; AI Agents act for people and look up addresses.
ID
EO

How to readEach row is one of the Marketing Audiences, with S1–S10 running across; first see which steps it passes through, then the records at each step and the scope of measured tracking.

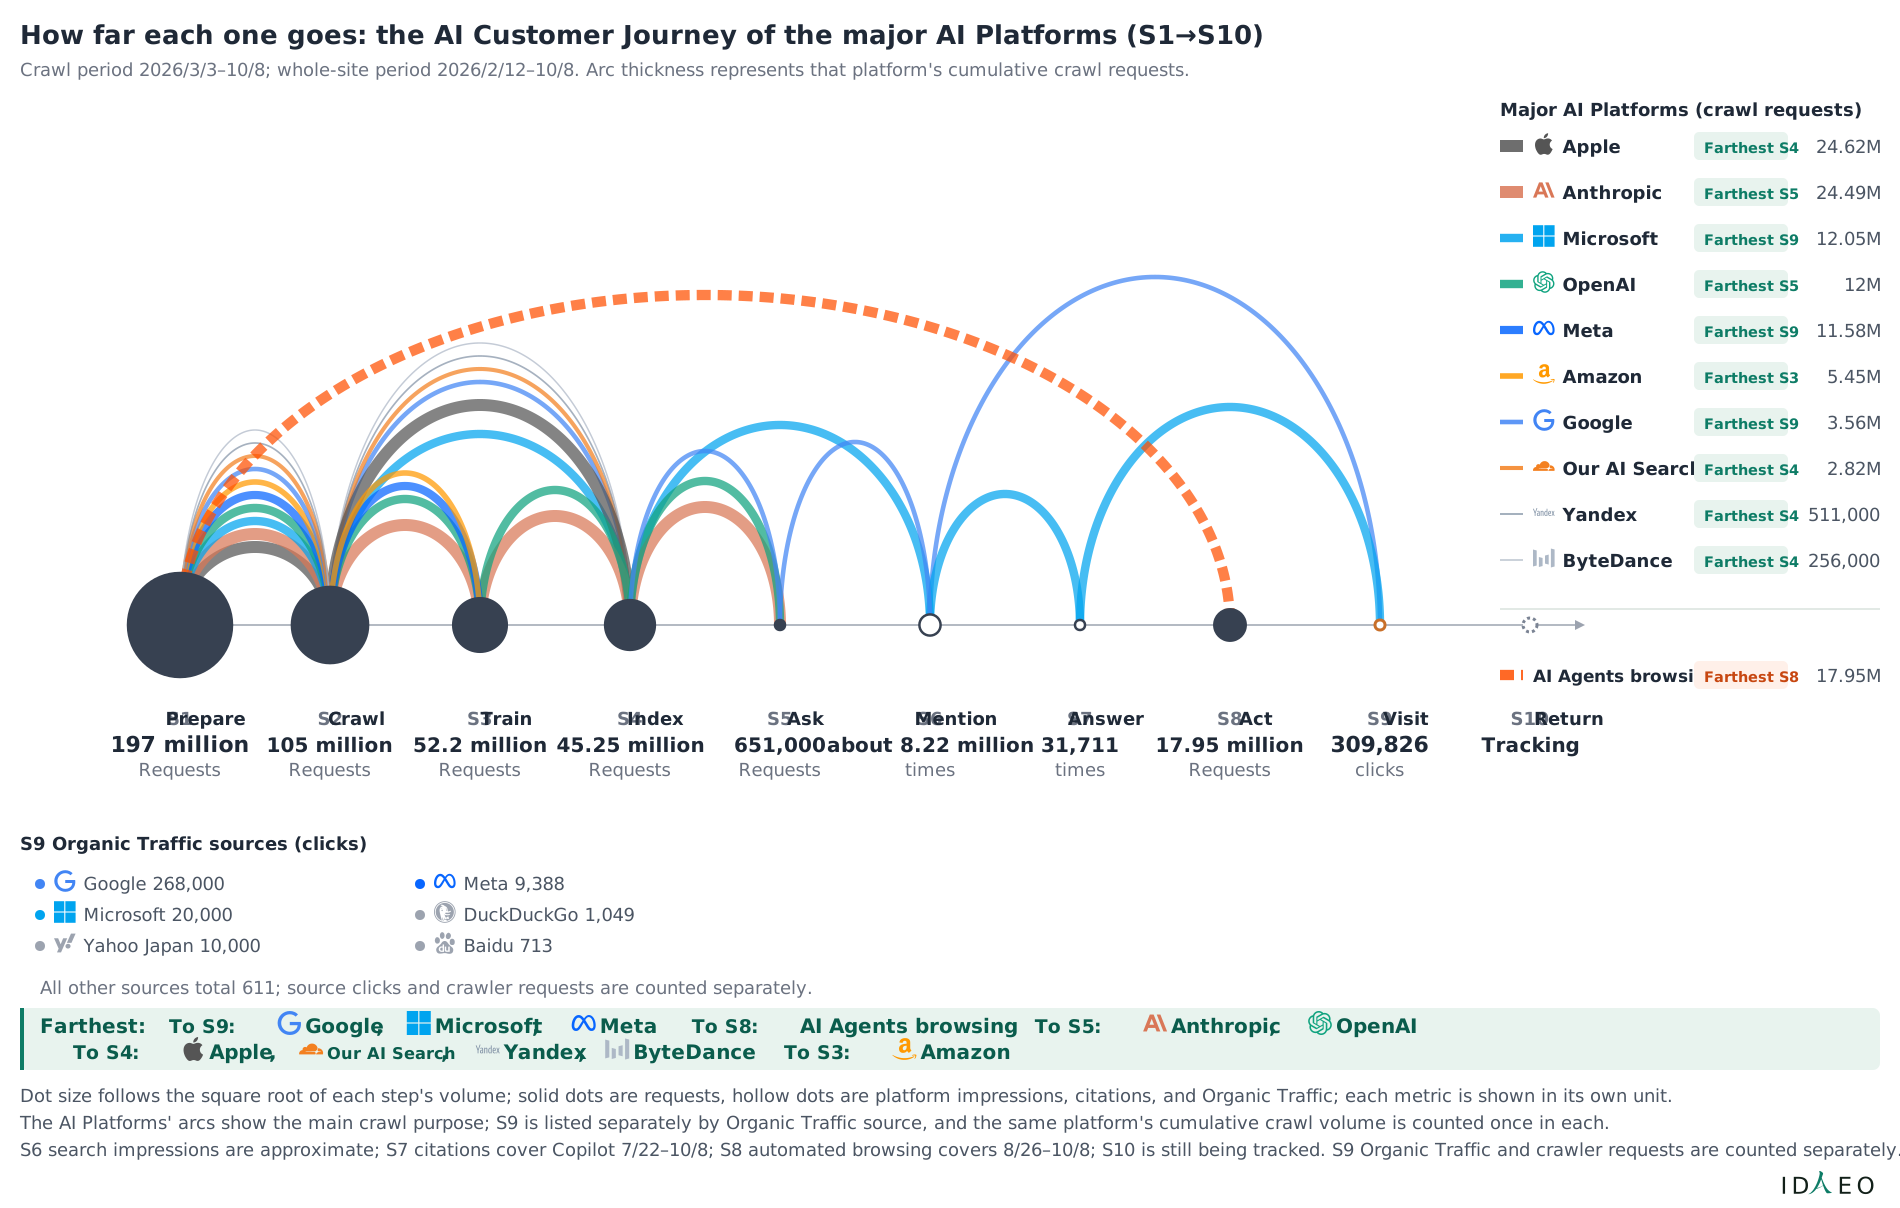
Figure 2-4 Journey Coverage Map of AI Platforms: The Furthest Step Each Has Reached

Journey Coverage Map of AI Platforms: The Furthest Step Each Has Reached Using S1–S10 as a common scale, compare how far each company goes and its farthest step
Figure 2-4 Journey Coverage Map of AI Platforms: The Furthest Step Each Has Reached
View as text

Read the ten steps left to right and follow each company's arc to its end point; the column where it ends is the farthest step this figure shows for each AI platform.

How far each one goes: the AI Customer Journey of the major AI Platforms (S1→S10)
Crawl period 2026/3/3–10/8; whole-site period 2026/2/12–10/8. Arc thickness represents that platform's cumulative crawl requests.
S1 Prepare
197 million
Requests
S2 Crawl
105 million
Requests
S3 Train
52.2 million
Requests
S4 Index
45.25 million
Requests
S5 Ask
651,000
Requests
S6 Mention
about 8.22 million
times
S7 Answer
31,711
times
S8 Act
17.95 million
Requests
S9 Visit
309,826
clicks
S10 Return
Tracking
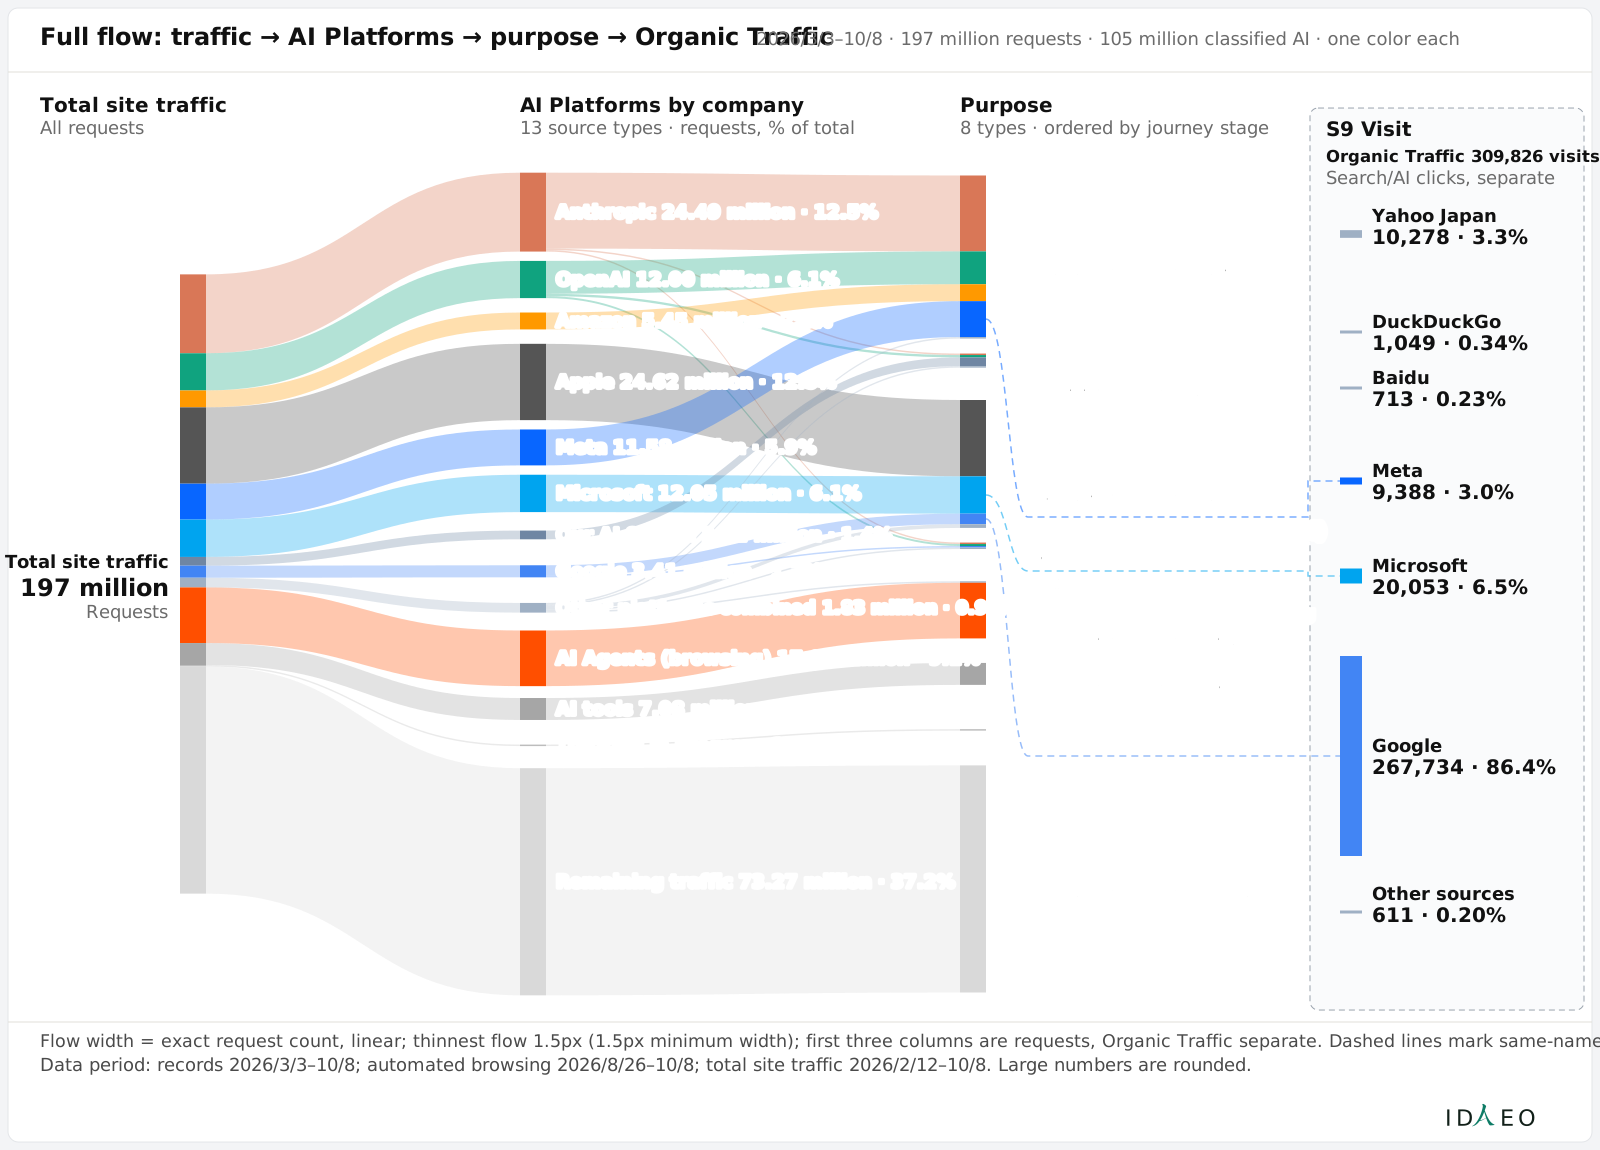
S9 Organic Traffic sources (clicks)
Google 268,000
Microsoft 20,000
Yahoo Japan 10,000
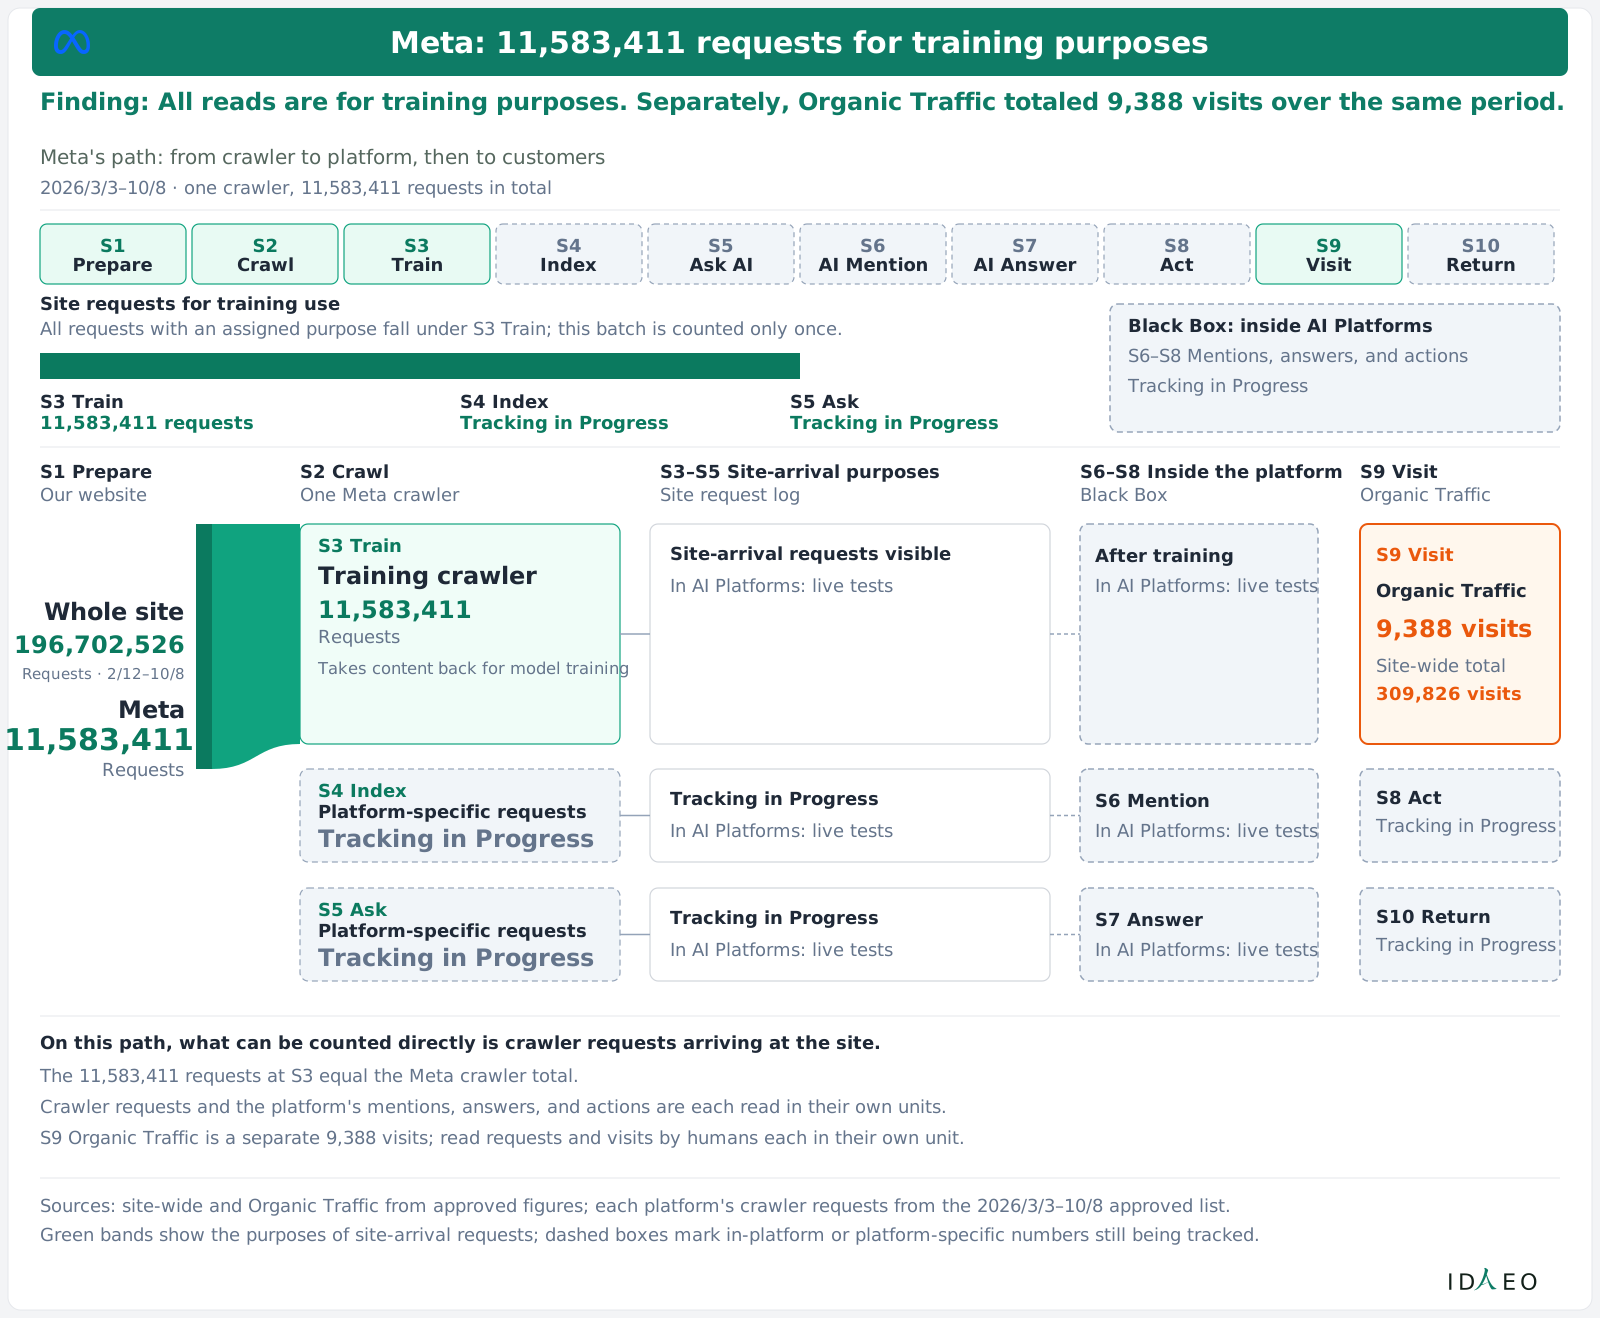
Meta 9,388
DuckDuckGo 1,049
Baidu 713
All other sources total 611; source clicks and crawler requests are counted separately.
Major AI Platforms (crawl requests)
Apple
Farthest S4
24.62M
Anthropic
Farthest S5
24.49M
Microsoft
Farthest S9
12.05M
OpenAI
Farthest S5
12M
Meta
Farthest S9
11.58M
Amazon
Farthest S3
5.45M
Google
Farthest S9
3.56M
Our AI Search
Farthest S4
2.82M
Yandex
Farthest S4
511,000
ByteDance
Farthest S4
256,000
AI Agents browsing
Farthest S8
17.95M
Farthest:
|
To S9
:
Google
,
Microsoft
,
Meta
|
To S8
:
AI Agents browsing
|
To S5
:
Anthropic
,
OpenAI
|
To S4
:
Apple
,
Our AI Search
,
Yandex
,
ByteDance
|
To S3
:
Amazon
Dot size follows the square root of each step's volume; solid dots are requests, hollow dots are platform impressions, citations, and Organic Traffic; each metric is shown in its own unit.
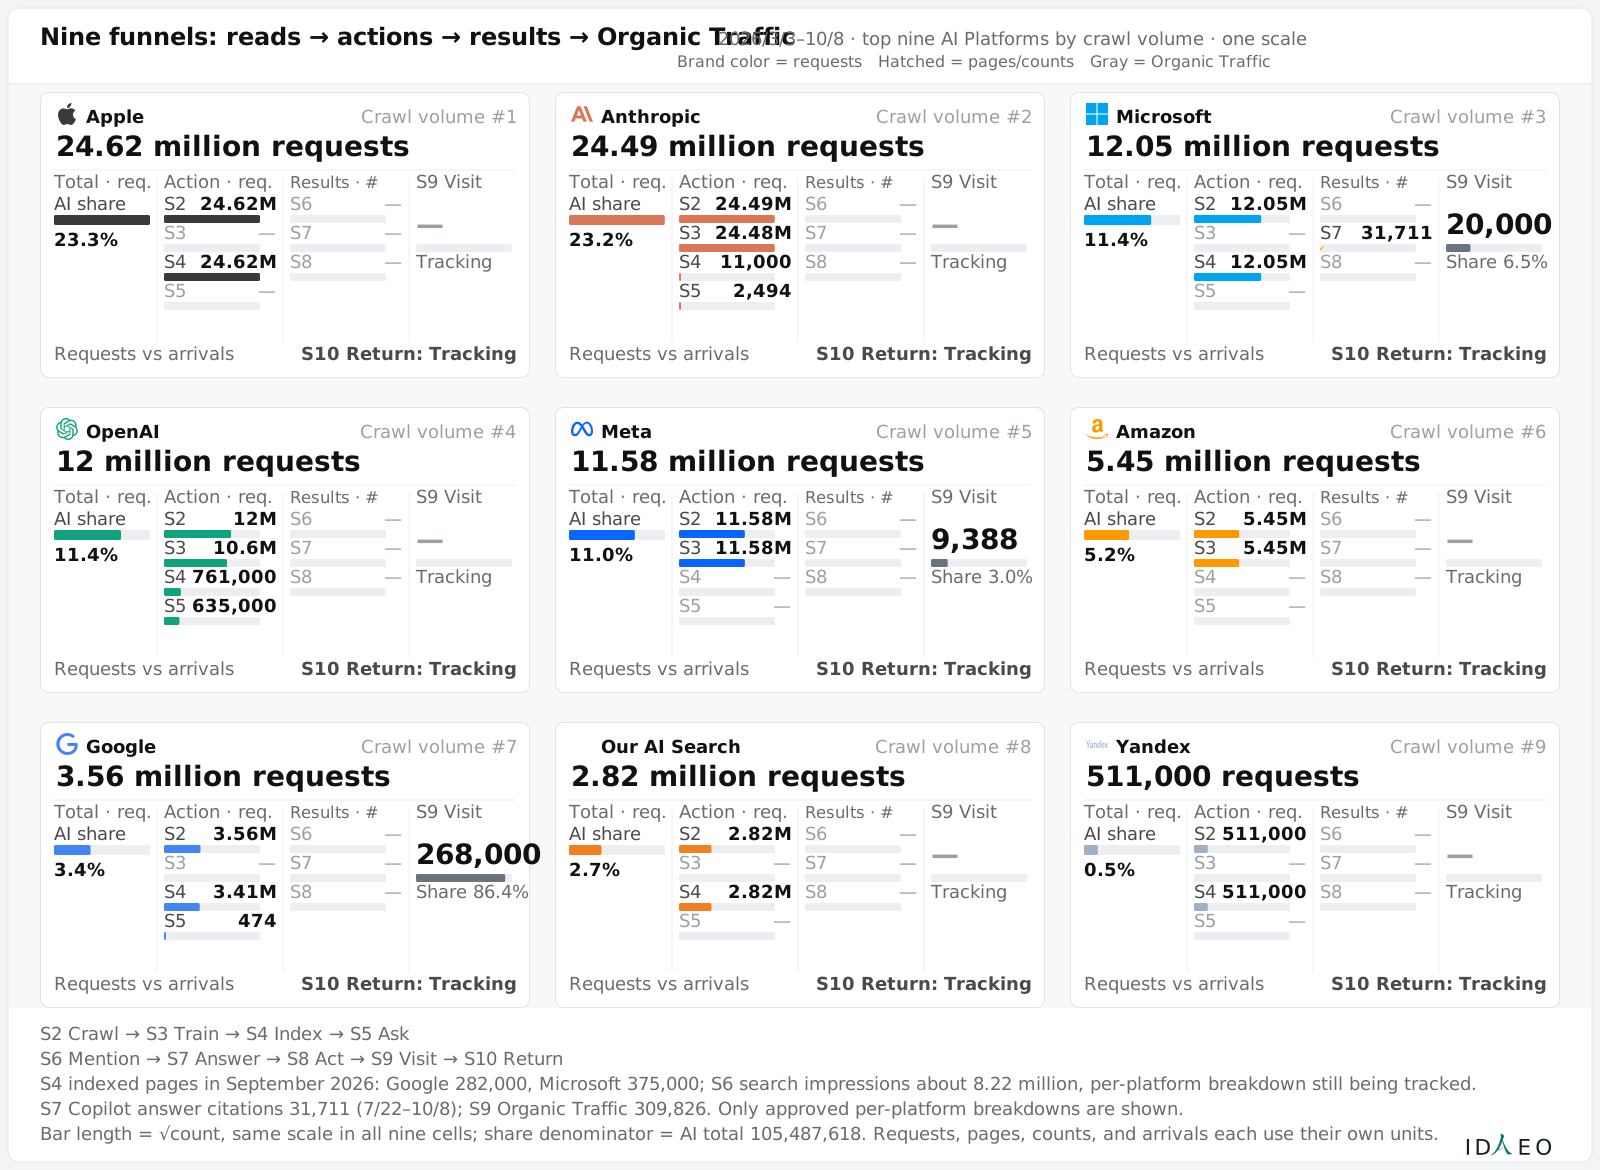
The AI Platforms' arcs show the main crawl purpose; S9 is listed separately by Organic Traffic source, and the same platform's cumulative crawl volume is counted once in each.
S6 search impressions are approximate; S7 citations cover Copilot 7/22–10/8; S8 automated browsing covers 8/26–10/8; S10 is still being tracked. S9 Organic Traffic and crawler requests are counted separately.
ID
EO
Journey Coverage Map of AI Platforms: The Furthest Step Each Has Reached
ItemFarthest:Value
AppleFarthest S424.62M
AnthropicFarthest S524.49M
MicrosoftFarthest S912.05M
OpenAIFarthest S512M
MetaFarthest S911.58M
AmazonFarthest S35.45M
GoogleFarthest S93.56M
Our AI SearchFarthest S42.82M
YandexFarthest S4511,000
ByteDanceFarthest S4256,000
AI Agents browsingFarthest S817.95M
CSV

How to readRead the ten steps left to right and follow each company's arc to its end point; the column where it ends is the farthest step this figure shows for each AI platform.

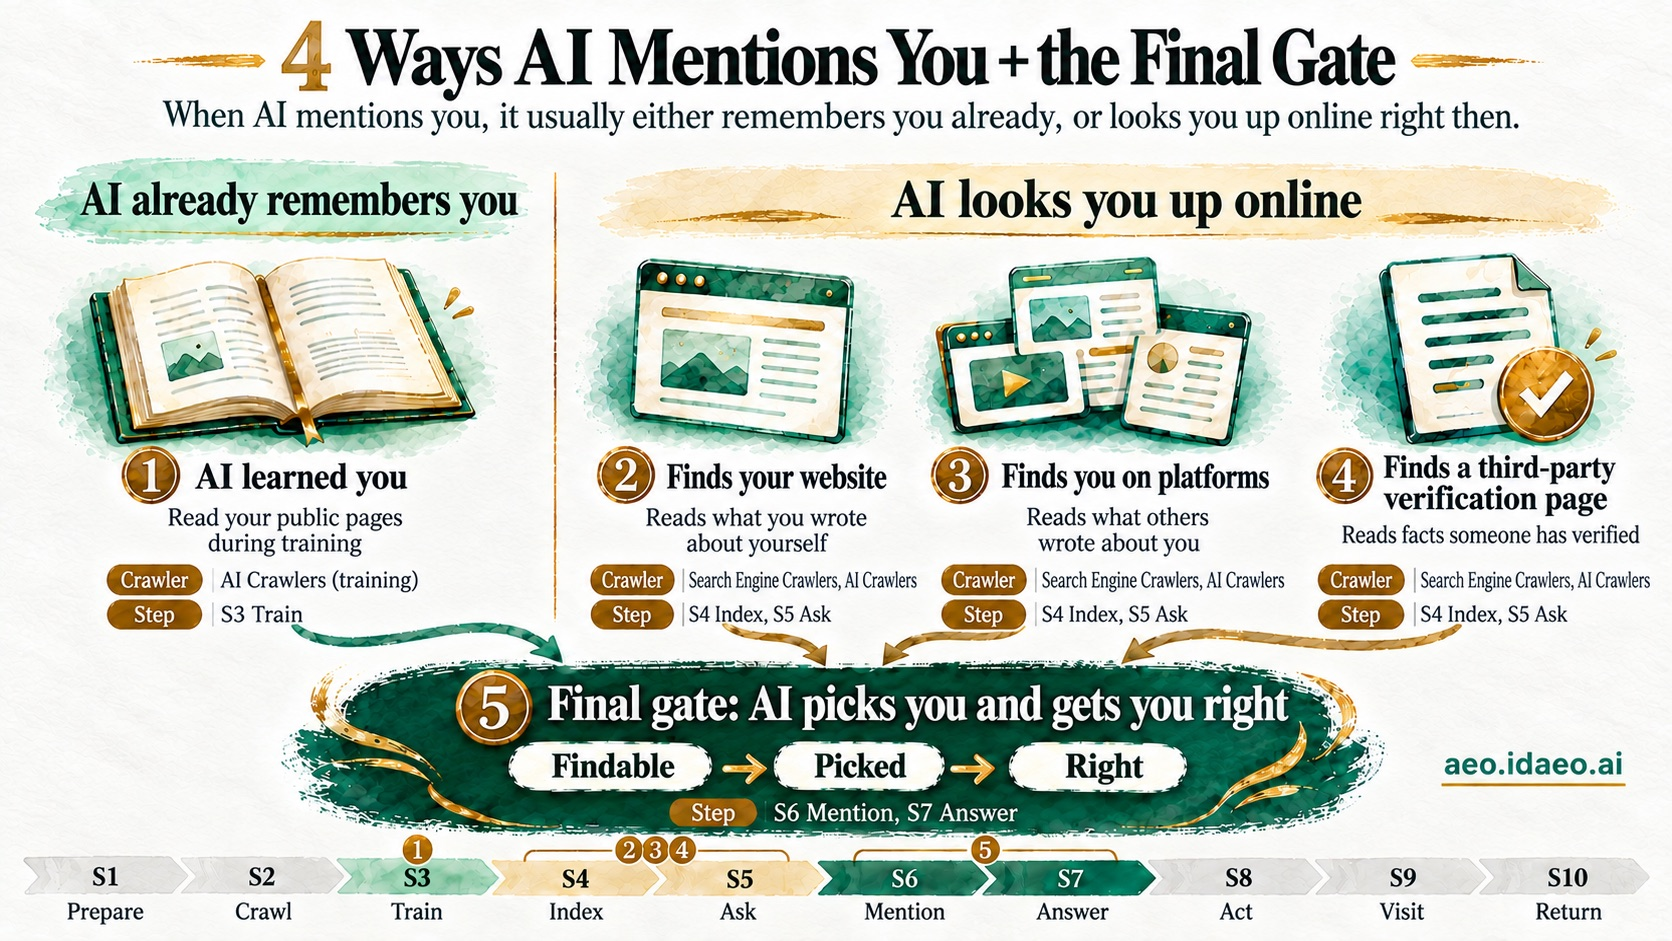
Figure 2-5 4 Ways AI Mentions You + the Final Gate

4 Ways AI Mentions You + the Final Gate The 4 ways AI mentions you, plus the final gate, mapped to S1–S10
Figure 2-5 4 Ways AI Mentions You + the Final Gate
View as text

The top shows the two situations and the four ways, each with its crawler type and step; the colors of the progress bar below match the top: S3 for ①, S4–S5 for ②③④, S6–S7 for ⑤.

4 Ways AI Mentions You + the Final Gate
When AI mentions you, it usually either remembers you already, or looks you up online right then.
AI already remembers you
① AI learned you
Read your public pages during training
Crawler|AI Crawlers (training)
Step|S3 Train
AI looks you up online
② Finds your website
Reads what you wrote about yourself
Crawler|Search Engine Crawlers, AI Crawlers
Step|S4 Index, S5 Ask
③ Finds you on platforms
Reads what others wrote about you
Crawler|Search Engine Crawlers, AI Crawlers
Step|S4 Index, S5 Ask
④ Finds a third-party verification page
Reads facts someone has verified
Crawler|Search Engine Crawlers, AI Crawlers
Step|S4 Index, S5 Ask
⑤ Final gate: AI picks you and gets you right
Findable → Picked → Right
Step|S6 Mention, S7 Answer
S1 Prepare
S2 Crawl
S3 Train
S4 Index
S5 Ask
S6 Mention
S7 Answer
S8 Act
S9 Visit
S10 Return
aeo.idaeo.ai

How to readThe top shows the two situations and the four ways, each with its crawler type and step; the colors of the progress bar below match the top: S3 for ①, S4–S5 for ②③④, S6–S7 for ⑤.

Key Points of This Chapter

ClaimWhy
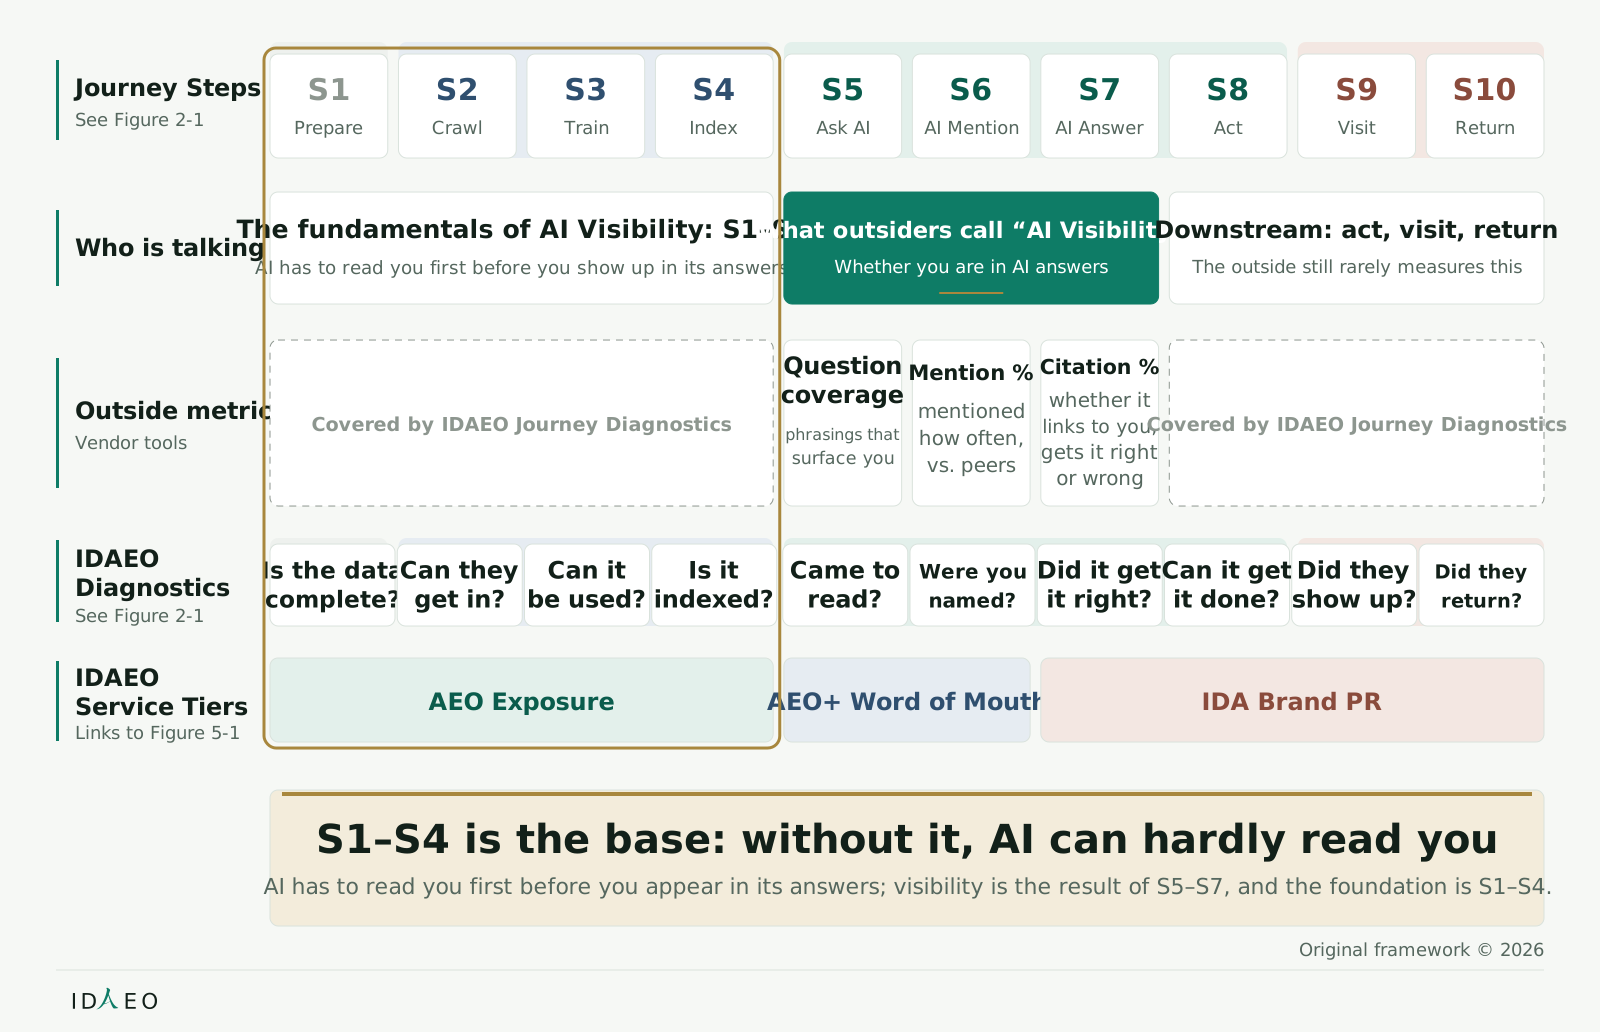
AI Customer Journey: Four Phases, Ten Steps—S1 Merchant Readiness, S2–S4 AI Information Acquisition, S5–S8 AI-Assisted Decision and Action, S9–S10 Customer Conversion and Re-engagement. S1–S10 are diagnostic checkpoints, not a sequence every customer must follow.Preparation in the early phases supports use in the later ones, and the four phases align marketing responsibilities with results. AI Impressions come first; only then does the rest of the journey follow. S2–S4 get content read by AI, building the foundation for the mentions, citations, and customer visits from S5 onward.
Each step has a diagnostic question to check where the merchant is getting stuck.Each step maps to one question, so improvement work has a clear place.
In S1 the merchant prepares its information; S2–S4 are led by crawlers; S5–S7 are human–AI interaction; in S8 AI Agents act; S9–S10 are customer conversion and re-engagement.Each step has a different lead actor and needs different support. S8 moves AI from answering to acting for customers; visits by AI Agents have been observed, and their scale is still being tracked.
S10 loops back to S5, forming a continuous cycle.When the customer raises a need again, the next round of AI-assisted decision-making begins.
Crawls in S2–S5, site arrivals in S8, and customer visits in S9 are measured first-party by IDAEO; indexing and search impressions (not AI mentions) come from search platforms; mentions and answers in S6–S7 are tracked by IDAEO live tests.Each source represents a different touchpoint; the numbers only make sense when placed back in the journey. In the figure, S6 lists search impressions (not AI mentions), meaning the number of times you appear in search results. The mention rate in AI answers will be published later.

Terms

S1–S10
The ten steps are S1 Prepare, S2 Crawl, S3 Train, S4 Index, S5 Ask, S6 Mention, S7 Answer, S8 Act, S9 Visit, and S10 Return. S1–S10 are diagnostic checkpoints, not a sequence every customer must follow. S3 means crawling for training, and S4 means crawling for indexing. Neither confirms that the content has been used for training or indexed.
Journey Phases
Merchant Readiness, AI Information Acquisition, AI-Assisted Decision and Action, and Customer Conversion and Re-engagement.
Ten Diagnostic Gates
Each of the ten steps has its own gate: Ready, Reachable, Learnable, Indexable, Readable, Selectable, Credible, Actionable, Visitable, Returnable.
Journey Diagnostics
Confirm progress and improvement priorities by journey step and performance metrics.

FAQ

Q: How are the four phases divided?

A: By task: Merchant Readiness, AI Information Acquisition, AI-Assisted Decision and Action, and Customer Conversion and Re-engagement. Each phase has a different lead actor and different results; dividing into phases lets you arrange support and verify progress.

Q: Who decides whether to allow S3 Train?

A: The merchant decides training permissions and configures information acquisition paths as needed. Crawling for training, crawling for indexing, and real-time retrieval each have their own function; the merchant can arrange them according to marketing goals.

Q: Is S5 led by people or by AI?

A: In S5, a person raises a need and AI then retrieves the information to answer. Both asking and content use happen at this touchpoint, so journey diagnostics look at demand and retrieval results.

Q: Why is S6 “AI mentions a few merchants”?

A: S6 is the step where a brand enters the customer's consideration set. AI picks relevant merchants within the limited space of an answer; being mentioned is the selection signal.

Q: Are the ten steps a merchant's to-do list?

A: The ten steps describe the full journey of a customer finding a merchant through AI; the merchant's focus is getting S1 ready and supporting later use. S2–S8 involve both AI and the customer, each with its own tasks.

Q: Why is the journey a cycle?

A: Customers still have new needs after making a choice; S10 Return loops back to S5 and starts the next round of AI-assisted decision-making. The customer journey theory in Figure 8-2 (IDAEO Theoretical Foundations Map) covers ongoing contact, and re-engagement is also the starting point of the next round of needs.

Q: What are the ways AI comes to mention you?

A: Roughly two situations. AI already remembers you: ① it previously crawled your public pages for training (S3). AI looks you up online right then: ② your website, ③ you on other platforms, ④ a verification page from a Third-Party Source (S4–S5). All four ways must finally pass S6–S7: AI names you and gets you right. See Figure 2-5.

Q: Which of the four ways should come first?

A: ② Your website is under your own control: first state clearly who you are, what you do, and why you can be trusted. ③ is written by others and ④ is confirmed by a Third-Party Source; these connect to Chapter 4, Trust and Verification.

This Chapter in Three Sentences

  1. The AI Customer Journey has four phases and ten steps. These are diagnostic checkpoints, not a sequence every customer must follow.
  2. There are four routes to an AI mention: content AI read during training, your website, your presence on other platforms, and verification pages from Third-Party Sources.
  3. Each step has a diagnostic question to identify where the merchant is getting stuck.

Three Things You Can Do This Week

  1. Make clear on your website who your business is, what it does, and why it can be trusted.
  2. Check that your business information is correct across platforms and external verification pages.
  3. Work through the diagnostic questions and mark the step where you are currently stuck.

Next ChapterIn the next chapter, you will see actual crawl and site-visit activity from different AI Platforms across the Customer Journey.

Self-CheckA merchant has already been mentioned in S6 and next needs to confirm its business hours are correct; name the corresponding journey phase, journey step, and diagnostic question.

Chapter 3

Measurement Sources and the AI Black Box: The Data Foundation of Performance Measurement

This chapter answersWho provides the numbers for each step, and how is the AI black box measured?

Why it comes hereSort out source, scope, and unit first; only then can you make sense of the results.

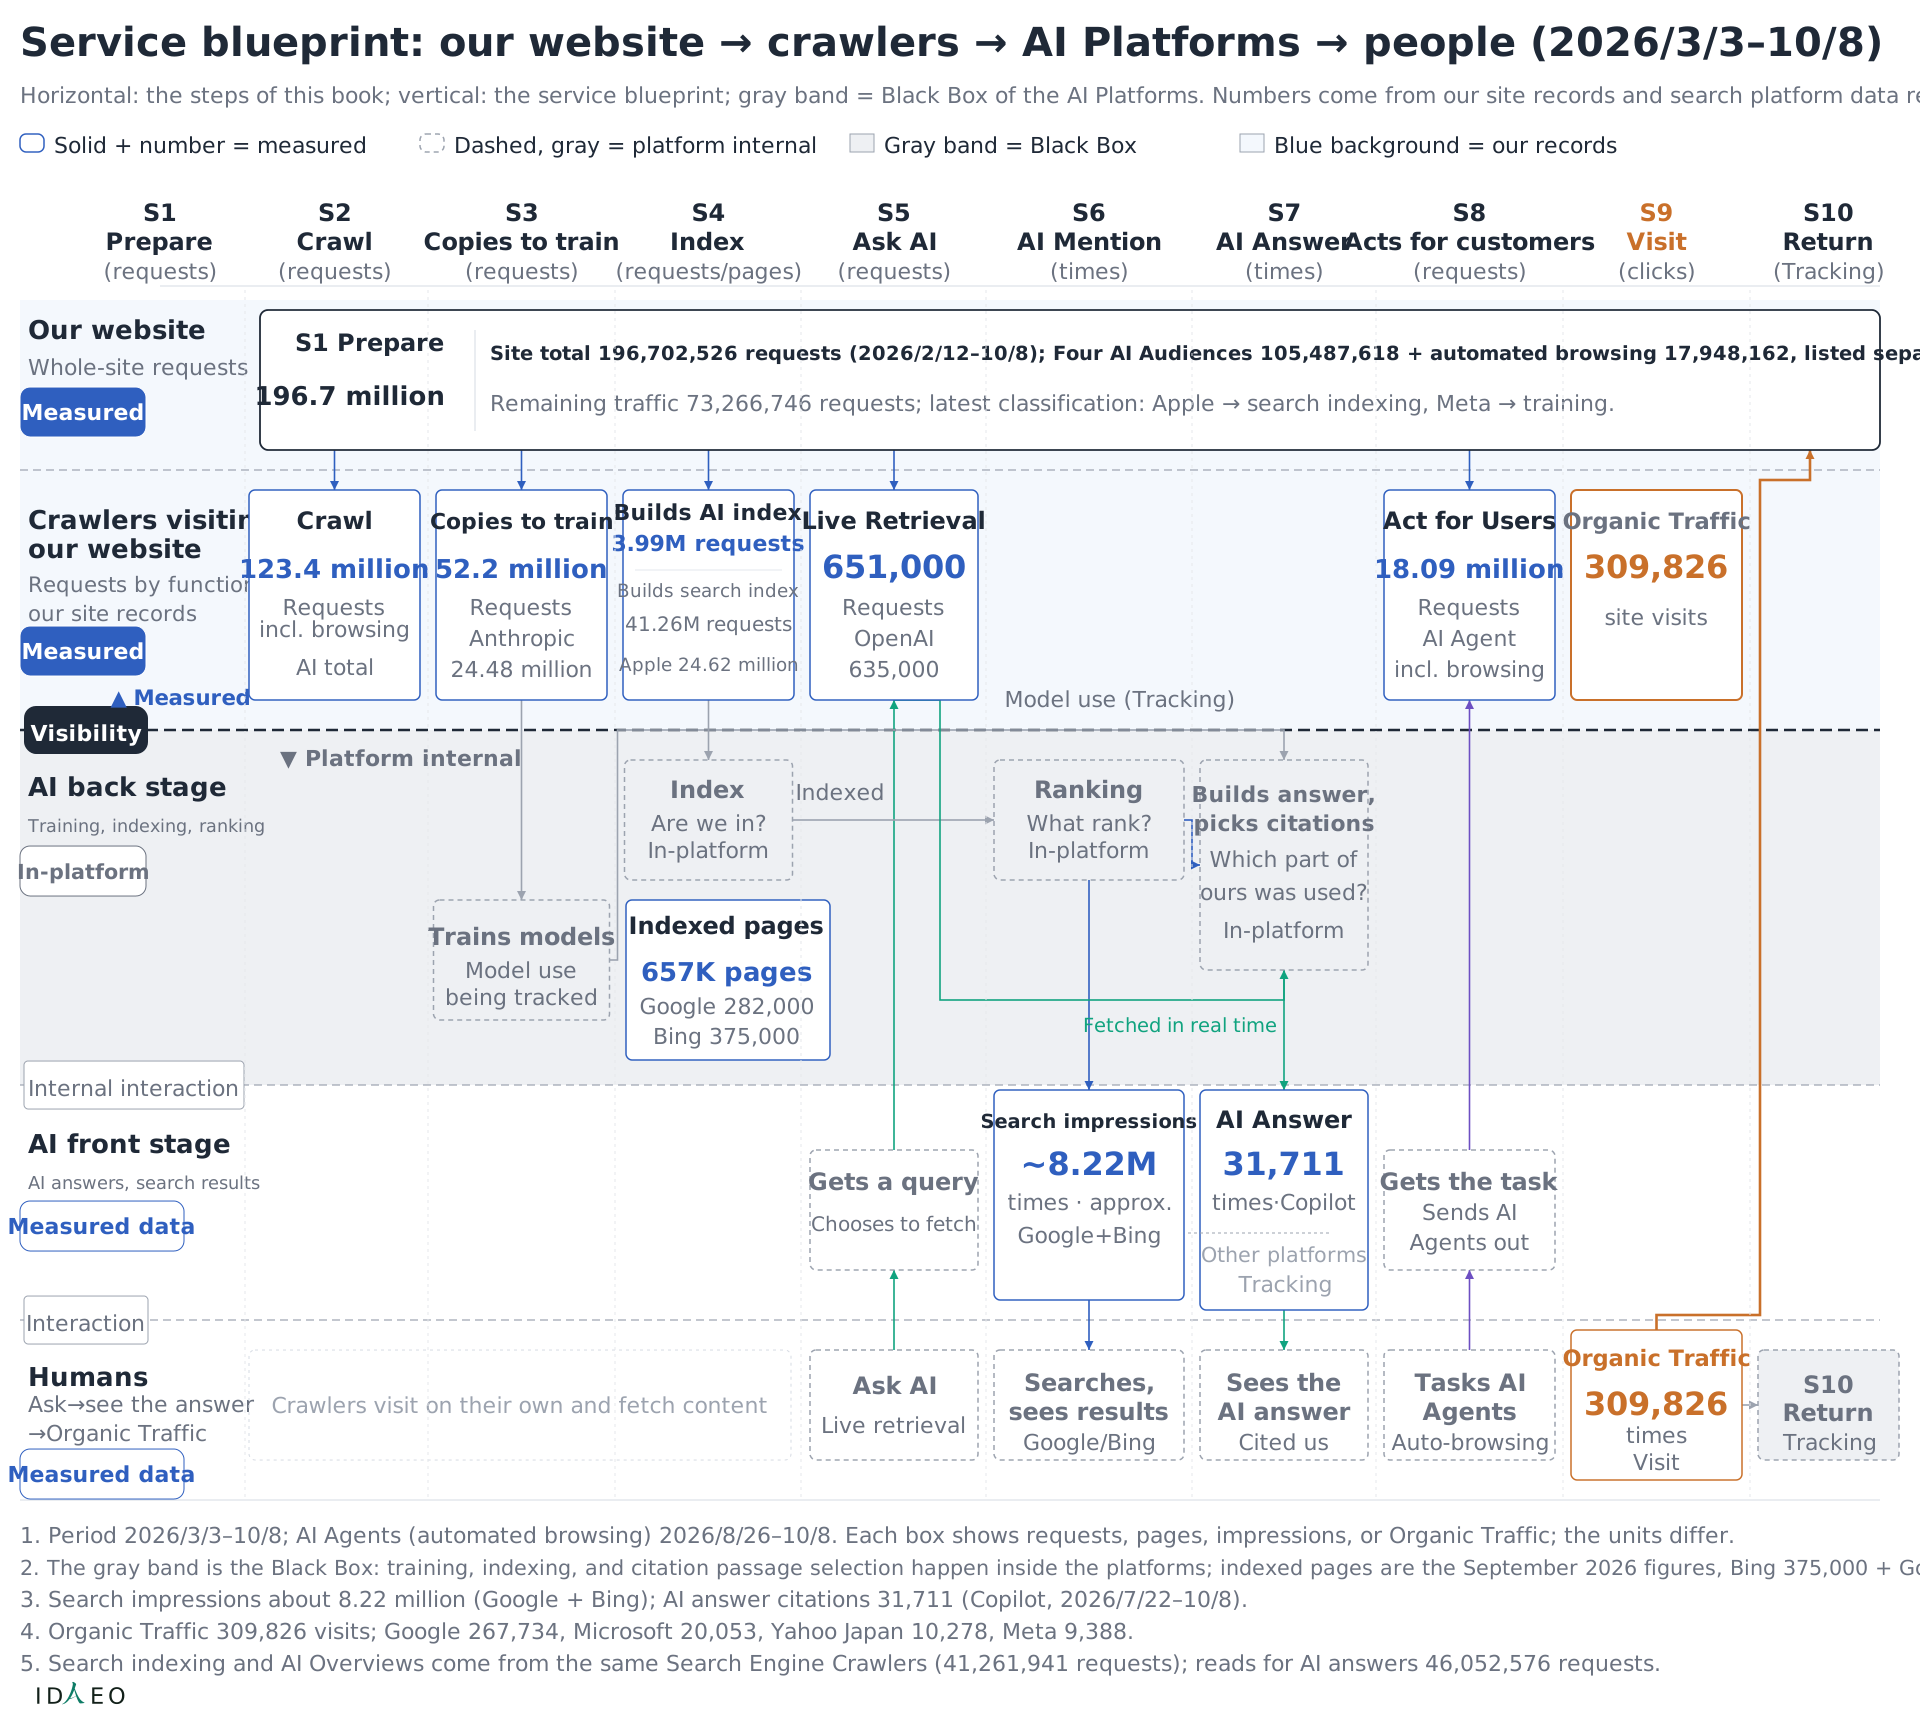
Figure 3-1 IDAEO Measurement Service Blueprint

IDAEO Measurement Service Blueprint Division of measurement among websites, crawlers, the back end and front end of AI platforms, and humans
Figure 3-1 IDAEO Measurement Service Blueprint
View as text

Read from top to bottom, from website to person, and compare each layer's results with the scope of ongoing tracking.

Service blueprint: our website → crawlers → AI Platforms → people (2026/3/3–10/8)
Horizontal: the steps of this book; vertical: the service blueprint; gray band = Black Box of the AI Platforms. Numbers come from our site records and search platform data respectively.
Solid + number = measured
Dashed, gray = platform internal
Gray band = Black Box
Blue background = our records
Interaction
Visibility
Internal interaction
▲ Measured
▼ Platform internal
Humans
Ask→see the answer→Organic Traffic
Measured data
AI front stage
AI answers, search results
Measured data
AI back stage
Training, indexing, ranking
In-platform
Crawlers visitingour website
Requests by function:our site records
Measured
Our website
Whole-site requests
Measured
Crawlers visit on their own and fetch content
Ask AI
Live retrieval
Tasks AIAgents
Auto-browsing
Searches,sees results
Google/Bing
Sees theAI answer
Cited us
Organic Traffic
309,826
times
Visit
Gets a query
Chooses to fetch
Gets the task
Sends AIAgents out
Search impressions
~8.22M
times · approx.
Google+Bing
AI Answer
31,711
times·Copilot
Other platforms
Tracking
Index
Are we in?
In-platform
Indexed pages
657K pages
Google 282,000
Bing 375,000
Ranking
What rank?
In-platform
Trains models
Model usebeing tracked
Builds answer,picks citations
Which part ofours was used?
In-platform
Crawl
123.4 million
Requests
incl. browsing
AI total
Copies to train
52.2 million
Requests
Anthropic
24.48 million
Builds AI index
3.99M requests
Builds search index
41.26M requests
Apple 24.62 million
Live Retrieval
651,000
Requests
OpenAI
635,000
Act for Users
18.09 million
Requests
AI Agent
incl. browsing
Organic Traffic
309,826
site visits
S1 Prepare
196.7 million
Site total 196,702,526 requests (2026/2/12–10/8); Four AI Audiences 105,487,618 + automated browsing 17,948,162, listed separately.
Remaining traffic 73,266,746 requests; latest classification: Apple → search indexing, Meta → training.
1. Period 2026/3/3–10/8; AI Agents (automated browsing) 2026/8/26–10/8. Each box shows requests, pages, impressions, or Organic Traffic; the units differ.
2. The gray band is the Black Box: training, indexing, and citation passage selection happen inside the platforms; indexed pages are the September 2026 figures, Bing 375,000 + Google 282,000.
3. Search impressions about 8.22 million (Google + Bing); AI answer citations 31,711 (Copilot, 2026/7/22–10/8).
4. Organic Traffic 309,826 visits; Google 267,734, Microsoft 20,053, Yahoo Japan 10,278, Meta 9,388.
5. Search indexing and AI Overviews come from the same Search Engine Crawlers (41,261,941 requests); reads for AI answers 46,052,576 requests.
S1
(requests)
S2
(requests)
S3
(requests)
S4
(requests/pages)
S5
(requests)
S6
(times)
S7
(times)
S8
(requests)
S9
(clicks)
S10
(Tracking)
S10 Return
Tracking
Indexed
Model use (Tracking)
Fetched in real time
ID
EO
Prepare
Crawl
Copies to train
Index
Ask AI
AI Mention
AI Answer
Acts for customers
Visit
Return

How to readRead from top to bottom, from website to person, and compare each layer's results with the scope of ongoing tracking.

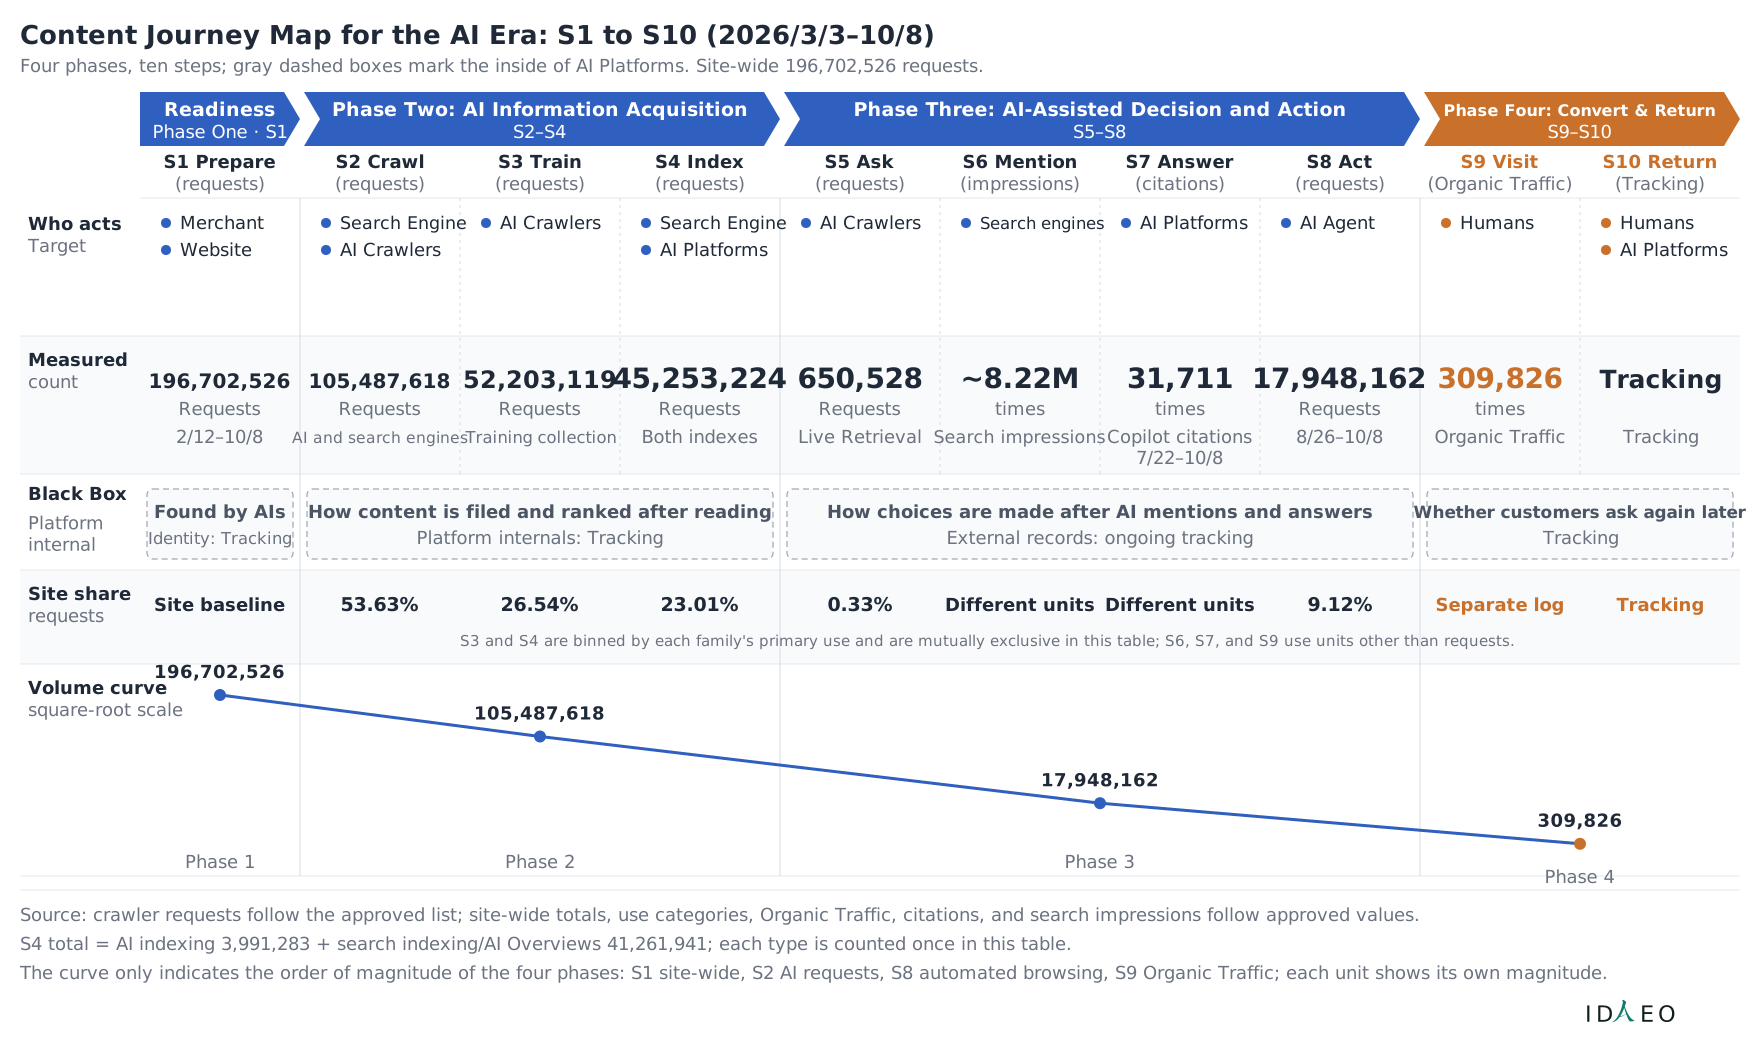
Figure 3-2 Content Journey Map and the AI Black Box

Content Journey Map and the AI Black Box Measurement results for each journey phase and the AI black box
Figure 3-2 Content Journey Map and the AI Black Box
View as text

Read the journey phases horizontally, comparing the number cells with the live-test topics inside the black box.

Content Journey Map for the AI Era: S1 to S10 (2026/3/3–10/8)
Four phases, ten steps; gray dashed boxes mark the inside of AI Platforms. Site-wide 196,702,526 requests.
Readiness
Phase One · S1
Phase Two: AI Information Acquisition
S2–S4
Phase Three: AI-Assisted Decision and Action
S5–S8
Phase Four: Convert & Return
S9–S10
S1 Prepare
(requests)
S2 Crawl
(requests)
S3 Train
(requests)
S4 Index
(requests)
S5 Ask
(requests)
S6 Mention
(impressions)
S7 Answer
(citations)
S8 Act
(requests)
S9 Visit
(Organic Traffic)
S10 Return
(Tracking)
Who acts
Target
Measured
count
Black Box
Platforminternal
Site share
requests
Volume curve
square-root scale
Merchant
Website
Search Engine
AI Crawlers
AI Crawlers
Search Engine
AI Platforms
AI Crawlers
Search engines
AI Platforms
AI Agent
Humans
Humans
AI Platforms
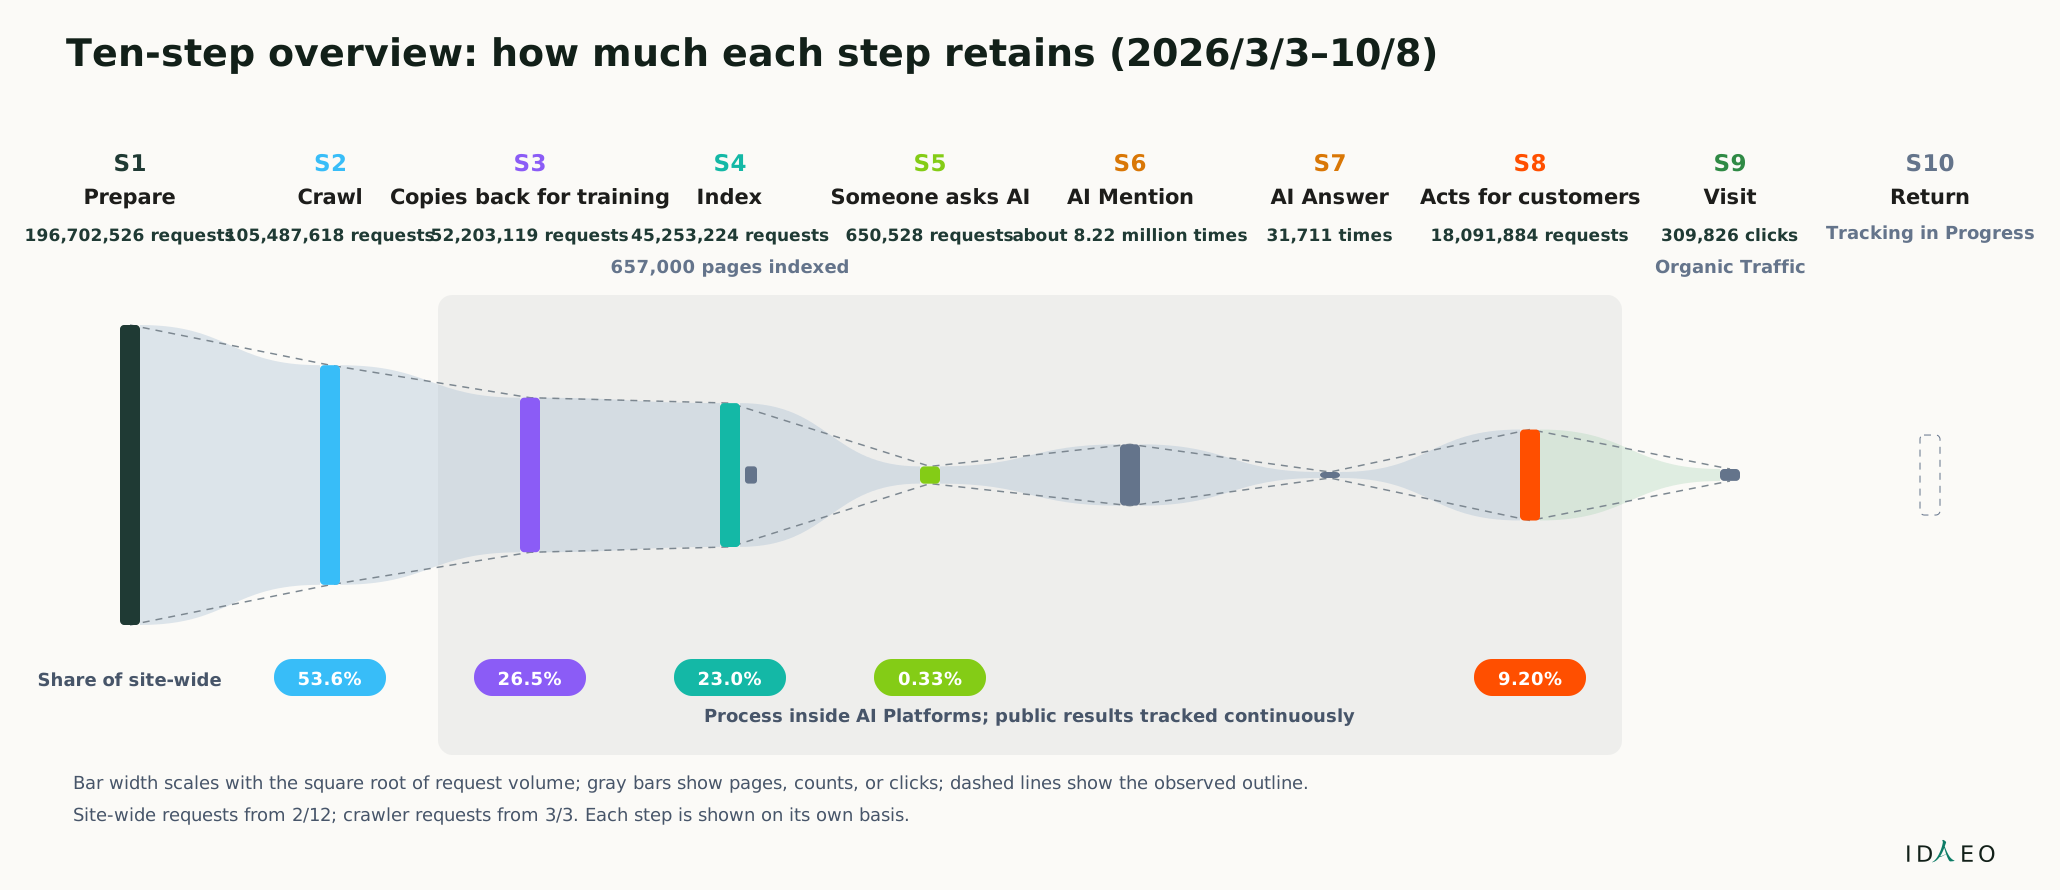
196,702,526
Requests
2/12–10/8
105,487,618
Requests
AI and search engines
52,203,119
Requests
Training collection
45,253,224
Requests
Both indexes
650,528
Requests
Live Retrieval
~8.22M
times
Search impressions
31,711
times
Copilot citations
7/22–10/8
17,948,162
Requests
8/26–10/8
309,826
times
Organic Traffic
Tracking
Tracking
Found by AIs
Identity: Tracking
How content is filed and ranked after reading
Platform internals: Tracking
How choices are made after AI mentions and answers
External records: ongoing tracking
Whether customers ask again later
Tracking
Site baseline
53.63%
26.54%
23.01%
0.33%
Different units
Different units
9.12%
Separate log
Tracking
S3 and S4 are binned by each family's primary use and are mutually exclusive in this table; S6, S7, and S9 use units other than requests.
196,702,526
Phase 1
105,487,618
Phase 2
17,948,162
Phase 3
309,826
Phase 4
Source: crawler requests follow the approved list; site-wide totals, use categories, Organic Traffic, citations, and search impressions follow approved values.
S4 total = AI indexing 3,991,283 + search indexing/AI Overviews 41,261,941; each type is counted once in this table.
The curve only indicates the order of magnitude of the four phases: S1 site-wide, S2 AI requests, S8 automated browsing, S9 Organic Traffic; each unit shows its own magnitude.
ID
EO

How to readRead the journey phases horizontally, comparing the number cells with the live-test topics inside the black box.

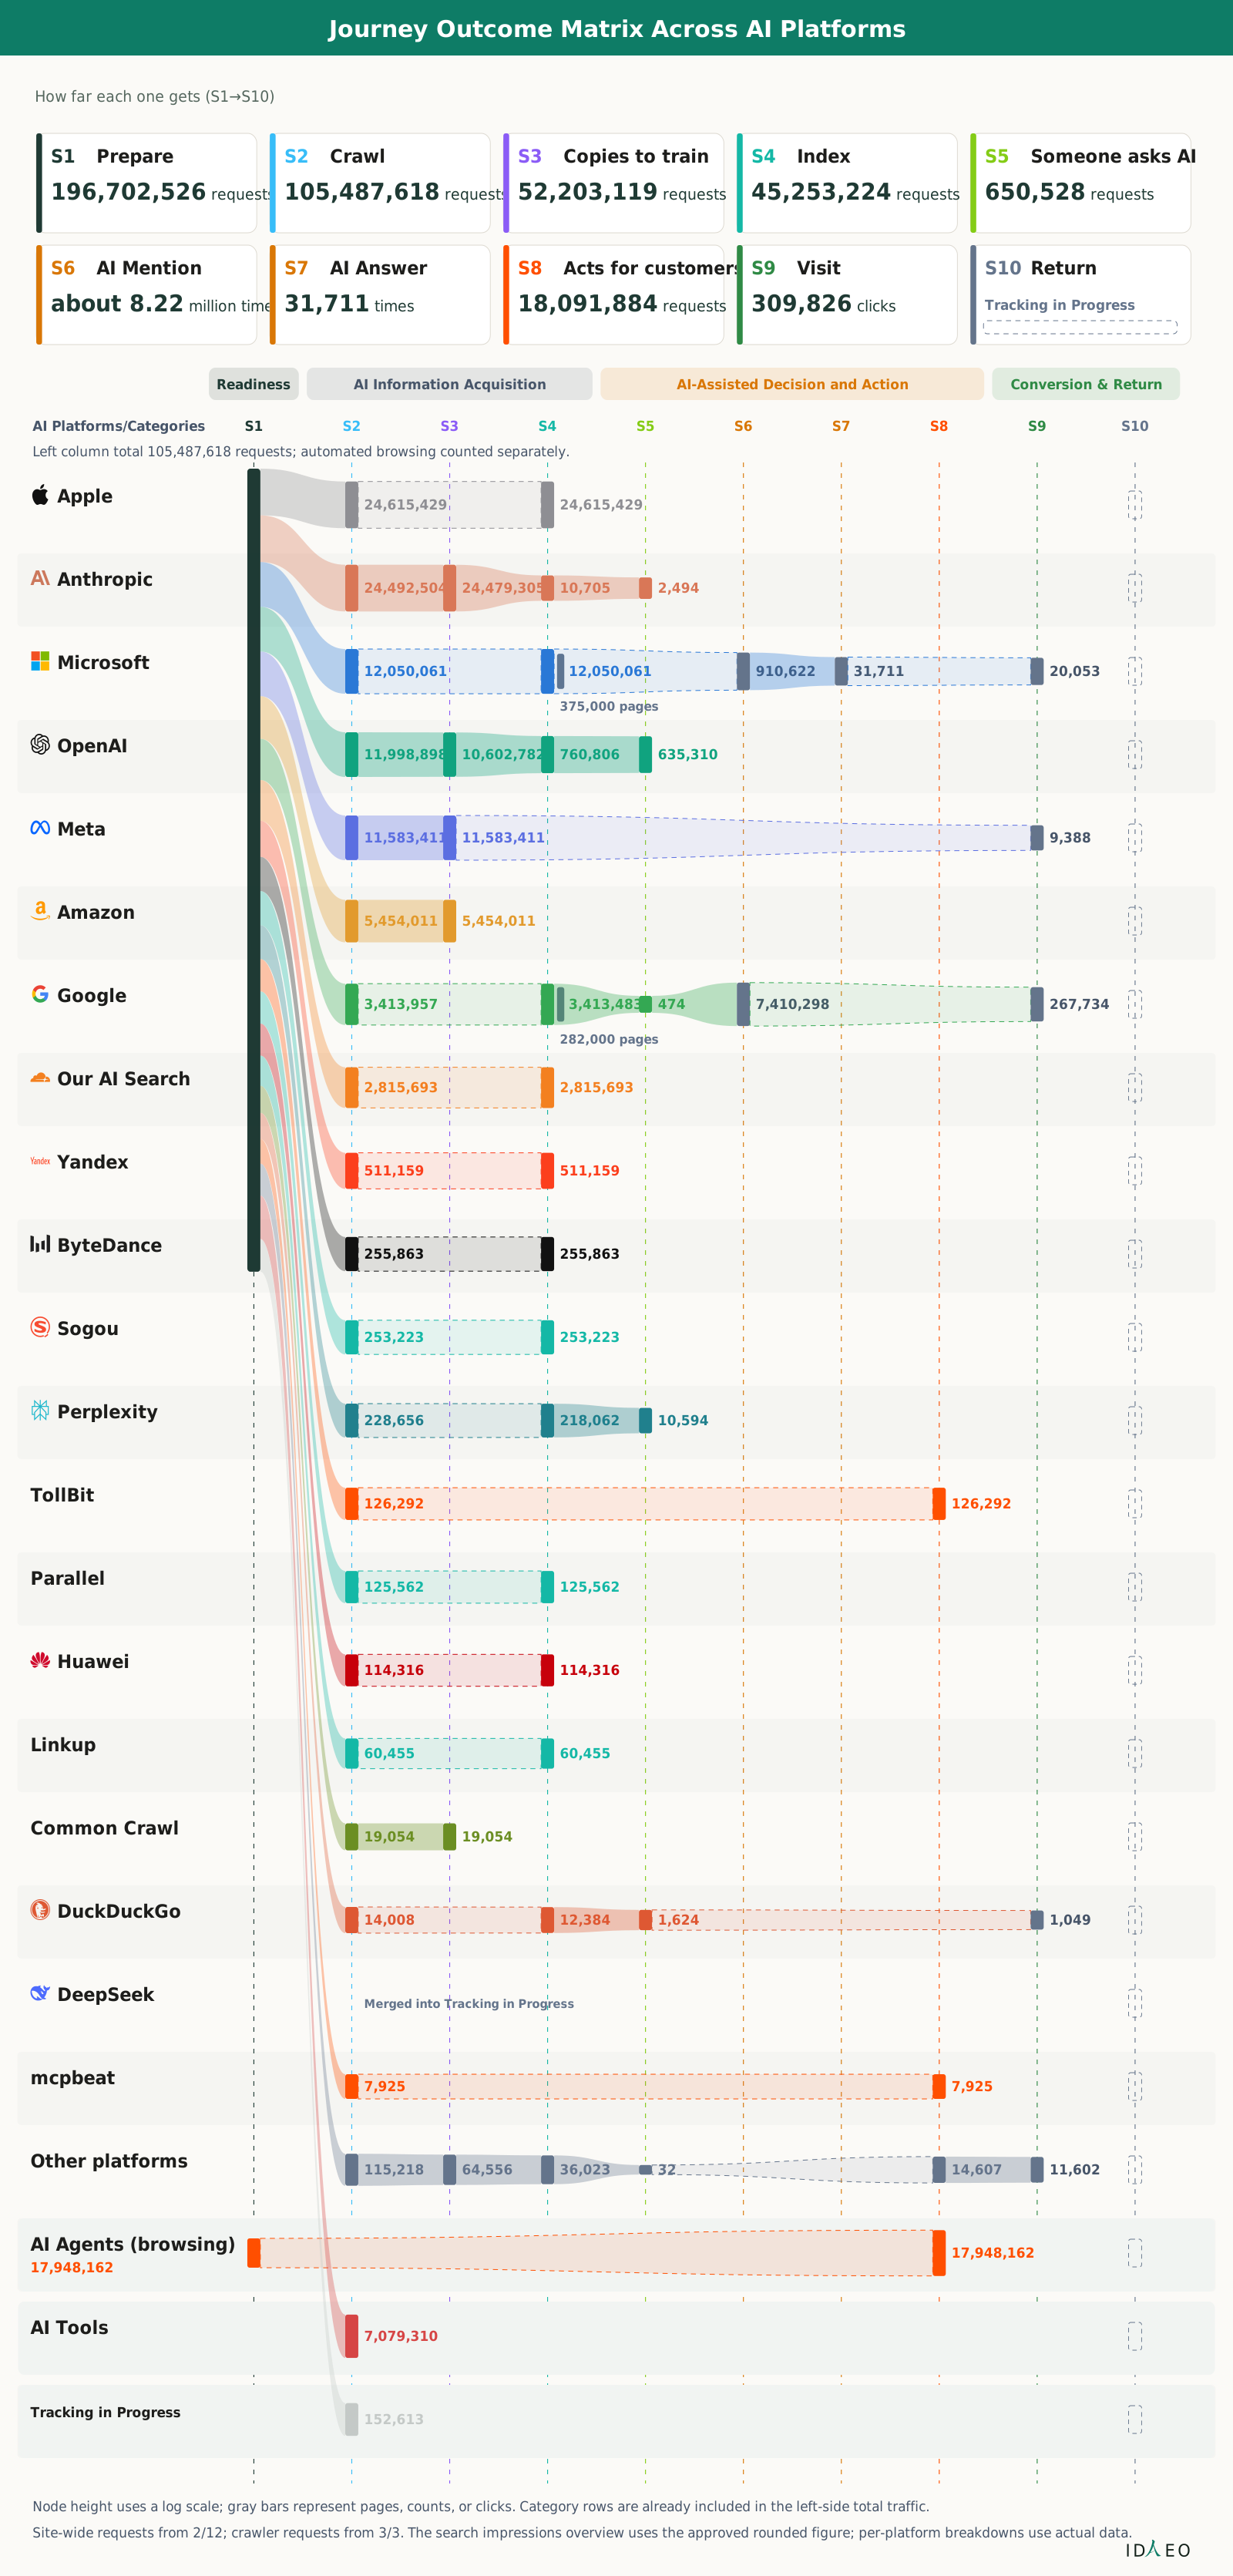
Figure 3-3 Journey Outcome Matrix Across AI Platforms

Journey Outcome Matrix Across AI Platforms Summary table of records across S1–S10 for all AI platforms
Figure 3-3 Journey Outcome Matrix Across AI Platforms
View as text

One row per platform, S1 to S10 across; nodes mark published results, and the rest should be read as still being tracked. In the figure, S6 lists search impressions (not AI mentions), meaning the number of times you appear in search results. The mention rate in AI answers will be published later.

Journey Outcome Matrix Across AI Platforms
How far each one gets (S1→S10)
S1
Prepare
196,702,526 requests
S2
Crawl
105,487,618 requests
S3
Copies to train
52,203,119 requests
S4
Index
45,253,224 requests
S5
Someone asks AI
650,528 requests
S6
AI Mention
about 8.22 million times
S7
AI Answer
31,711 times
S8
Acts for customers
18,091,884 requests
S9
Visit
309,826 clicks
S10
Return
Tracking in Progress
Readiness
AI Information Acquisition
AI-Assisted Decision and Action
Conversion & Return
S1
S2
S3
S4
S5
S6
S7
S8
S9
S10
AI Platforms/Categories
Left column total 105,487,618 requests; automated browsing counted separately.
Apple
24,615,429
24,615,429
Anthropic
24,492,504
24,479,305
10,705
2,494
Microsoft
12,050,061
12,050,061
375,000 pages
910,622
31,711
20,053
OpenAI
11,998,898
10,602,782
760,806
635,310
Meta
11,583,411
11,583,411
9,388
Amazon
5,454,011
5,454,011
Google
3,413,957
3,413,483
282,000 pages
474
7,410,298
267,734
Our AI Search
2,815,693
2,815,693
Yandex
511,159
511,159
ByteDance
255,863
255,863
Sogou
253,223
253,223
Perplexity
228,656
218,062
10,594
TollBit
126,292
126,292
Parallel
125,562
125,562
Huawei
114,316
114,316
Linkup
60,455
60,455
Common Crawl
19,054
19,054
DuckDuckGo
14,008
12,384
1,624
1,049
DeepSeek
Merged into Tracking in Progress
mcpbeat
7,925
7,925
Other platforms
115,218
64,556
36,023
32
14,607
11,602
AI Agents (browsing)
17,948,162
17,948,162
AI Tools
7,079,310
Tracking in Progress
152,613
Node height uses a log scale; gray bars represent pages, counts, or clicks. Category rows are already included in the left-side total traffic.
Site-wide requests from 2/12; crawler requests from 3/3. The search impressions overview uses the approved rounded figure; per-platform breakdowns use actual data.
ID
EO

How to readOne row per platform, S1 to S10 across; nodes mark published results, and the rest should be read as still being tracked. In the figure, S6 lists search impressions (not AI mentions), meaning the number of times you appear in search results. The mention rate in AI answers will be published later.

OpenAI: One Platform, Three Purposes for Reading

During Mar 3, 2026–Oct 8, OpenAI's three identified crawler types made a total of 11,998,898 requests to the site: 10,602,782 for training, 760,806 for indexing, and 635,310 for real-time retrieval. OpenAI had the most real-time retrievals of any platform. These are requests recorded by the website. They do not establish that content entered a model, was indexed, or was mentioned or cited in an answer. OpenAI's later-stage results remain Tracking in Progress. See the full chart in Figure 3-7 under “Platform Profiles” at the end of this chapter.

Figure 3-4 Google: 7,410,298 search impressions|The platform with the most complete numbers along the whole path

Google: 7,410,298 search impressions|The platform with the most complete numbers along the whole path Google's crawls, search impressions, and customer arrivals can be compared in sequence along the journey
Figure 3-4 Google: 7,410,298 search impressions|The platform with the most complete numbers along the whole path
View as text

Read each step from left to right; check source, period, and unit first, then compare numbers on the same basis.

Google: search impressions reached 7,410,298
Finding: from indexing and impressions to customer visits, Google has the most complete numbers along the whole path.
The Google path: from S1 Prepare to S10 Return
2026/3/3–10/8 · site-wide counted from 2/12
S1
Prepare
S2
Crawl
S3
Train
S4
Index
S5
Ask AI
S6
AI Mention
S7
AI Answer
S8
Act
S9
Visit
S10
Return
S1 Prepare
Our website
196,702,526
Site requests · 2/12–10/8
S2 Crawl
All Google crawlers
3,556,335
3/3–10/8 · requests
S3 Train
The Google path
Tracking
S4 Index
Google search crawler
3,413,483
Requests
~282,000 pages indexed
S5 Ask
User-triggered
474
requests · both types
S6 Mention
Google impressions
7,410,298
impressions (search)
S9 Visit
GoogleOrganic Traffic
267,734
visits · separate log
Numbers at different steps come from different records; requests, pages, impressions, and Organic Traffic are each read in their own units.
Google requests
Search crawler
3,413,483
Tracking
142,378
Real-time retrievals
474
Total 3,556,335
From search platform
Indexed
about 282,000
pages
Search impressions
7,410,298
times
Search clicks
179,618
times
Search CTR 2.42%
Organic Traffic (separate)
Brought by Google
267,734 visits
All sources
309,826 visits
Organic Traffic and search clicks
each read in its own unit
Black Box: inside AI Platforms
AI Answer
S7 AI citations: Tracking in Progress; due later
Act
S8 Act: Tracking in Progress
S10 Return
Tracking
Three records, one segment each
Website requests
Daily crawler request log
Search platforms
Indexing, impressions, clicks
Organic Traffic
Visitor sources visible
Weekly search click-through rate (Google search platform · search clicks ÷ search impressions)
2026/3/3–10/8 · weeks start Monday · domain properties of the old and new sites
0%
2%
4%
6%
8%
3/2
3/30
4/27
5/25
6/22
7/20
8/17
9/14
10/5
7.03%
1.25%
2.63%
Same period
179,618 search clicks
7,410,298 search impressions
Overall click-through rate 2.42%
Sources: crawler requests from the approved list; site-wide and Organic Traffic from approved figures. Indexed pages are the September search platform snapshot.
Google search impressions, clicks, and weekly curve: two domain properties on the search platform, using web search records from 3/3–10/8.
Search result impressions and Organic Traffic each have their own basis; Google's AI answer citations, actions, and return visits are still being tracked.
ID
EO
Google: 7,410,298 search impressions|The platform with the most complete numbers along the whole path
ItemValueUnit
Search crawler3,413,483Requests
Tracking142,378Requests
Real-time retrievals474Requests
CSV

How to readRead each step from left to right; check source, period, and unit first, then compare numbers on the same basis.

Figure 3-5 Microsoft: 12,050,061 search crawler reads|The platform that currently provides AI answer citation numbers

Microsoft: 12,050,061 search crawler reads|The platform that currently provides AI answer citation numbers Microsoft's data connects search indexing, answer citations, and customer arrivals
Figure 3-5 Microsoft: 12,050,061 search crawler reads|The platform that currently provides AI answer citation numbers
View as text

Compare with Figure 3-4 (Google), and note Microsoft's AI answer citation volume and its reporting period.

Microsoft: 12,050,061 search crawler reads
Finding: the platform that currently provides AI answer citation numbers; Copilot cited 31,711 times.
The Microsoft (Bing, Copilot) path: from S1 to S10
2026/3/3–10/8 · site-wide counted from 2/12
S1
Prepare
S2
Crawl
S3
Train
S4
Index
S5
Ask AI
S6
AI Mention
S7
AI Answer
S8
Act
S9
Visit
S10
Return
S1 Prepare
Our website
196,702,526
Site requests · 2/12–10/8
S2 Crawl
Bing search crawler
12,050,061
3/3–10/8 · requests
S3 Train
Training use
Tracking
S4 Index
Bing search crawler
12,050,061
Requests
~375,000 pages indexed
S5 Ask
Real-time retrieval
Tracking
S6 Mention
Bing impressions
910,622
impressions (search)
S9 Visit
MicrosoftOrganic Traffic
20,053
visits · separate log
Numbers at different steps come from different records; requests, pages, impressions, citations, and Organic Traffic are each read in their own units.
ID
EO
Microsoft requests
Search crawler
12,050,061
Builds search index
Also serves AI Overviews
Same batch of requests
Counted once
Total 12,050,061
From search platform
Indexed
About 375,000
pages
Search impressions
910,622
times
Search clicks
32,052
times
Click-through rate 3.52%
Organic Traffic (separate)
Microsoft brings
20,053 visits
All sources
309,826 visits
Organic Traffic and search clicks
each read in its own unit
Answers visible; actions and returns still tracked
S7 Copilot answer citations
31,711 times
S8 Act
Tracking
S10 Return
Tracking
Three records, one segment each
Website requests
Daily crawler request log
Search platforms
Indexing, impressions, clicks
Answer monitoring
Citation counts visible
Weekly search click-through rate (search clicks ÷ search impressions)
Bing search platform · data available 7/21–10/6 · weeks start Monday
Higher
Lower
7/20
8/3
8/17
8/31
9/14
9/28
10/5
Same period
32,052 search clicks
910,622 search impressions
Overall click-through rate 3.52%
Sources: crawler requests from the approved list; site-wide, indexing, Organic Traffic, and answer citations from approved figures.
Search impressions, clicks, and the weekly curve use the daily data available from the search platform, ending 10/6; the answer citation period is 7/22–10/8.
Bing indexing is the September snapshot; answer citations and search clicks are counted separately, and platform actions and return visits are still being tracked.

How to readCompare with Figure 3-4 (Google), and note Microsoft's AI answer citation volume and its reporting period.

Figure 3-6 How Do You Know AI Cites You? Measuring Both Ends of the Black Box

How Do You Know AI Cites You? Measuring Both Ends of the Black Box Answers “How do you know AI cites you?” Citation happens inside the AI Black Box
Figure 3-6 How Do You Know AI Cites You? Measuring Both Ends of the Black Box
View as text

On the left are first-party records: AI Real-Time Retrievals of 651,000. On the right are platform data and direct questions. Google's generative AI impression figures for this site are still pending. Copilot answer citations of the IDAEO platform total 31,711. TK Lin's personal IDA appeared in AI search source lists at a rate of 84% (four of the five models used the same search interface; the questions named the author himself; a single case). Below, reads, impressions, and citations form a checkable path. Requests, impressions, citations, and question ratios use different units and cannot be added together. This is a method diagram; cross-verification has not yet been completed.

ID
EO
How do you know AI cites you?
Cross-checking content use from both ends of the black box
Seeing content use
Seeing impressions, citations, answers
Site / edge first-party records
Platform data / asking AI directly
AI Black Box
Training · ranking
Mention · answer · action
S6 Mention
S7 Answer
1
VPS access logs
Site requests · paths
2
Cloudflare
AI crawler requests
AI referrals
Matched against VPS
Identifies the same read
First-party total
651,000
AI real-time retrievals
3
Google GSC
Generative AI impressions
and the URLs shown
Our site's figures pending
4
Bing Webmaster Tools
Copilot answer citations
31,711 times
2026/7/22–10/8
5
Asking multiple AIs
100 questions · five models
84%
IDA used as a source
Same URL · same period
Links evidence from both ends into one checkable path
Crawls
Exposure
Citation / answer
Requests, impressions, citations, question ratios: different units, not additive.
Bing cited URLs and tested answers check citation directly; front-end records fill in reads and impressions.
Case before vs. after
TK Lin's personal IDA, live test
9/20
0
10/3
84%
100 questions, five AI models; 84% of answers used this IDA as a source.
IDAEO measures both ends of the black box, then uses platform dataand periodic live tests to measure the results of content use.
Original framework © 2026

How to readOn the left are first-party records: AI Real-Time Retrievals of 651,000. On the right are platform data and direct questions. Google's generative AI impression figures for this site are still pending. Copilot answer citations of the IDAEO platform total 31,711. TK Lin's personal IDA appeared in AI search source lists at a rate of 84% (four of the five models used the same search interface; the questions named the author himself; a single case). Below, reads, impressions, and citations form a checkable path. Requests, impressions, citations, and question ratios use different units and cannot be added together. This is a method diagram; cross-verification has not yet been completed.

Platform Profiles: OpenAI, Anthropic, Apple, Meta

All four currently have read records. Platform impressions, citations, or Organic Traffic breakdowns remain Tracking in Progress, so these profiles appear at the end of the chapter. Once the data is complete, they will return to the main text under the same rule: records must cover reads, platform impressions or citations, and an Organic Traffic breakdown.

Figure 3-7 OpenAI: 10,602,782 reads for training purposes|Nearly nine in ten requests are for training purposes; also the platform with the most real-time retrievals

OpenAI: 10,602,782 reads for training purposes|Nearly nine in ten requests are for training purposes; also the platform with the most real-time retrievals OpenAI crawls content for training and also retrieves it in real time to answer live questions
Figure 3-7 OpenAI: 10,602,782 reads for training purposes|Nearly nine in ten requests are for training purposes; also the platform with the most real-time retrievals
View as text

Compare with Figure 3-4 (Google): look first at retrievals and customer arrivals, then at the scope of ongoing tracking in the middle.

OpenAI: Of the three crawler types, the one for training purposes recorded the most reads: 10,602,782
Finding: Nearly nine in ten reads are for training purposes. It is also the platform with the most real-time retrievals.
The OpenAI path: crawlers come in, black box inside the platform, customers visit
2026/3/3–10/8 · three crawlers, 11,998,898 requests total; OpenAI Organic Traffic breakdown still being tracked
Requests from three identified crawlers
Green band widths are allocated by 11,998,898 requests; each purpose is counted once.
S3 Train
10,602,782 requests
S4 Index
760,806 requests
S5 Ask
635,310 requests
Black box inside the platform
AI mention, answer, and action flow
OpenAI-specific requests: Tracking in Progress
S1 Prepare
Our website
S2 Crawl
OpenAI's three crawlers
S3–S5 Entering the site
Site request log
S6–S8 Inside the platform
Black Box
S9 Visit
Organic Traffic
Whole site
196,702,526
Requests · 2/12–10/8
OpenAI
11,998,898
Requests
S3 Train
Training crawler
10,602,782
Requests
Takes content back for model training
S4 Index
Search crawler
760,806
S5 Ask
Real-time retrieval crawler
635,310
Training requests visible
In AI Platforms: live tests
Indexing requests visible
In AI Platforms: live tests
Real-time retrievals visible
In AI Platforms: live tests
After training
In AI Platforms: live tests
S6 Mention
In AI Platforms: live tests
S7 Answer
In AI Platforms: live tests
S9 Visit
Organic Traffic
Tracking
Site-wide total
309,826 visits
S8 Act
Tracking in Progress
S10 Return
Tracking in Progress
On this path, what we can count directly is crawler requests arriving at the site.
The training, indexing, and question request branches do not overlap; they sum to 11,998,898.
The platform's mentions, answers, and actions are each read in their own units.
The 309,826 in S9 is Organic Traffic from all sources; the OpenAI breakdown is still being tracked.
Sources: approved site-wide and Organic Traffic figures; the three crawlers' requests are summed from the 2026/3/3–10/8 approved list.
Green band widths are allocated by the request counts of the three crawlers; the dashed box marks the inside of the OpenAI platform, observed by live tests.
ID
EO

How to readCompare with Figure 3-4 (Google): look first at retrievals and customer arrivals, then at the scope of ongoing tracking in the middle.

Figure 3-8 Anthropic: 24,479,305 requests for training purposes|Highest number of requests for training purposes of any platform

Anthropic: 24,479,305 requests for training purposes|Highest number of requests for training purposes of any platform Most of Anthropic's crawls are for training, showing the scale of this type of crawling
Figure 3-8 Anthropic: 24,479,305 requests for training purposes|Highest number of requests for training purposes of any platform
View as text

Compare with Figure 3-7 (OpenAI); read the requests arriving at the site and the platform's internal live-test topics separately.

Anthropic: 24,479,305 requests for training purposes
Finding: Almost all reads are for training purposes. It has the highest number of requests for training purposes of any platform.
The Anthropic (Claude) path: from crawlers to platform to customers
2026/3/3–10/8 · five crawlers, 24,492,552 requests total
S1
Prepare
S2
Crawl
S3
Train
S4
Index
S5
Ask AI
S6
AI Mention
S7
AI Answer
S8
Act
S9
Visit
S10
Return
Site-arrival requests by four purposes
Training, indexing, and real-time retrieval, plus 48 requests with purpose still being tracked; each item is counted once.
S3 Train
24,479,305 requests
S4 Index
10,705 requests
S5 Ask
2,494 requests
Black Box: inside AI Platforms
S6–S8 Mentions, answers, and actions
Tracking in Progress
S1 Prepare
Our website
S2 Crawl
Anthropic's five crawlers
S3–S5 Site-arrival purposes
Site request log
S6–S8 Inside the platform
Black Box
S9 Visit
Organic Traffic
Whole site
196,702,526
Requests · 2/12–10/8
Anthropic
24,492,552
Requests
S3 Train
Training crawler
24,479,305
Requests
Takes content back for model training
S4 Index
Search crawler
10,705
S5 Ask
Real-time retrieval crawler
2,494
Site-arrival requests visible
In AI Platforms: live tests
Indexing requests visible
In AI Platforms: live tests
Real-time retrievals visible
In AI Platforms: live tests
After training
In AI Platforms: live tests
S6 Mention
In AI Platforms: live tests
S7 Answer
In AI Platforms: live tests
S9 Visit
Organic Traffic (own)
Tracking in Progress
Site-wide total
309,826 visits
S8 Act
Tracking in Progress
S10 Return
Tracking in Progress
On this path, what can be counted directly is crawler requests arriving at the site.
S3 24,479,305 + S4 10,705 + S5 2,494 + purpose being tracked 48 = 24,492,552.
Crawler requests and the platform's mentions, answers, and actions are each read in their own units.
In-platform processing in S6–S8 and the S9 Organic Traffic breakdown are still being tracked.
Sources: site-wide and Organic Traffic from approved figures; each platform's crawler requests from the 2026/3/3–10/8 approved list.
Green bands show the purposes of site-arrival requests; dashed boxes mark in-platform or platform-specific numbers still being tracked.
ID
EO

How to readCompare with Figure 3-7 (OpenAI); read the requests arriving at the site and the platform's internal live-test topics separately.

Figure 3-9 Apple: 24,615,429 indexing requests|Highest indexing volume of any platform

Apple: 24,615,429 indexing requests|Highest indexing volume of any platform Apple's crawling is concentrated on retrieving content for indexing
Figure 3-9 Apple: 24,615,429 indexing requests|Highest indexing volume of any platform
View as text

Look at crawl volume first, then follow the journey to see the tracking scope of later use.

Apple: indexing requests reach 24,615,429
Finding: all reads go to building the search index (Siri, Spotlight, and other search features); the highest indexing volume of any platform.
The Apple path: from crawlers to platform to customers
2026/3/3–10/8 · one crawler, 24,615,429 requests total
S1
Prepare
S2
Crawl
S3
Train
S4
Index
S5
Ask AI
S6
AI Mention
S7
AI Answer
S8
Act
S9
Visit
S10
Return
Site-arrival requests for indexing
All requests with an assigned purpose are in S4 Index; this batch is counted once.
S3 Train
Tracking in Progress
S4 Index
24,615,429 requests
S5 Ask
Tracking in Progress
Black Box: inside AI Platforms
S6–S8 Mentions, answers, and actions
Tracking in Progress
S1 Prepare
Our website
S2 Crawl
Apple's single crawler
S3–S5 Site-arrival purposes
Site request log
S6–S8 Inside the platform
Black Box
S9 Visit
Organic Traffic
Whole site
196,702,526
Requests · 2/12–10/8
Apple
24,615,429
Requests
S3 Train
Platform-specific requests
Tracking in Progress
Takes content back for model training
S4 Index
Search crawler
24,615,429
S5 Ask
Platform-specific requests
Tracking in Progress
In AI Platforms: live tests
Indexing requests visible
In AI Platforms: live tests
Tracking in Progress
In AI Platforms: live tests
After training
In AI Platforms: live tests
S6 Mention
In AI Platforms: live tests
S7 Answer
In AI Platforms: live tests
S9 Visit
Organic Traffic (own)
Tracking in Progress
Site-wide total
309,826 visits
S8 Act
Tracking in Progress
S10 Return
Tracking in Progress
On this path, what can be counted directly is crawler requests arriving at the site.
The 24,615,429 requests in S4 equal the Apple crawler total.
Crawler requests and the platform's mentions, answers, and actions are each read in their own units.
Apple's platform-specific numbers for S3 and S5–S10 are still being tracked.
Sources: site-wide and Organic Traffic from approved figures; each platform's crawler requests from the 2026/3/3–10/8 approved list.
Green bands show the purposes of site-arrival requests; dashed boxes mark in-platform or platform-specific numbers still being tracked.
ID
EO

How to readLook at crawl volume first, then follow the journey to see the tracking scope of later use.

Figure 3-10 Meta: 11,583,411 requests for training purposes|All reads are for training purposes

Meta: 11,583,411 requests for training purposes|All reads are for training purposes Meta's crawl records correspond to training use, while customer arrivals are read as organic traffic
Figure 3-10 Meta: 11,583,411 requests for training purposes|All reads are for training purposes
View as text

Look at AI crawls and customer arrivals separately, reading each result in its own unit.

Meta: 11,583,411 requests for training purposes
Finding: All reads are for training purposes. Separately, Organic Traffic totaled 9,388 visits over the same period.
Meta's path: from crawler to platform, then to customers
2026/3/3–10/8 · one crawler, 11,583,411 requests in total
S1
Prepare
S2
Crawl
S3
Train
S4
Index
S5
Ask AI
S6
AI Mention
S7
AI Answer
S8
Act
S9
Visit
S10
Return
Site requests for training use
All requests with an assigned purpose fall under S3 Train; this batch is counted only once.
S3 Train
11,583,411 requests
S4 Index
Tracking in Progress
S5 Ask
Tracking in Progress
Black Box: inside AI Platforms
S6–S8 Mentions, answers, and actions
Tracking in Progress
S1 Prepare
Our website
S2 Crawl
One Meta crawler
S3–S5 Site-arrival purposes
Site request log
S6–S8 Inside the platform
Black Box
S9 Visit
Organic Traffic
Whole site
196,702,526
Requests · 2/12–10/8
Meta
11,583,411
Requests
S3 Train
Training crawler
11,583,411
Requests
Takes content back for model training
S4 Index
Platform-specific requests
Tracking in Progress
S5 Ask
Platform-specific requests
Tracking in Progress
Site-arrival requests visible
In AI Platforms: live tests
Tracking in Progress
In AI Platforms: live tests
Tracking in Progress
In AI Platforms: live tests
After training
In AI Platforms: live tests
S6 Mention
In AI Platforms: live tests
S7 Answer
In AI Platforms: live tests
S9 Visit
Organic Traffic
9,388 visits
Site-wide total
309,826 visits
S8 Act
Tracking in Progress
S10 Return
Tracking in Progress
On this path, what can be counted directly is crawler requests arriving at the site.
The 11,583,411 requests at S3 equal the Meta crawler total.
Crawler requests and the platform's mentions, answers, and actions are each read in their own units.
S9 Organic Traffic is a separate 9,388 visits; read requests and visits by humans each in their own unit.
Sources: site-wide and Organic Traffic from approved figures; each platform's crawler requests from the 2026/3/3–10/8 approved list.
Green bands show the purposes of site-arrival requests; dashed boxes mark in-platform or platform-specific numbers still being tracked.
ID
EO

How to readLook at AI crawls and customer arrivals separately, reading each result in its own unit.

Key Points of This Chapter

ClaimWhy
The AI black box is the training, ranking, mentions, answers, and actions that happen inside AI platforms.Mentions, answers, and actions in S6–S8 happen inside the platform. The Black Box also hides whether content read in S3–S4 is used for training or indexed, and how it is ranked. Being read does not mean content has been used for training or indexed. The website records crawls and site arrivals directly. S5 real-time retrieval also has first-party numbers. In the figure, the S6 number is search impressions (not AI mentions). The mention rate in AI answers will be published later.
IDAEO measures both ends of the black box, then uses platform data and periodic live tests to measure the results of content use.Crawls before entering and site arrivals after leaving are both first-party measurements. In the figure, S6 lists search impressions (not AI mentions), which come from platform data. The IDAEO platform's 31,700 Copilot citations also come from platform data. The mention rate in AI answers will be published later. Periodically asking multiple AIs directly can confirm whether you were mentioned and whether the answers were correct. Each source provides different evidence, but none reveals the platform's internal processing.
Periodic live tests of TK Lin's personal IDA record whether it appears in AI search source lists.Live test of TK Lin's personal IDA: on Sep 20, launch day, AI citations were 0. On Oct 3, a live test covered 100 questions across five AI models. This IDA appeared in AI search source lists at a rate of 84% (four of the five models used the same search interface; the questions named the author himself; a single case). It ranked first among all sources by number of appearances. The 0 on Sep 20 is a citation count; the 84% on Oct 3 is a source-list appearance rate. They use different units and cannot be compared directly. This is a single case and cannot be generalized to merchants. Platform-wide numbers for AI Mention Rate and AI Answer Accuracy Rate will be published later.
Results from each source are read separately by unit.Requests, pages, and clicks represent different events; only comparisons on the same basis are meaningful for marketing.
The platform AI Citations figure published in this book comes from Copilot: the IDAEO platform has been cited 31,700 times since Jul 22.This is the citation result provided by Copilot; the remaining platforms are still being tracked and will be published later. Label the source and period clearly so comparisons are made on the same basis.

Terms

Black Box
Mentions, answers, and actions in S6–S8 happen inside AI Platforms. The Black Box also hides whether content read in S3–S4 is used for training or indexed, and how it is ranked. Being read does not mean content has been used for training or indexed. IDAEO observes results through measurements at both ends and periodic live tests. In the figure, the S6 number is search impressions (not AI mentions). The mention rate in AI answers will be published later.
Platform Data
Platforms such as Google and Bing provide indexing, search impressions, and clicks. S6 in the figure is search impressions (not AI mentions). The platform AI citation data in this book comes from Copilot. The mention rate in AI answers will be published later.
Indexed
The result of a search platform adding pages to its index, counted in pages.
Search result impressions
The number of times a page appears in search results. The S6 cell in the figure lists search impressions (not AI mentions). The mention rate in AI answers will be published later.

FAQ

Q: How do you know AI cites you?

A: Look at three kinds of evidence together. First, citation counts reported by platforms. The figures published in this book record Copilot citations of the IDAEO platform. Since Jul 22, the total is 31,700 citations. Second, regularly ask multiple AI services questions to check mentions and answer accuracy. Third, records of source lists for individual cases. TK Lin's personal IDA had 0 AI citations on its launch day, Sep 20. On Oct 3, testing covered 100 questions and five AI models. This IDA appeared in AI search source lists at a rate of 84%. The 0 is a citation count; 84% is the share of source lists in which it appeared. The units differ, so they cannot be compared directly. This is a single case and cannot be generalized to merchants. There is another signal: first-party records show AI real-time reads totaling 651,000. These are reads, not necessarily citations. Citations occur inside AI Platforms, and these records provide different kinds of evidence. See Figure 3-6, “How Do We Know AI Cited Us?”, for an overview. Also see Figure 3-2, “Content Journey Map and the AI Black Box,” and Figure 3-5, “Microsoft.”

Q: Where do Google's and OpenAI's numbers come from?

A: Google's indexing, search impressions, and clicks come from the search platform. S6 in the figure is search impressions (not AI mentions). The mention rate in AI answers will be published later. OpenAI's retrievals and customer arrivals come from first-party measurement. The data scopes differ, so check source and step first when placing them side by side.

Q: Can IDAEO open the AI black box?

A: We cannot open it, but we can measure both ends. Mentions, answers, actions, and the training and ranking that follow crawls happen inside AI Platforms. Measure crawls and site arrivals at both ends, alongside search impressions, Copilot citations, and periodic questions. In the figure, S6 lists search impressions (not AI mentions). These data can provide evidence of citations, mentions, and answer accuracy. Live test of TK Lin's personal IDA: on Sep 20, launch day, AI citations were 0. On Oct 3, a live test covered 100 questions across five AI models. This IDA appeared in AI search source lists at a rate of 84%. It ranked first among all sources by number of appearances. The 0 is a citation count; the 84% is a source-list appearance rate. They use different units and cannot be compared directly. This is a single case and cannot be generalized to merchants. This evidence still does not reveal the platform's internal processing. Platform-wide numbers for AI Mention Rate and AI Answer Accuracy Rate will be published later.

Q: Who is counted in this chapter's numbers?

A: Platform results are presented separately by source and what was measured. The Copilot citation count covers the IDAEO platform. TK Lin's personal IDA is a live test of a single piece of content; the percentage refers to its appearance in AI search source lists. The subjects and measurement methods differ. Each result must be interpreted within its published scope.

Q: Bing has indexed 375,000 pages and Google 282,000. How should you compare them?

A: Look at the two separately; each represents that platform's indexing result. The same page gets indexed by both, so adding them together double-counts.

This Chapter in Three Sentences

  1. Mentions, answers, and rankings inside AI Platforms are hidden in a Black Box.
  2. We can measure both ends: reads going in and site arrivals coming out, supplemented by periodic questions to AI.
  3. Reads, search impressions, and citations are different events and cannot be added together.

Three Things You Can Do This Week

  1. Organize your website's read and visit records, clearly labeling each source and period.
  2. Review the indexing, search impression, and citation records provided by search platforms. Record them separately.
  3. Ask AI about your business, then check its answers and listed sources.

Next ChapterIn the next chapter, you will learn which three types of sources are used to verify merchant information.

Self-CheckIdentify the Black Box: S6–S8, and what happens after the S3–S4 crawls. Explain what evidence first-party measurement at both ends, platform data, and periodic live tests each provide. Then use TK Lin's personal IDA to distinguish source-list records from an individual case from platform metrics. When reading S6 in the figure, make clear that the number is search impressions (not AI mentions). The mention rate in AI answers will be published later.

Chapter 4

Trust and Verification (Why Believe It): Credible Facts and External Corroboration

This chapter answersHow does a merchant's claim become a credible fact that AI can cite?

Why it comes hereAnswer accuracy in S7 is judged by credible facts, and verification also underpins the service tiers.

Figure 4-1 IDAEO Verification Model: Three-Party Verification and Credible Facts

The IDAEO Verification Model is built on big data from Japan, Taiwan, and Hong Kong. Data is accumulated over the long term and continuously checked, serving as the basis for identifying credible facts.

IDAEO Verification Model: Three-Party Verification and Credible Facts The IDAEO Verification Model combines Official Source, First-Party Source, and Third-Party Source evidence to support credible facts
Figure 4-1 IDAEO Verification Model: Three-Party Verification and Credible Facts
View as text

Start with the IDAEO Verification Model at the top, then the evidence roles of the Official Source, First-Party Source, and Third-Party Source, and finally the verification result for each fact.

③ Trust andVerification
Why trust it
From Figure 0-2
Verification Principles: do what we say, back it with evidence; no evidence, no claim
IDAEO
Core
IDAEO Verification Model
Japan, Taiwan, and Hong Kong big data
Triangulation
Three sources
Official Source
First-Party Source
Third-Party Source
Who says it
The government says
The merchant says
Outsiders say
Data source
Public government registries
Merchant website and owner
External public data
Evidencegathering
Official registry check
Source text preserved verbatim
Multi-source cross-checking
Labeling
Credibility status light
Preservation status
Source tag
Re-verification
Periodic audits
Re-verify on expiry
Ongoing evidence collection
VerificationEngine
Three sources in one
IDAEO Verification Engine
Cross-corroboration | Citation admission | Verdicts on record
Result
One result per fact, not one result for the whole store
Original framework © 2026
ID
EO

How to readStart with the IDAEO Verification Model at the top, then the evidence roles of the Official Source, First-Party Source, and Third-Party Source, and finally the verification result for each fact.

See the appendix “Claim Basis Table” at the end of the book: it lists the basis type and sources for each of the book’s 57 claims.

Key Points of This Chapter

ClaimWhy
IDAEO uses credible facts and external corroboration to turn merchant claims into a basis AI can cite.The IDAEO Verification Model is built on big data from Japan, Taiwan, and Hong Kong, accumulating data over the long term and checking continuously to confirm the credibility of each individual fact.
Law of Fact Primacy: credible content starts from verified facts.Every claim rests on verified facts. AI may be more likely to use verified content; this is still a hypothesis. It applies to claims that can be checked against Official Source or Third-Party Source data. Check whether AI answers match the verified facts. If AI still frequently gets verified facts wrong, this rule needs revision.
Law of Claim Traceability: every claim has a traceable basis.Only when it is traceable can AI cite it with confidence. The claim must include a source. Check whether the AI's answer can be traced back to that source. If AI still frequently gets it wrong despite the source, this rule needs revision.
Law of External Corroboration: a credible claim must have external corroboration.Independent viewpoints complete a one-sided account. The external source must be independent of the merchant; republishing your own claims does not count. Check whether the external information agrees with your account. If they contradict each other, investigate before labeling the claim.
Verify facts one by one, and keep confirming they are still current.AI cites specific content, so when information is updated it needs a matching credible basis.

Terms

Triangulated Verification
The principle of combining Official Source, First-Party Source, and Third-Party Source evidence to form a credible judgment.
Official Source
Information provided by the public sector, such as government public registrations.
First-Party Source
A statement by a merchant or its owner about their own information.
Third-Party Source
Public information provided by independent external sources.
Verification Principles
Build credible claims on verified facts, a traceable basis, and external corroboration.
Re-verification
The professional work of re-confirming that a fact is still valid, based on the information's timeliness.

FAQ

Q: What do the Official Source, First-Party Source, and Third-Party Source each provide?

A: The Official Source provides public registrations, the First-Party Source states its own information, and the Third-Party Source provides external corroboration. The sources have different viewpoints; read together, the facts are more complete.

Q: Why does verification have a barrier to entry?

A: Verification is a resource-intensive job with real scale and technical barriers. The IDAEO Verification Model is built on big data from Japan, Taiwan, and Hong Kong accumulated over the long term. It requires cross-checking Official Source, First-Party Source, and Third-Party Source data, continuous checking, and re-verification on expiry. Every conclusion must have supporting evidence. If conclusions change to suit the client, they violate the Law of Independent Verification.

Q: Why must verification go down to individual facts?

A: Each fact has its own verification result. AI cites individual details such as phone numbers, addresses, and business hours; each has a different basis and timeliness, so each must be verified separately.

Q: How do verification results stay valid?

A: Through continuous checking and re-verification on expiry. Brand and service information changes, so credible judgments must keep up with the facts.

Q: How does verification relate to S7?

A: Verification provides the benchmark for judging answer accuracy in S7. The details in AI answers must match verified facts to build credible brand perception.

Q: Where does a third-party verification page sit among the four ways AI mentions you?

A: It is way ④: when AI looks you up online, it reads facts someone has verified for you. Your website is the First-Party Source; a verification page from a Third-Party Source adds outside corroboration to the facts. See Figure 2-5.

This Chapter in Three Sentences

  1. Verify facts before making them available for AI to read.
  2. Verification combines Official Source, First-Party Source, and Third-Party Source information.
  3. Facts must be reverified when they are no longer current.

Three Things You Can Do This Week

  1. Select a merchant's claim and check its source.
  2. Compare the address on your website with registration records from the Official Source, and flag any discrepancies.
  3. Find an independent external source and confirm that it is not republishing your own claims.

Next ChapterIn the next chapter, you will learn how service tiers map to the journey.

Self-CheckPick one merchant claim and explain how First-Party Source information, external corroboration, and information timeliness together support a credible judgment.

Chapter 5

Service Tiers (How Far to Go): AEO Exposure — Get Read First; AEO+ Word of Mouth — Get Mentioned; IDA Brand PR — Accurate Answers, Visits, and Returns

This chapter answersWhich journey steps does each service tier cover, and how do you choose Performance Metrics?

Why it comes hereUnderstand the journey and verification first, then choose the service scope by marketing goal.

Figure 5-1 Service Tier Ladder: AEO Exposure, AEO+ Word of Mouth, IDA Brand PR

AEO Exposure — Get read first (S1–S4). AEO+ Word of Mouth — Get mentioned (S5–S6). IDA Brand PR — Accurate answers, visits, returns (S7–S10, including the first two tiers). Each higher service tier includes the previous tier, because later results build on the earlier foundation. For the steps it covers, each tier lists the number of Journey Diagnostics and IDAEO Solutions items. The Ten Diagnostic Gates are one per step; diagnostic items are the checks under each gate. IDA Brand PR covers the full journey (S1–S10). The bottom row shows, in order, First-Party Source + Official Source, IDA verification, and IDAEO verification. AEO+ Word of Mouth corresponds to AI mentioning you in its answers. Check the answer itself to see whether it recommends you. IDA Brand PR includes regularly published AI Visibility results. The AEO optimization in Figure 1-1, “Panorama of the Five Marketing Audiences,” is divided by function. The service tiers in this figure are divided by journey scope.

Service Tier Ladder: AEO Exposure, AEO+ Word of Mouth, IDA Brand PR Service tiers, strategy, and verification mapped to the ten steps
Figure 5-1 Service Tier Ladder: AEO Exposure, AEO+ Word of Mouth, IDA Brand PR
View as text

Start with the step ranges of AEO Exposure, AEO+ Word of Mouth, and IDA Brand PR; IDA Brand PR fully covers S1–S10. Then read down to the results and verification names for each segment.

④ Service Tiers
To which tier
Journey Steps
See Figure 2-1
Service Tiers
Numbers to watch
AEO Exposure
AEO+ Word of Mouth
IDA Brand PR
Verification
Links to Figure 4-1
Service tiers: deepening tier by tier along the journey steps
S1
Prepare
S2
Crawl
S3
Train
S4
Index
S5
Ask AI
S6
AI Mention
S7
AI Answer
S8
Act
S9
Visit
S10
Return
AEO Exposure | Read first
AI Readiness Score | AI Crawl Volume
AEO+ Word of Mouth
AI Real-Time Retrievals |

AI Mention Rate
IDA Brand PR | Right, visit, return
AI Answer Accuracy Rate | AI Citations | AI Agent Visits |
Search & AI Referral Visits | AI Return Visits
Covers every step
Full-Journey Coverage · S1–S10
First-Party Source + Official Source
IDA Verification
IDAEO Verification
Original framework © 2026
ID
EO
From Figure 0-3
Diagnostics
13
items
Diagnostics
4
items
Diagnostics
1
item
Diagnostics
1
item
Solutions
7
items
Solutions
2
items
Solutions
4
items
Diagnostics
6
items
Diagnostics
6
items
Diagnostics
1
item
Diagnostics
2
items
Diagnostics
1
item
Diagnostics
3
items
Diagnostics
4
items
Solutions
3
items
Solutions
2
items
Solutions
1
item

How to readStart with the step ranges of AEO Exposure, AEO+ Word of Mouth, and IDA Brand PR; IDA Brand PR fully covers S1–S10. Then read down to the results and verification names for each segment.

Figure 5-2 Performance Metrics Mapping Matrix

Each of the nine Performance Metrics lists its journey steps, diagnostic question, IDAEO Solutions, and data. AEO Exposure — Get read first (S1–S4). It builds an information base AI can use. AEO+ Word of Mouth — Get mentioned (S5–S6). It helps AI mention you in its answers. IDA Brand PR — Accurate answers, visits, returns (S7–S10, including the first two tiers). It supports credible answers, acting for customers, customer visits, and returns. Five metrics already have published all-platform figures, and the AI Readiness Score is scored merchant by merchant; the measurement methods for AI Mention Rate, AI Answer Accuracy Rate, and AI Return Visits are set, and the data will be published later.

Performance Metrics Mapping Matrix Nine Performance Metrics mapped to journey steps, diagnostic questions, IDAEO Solutions, and data
Figure 5-2 Performance Metrics Mapping Matrix
View as text

One metric per column; read down for the step, question, IDAEO Solutions, and data. Read each result according to its publication status.

Strategy
Links to Figure 5-1
Metric
Which step
Links to journey step
Journey Diagnostics
What to ask
IDAEO
Solutions
Verification data
As of 2026/10/8
AEO Exposure
AEO+ Word of Mouth
IDA Brand PR
AI ReadinessScore
AI CrawlVolume
AI Real-Time
Retrievals
AI MentionRate
AI AnswerAccuracy
AI Citations
AI Agent
Visits
Search & AIReferrals
AI ReturnVisits
S1
S2–S4
S5
S6
S7
S7
S8
S9
S10
Is the datacomplete?
Accessible?
Indexed?
Came toread?
Were youmentioned?
Did it getit right?
Is it cited?
Can it getit done?
Did theyshow up?
Did theycome back?
Readinesscheck
Engine
Repair plan
AI Access Rules
Visit Trail
Indexing Radar
Live Retrieval
Detection
Mention Probe
Answer Seat
Tracking
Fact Baseline
DiscrepancyAlert
CitationTracing
Agent Interface
Fulfillment
Integration
SourceAttribution
Return-visit ID
One scoreper merchant
0–100 points
97.46 million
Training +
Index
0.65M visits
AI pre-answer
site visits
Crawls
Scheduledlive tests
Same questions
Ask multiple AIs
Mention rank
Tracking
Line-by-linecheck
Cross-checked
Verified facts
Share correct
Tracking
31,711times
Copilot
Sourced answers
18.09M visits
Site visits
Completions
Trackingin Progress
309,826visits
from search or AI
Click-throughs
Returningcustomers
Same customer
asks again,
return visits
Tracking
Original framework © 2026
ID
EO
S1–S4 Read first
S5–S6 Named in the answer
S7–S10 Answered right, visit, return

How to readOne metric per column; read down for the step, question, IDAEO Solutions, and data. Read each result according to its publication status.

Key Points of This Chapter

ClaimWhy
Service tiers build on the earlier foundations: AEO Exposure — Get Read First (S1–S4), AEO+ Word of Mouth — Get Mentioned (S5–S6), and IDA Brand PR — Accurate Answers, Visits, and Returns (S7–S10, including the first two tiers), so the full journey S1–S10 is completely covered.AI Impressions come first; the rest of the journey follows. AEO Exposure turns the crawls in S2–S4 into accumulated AI Impressions; later mentions build word of mouth, and accurate answers and actions support brand choice.
Each higher service tier includes the tier below it.Word of mouth builds on exposure, brand PR builds on word of mouth, and the service extends step by step across the whole journey.
The nine Performance Metrics are AI Readiness Score, AI Crawl Volume, AI Real-Time Retrievals, AI Mention Rate, AI Answer Accuracy Rate, AI Citations, AI Agent Visits, Search & AI Referral Visits, and AI Return Visits.Each metric maps to a different result, linking service goals to acceptance criteria.
AEO+ Word of Mouth helps merchants stay on top of AI mentions; IDA Brand PR includes the AI Visibility results IDAEO publishes periodically.The service expands with brand goals, and everything from first contact to choice can be measured.

Terms

AEO Exposure — Get Read First (S1–S4)
A service plan covering S1–S4, with the goal of getting content read first. Mentions in answers belong to AEO+ Word of Mouth (S5–S6); being listed as a source belongs to S7.
AEO+ Word of Mouth — Get Mentioned (S5–S6)
The service tier covering S5–S6. It builds word of mouth by having AI mention you in its answers. Whether AI recommends you requires a separate check of the answer content. Word of mouth in the AI era = AI speaking for you (AI Word of Mouth).
IDA Brand PR — Accurate Answers, Visits, and Returns (S7–S10, Including the First Two Tiers)
Focuses on S7–S10 and includes the first two tiers, so the full journey S1–S10 is completely covered. The service tier that supports brand choice through credible answers, acting for customers, and customer return. This is the name of the highest service tier. In the book title, IDA means Identity Data Authority. In the verification model, IDA Verification is a method. These three uses share the name IDA but differ in scope.
AI Readiness Score
How well prepared a merchant is at S1, scored 0–100.
AI Mention Rate
The share of the same set of questions in which AI mentions the merchant.
Performance Metrics
The nine measures that correspond to the results of each journey step.
AI Citations
The number of times AI answers list your content as a source.

FAQ

Q: Is AEO (the optimization domain) in Chapter 1 the same as the service tiers here?

A: “AEO” as an optimization domain is one of the Six Optimization Domains; “AEO Exposure” is the first service tier and, together with “AEO+ Word of Mouth” and “IDA Brand PR,” makes up the three tiers. Optimization Domains are divided by function; service tiers are divided by journey scope. In the market, AEO often means getting content used or cited by answer engines. That is its meaning as an optimization domain and cannot be treated directly as a result of the first service tier. AEO Exposure only covers getting read first (S1–S4). Mentions in answers belong to AEO+ Word of Mouth (S5–S6); being listed as a source belongs to S7.

Q: Do all nine metrics have data yet?

A: Five metrics already have published all-platform figures, and AI Readiness Score is scored store by store; the measurement methods for AI Mention Rate, AI Answer Accuracy Rate, and AI Return Visits are set, and their data will be published later. The statistical scopes differ, so read per-store scores and all-platform results each on their own basis.

Q: Which tier should you start planning from to cover the journey most completely?

A: Start from IDA Brand PR: it focuses on S7–S10, includes the first two tiers, and fully covers the whole journey S1–S10; later results build on the earlier foundations. When planning, link AEO Exposure, AEO+ Word of Mouth, and IDA Brand PR, and use Figure 2-2, “Journey Diagnostics Gate Map,” to confirm how each step connects.

Q: How do service tiers extend with brand goals?

A: Arrange them by the brand's current goal: build AI exposure, build word of mouth from AI mentions, or extend to credible answers, acting for customers, and customer return. The goal sets the journey scope, and service tiers and Performance Metrics must be planned together.

Q: Which of the nine metrics should you look at first?

A: Start with the metric that matches the journey step you are evaluating now. Information preparation, AI mentions, and customer visits each have their own results, so choosing the right metric is what lets you judge progress.

This Chapter in Three Sentences

  1. Services have three tiers: AEO Exposure covers S1–S4, AEO+ Word of Mouth covers S5–S6, and IDA Brand PR covers S1–S10.
  2. Each higher service tier includes the previous tier and extends journey coverage to match the brand's goals.
  3. Nine Performance Metrics map to the diagnostic questions at each step, linking service goals to evidence for assessing results.

Three Things You Can Do This Week

  1. Use the Journey Diagnostics questions to identify where your business is currently stuck.
  2. Based on your current Marketing goals, decide whether to focus first on exposure, mentions, or customer referrals.
  3. Choose the Performance Metrics that match the journey steps you want to assess.

Next ChapterThe next chapter presents measured figures for each of the Performance Metrics and explains how to interpret them.

Self-CheckA store wants AI to mention its brand in answers. Name the matching service tier, Performance Metrics, and journey step.

Chapter 6

Performance Measurement (How to Count Results): AI Impressions and Full-Journey Value

This chapter answersWhat results do AI impressions, AI Content Use, and site visits each represent?

Why it comes hereOnly by matching each step's value with its statistical basis can you read the numbers as marketing results.

Figure 6-1 Full-Journey Performance Dashboard: Eight Measured Figures and First-Party Data

Each cell lists AI results by step; the bottom row is IDAEO First-Party Data (as of Oct 8, 2026; indexed page counts are for September). The marketing meaning of AI Crawl Volume is AI Impressions. “Reads for AI Answers,” AI Crawl Volume, and AI Real-Time Retrievals cover overlapping ranges; each cell is listed separately by source and unit (requests, times, pages, clicks), and is suited to comparison on the same basis.

Full-Journey Performance Dashboard: Eight Measured Figures and First-Party Data Three categories of performance metrics, each matched to what it measures
Figure 6-1 Full-Journey Performance Dashboard: Eight Measured Figures and First-Party Data
View as text

Read down: Performance Metrics, the three categories, measurement targets, and figures; each cell is one kind of result.

⑤ PerformanceMeasurement
Counting results
Performance Metrics: AI content use at every step is a result
Three types
Result: AI Content Use
Background: Search
Visit
What is measured
AI CrawlVolume
Reads for AI
answers
AI Real-Time
Retrievals
AI Citations
AI Agent
Visits
Indexed pages
Search results
shown
Search & AIReferralVisits
First-Party Data
IDAEO measurements
97.46
million
S2–S4
from 3/3
46.05
million
Search + AI
from 3/3
0.65
million
S5 | from 3/3
31.7K
times
S7 | Copilot
from 7/22
18.09
million
S8 | from 8/26
Bing
pages
Google
pages
8.22
million
Google+Bing
310K
visits
S9 | from 8/26
Original framework © 2026
ID
EO
From Figure 0-2
AI Impressions come first; the rest of the journey follows.
AI Impressions
375K
282K
Sep
~

How to readRead down: Performance Metrics, the three categories, measurement targets, and figures; each cell is one kind of result.

Figure 6-2 Ten-Step Results Overview

Ten-Step Results Overview Overview of the ten steps, showing the measured results of each step
Figure 6-2 Ten-Step Results Overview
View as text

Read the ten steps from left to right; the thicker the bar, the larger the volume. The gray area is inside the AI Platforms, and measured results keep accumulating. S6 in the figure is search impressions (not AI mentions): the number of times search results list you. The mention rate in AI answers will be published later.

Ten-step overview: how much each step retains (2026/3/3–10/8)
Process inside AI Platforms; public results tracked continuously
S1
Prepare
196,702,526 requests
S2
Crawl
105,487,618 requests
S3
Copies back for training
52,203,119 requests
S4
Index
45,253,224 requests
657,000 pages indexed
S5
Someone asks AI
650,528 requests
S6
AI Mention
about 8.22 million times
S7
AI Answer
31,711 times
S8
Acts for customers
18,091,884 requests
S9
Visit
309,826 clicks
Organic Traffic
S10
Return
Tracking in Progress
Share of site-wide
53.6%
26.5%
23.0%
0.33%
9.20%
Bar width scales with the square root of request volume; gray bars show pages, counts, or clicks; dashed lines show the observed outline.
Site-wide requests from 2/12; crawler requests from 3/3. Each step is shown on its own basis.
ID
EO
Ten-Step Results Overview
ItemValueUnit
Prepare196,702,526requests
Crawl105,487,618requests
Copies back for training52,203,119requests
Index45,253,224requests
pages indexed657,000pages
Someone asks AI650,528requests
AI Mentionabout 8.22 milliontimes
AI Answer31,711times
Acts for customers18,091,884requests
Visit309,826clicks
CSV

How to readRead the ten steps from left to right; the thicker the bar, the larger the volume. The gray area is inside the AI Platforms, and measured results keep accumulating. S6 in the figure is search impressions (not AI mentions): the number of times search results list you. The mention rate in AI answers will be published later.

Figure 6-3 AI Visit Structure Map: Who Comes and What They Come to Do

Extended figures: Figure 6-3, “AI Visit Structure Map,” shows who comes and what they come to do; Figure 6-4, “Full-Journey Outcomes Flow Map,” lays out arrivals, indexing, display, citations, and visits along S1–S10.

AI Visit Structure Map: Who Comes and What They Come to Do Traffic distributed by Marketing Audiences and function
Figure 6-3 AI Visit Structure Map: Who Comes and What They Come to Do
View as text

Follow the bands: Marketing Audiences on the left, functions on the right; the thicker the band, the larger the volume.

Traffic journey: who comes and what they do
2026/3/3–10/8 · 197 million site-wide requests · 105 million classified as AI
Who comes
13 source types · numbers are request counts and share of site-wide total
What they do
9 purpose types · by journey stage
S1 Prepare
S2 Crawl
Our website 197 million requests
Apple
24.62 million · 12.5%
Anthropic
24.49 million · 12.5%
AI Agents (automated browsing)
17.95 million · 9.1%
Microsoft
12.05 million · 6.1%
OpenAI
12.00 million · 6.1%
Meta
11.58 million · 5.9%
Amazon
5.45 million · 2.8%
Google
3.41 million · 1.7%
Our AI Search
2.82 million · 1.4%
Other platforms combined
1.83 million · 0.93%
AI Tools
7.08 million · 3.6%
Tracking in Progress
150,000 · 0.08%
Remaining traffic
73.27 million · 37.2%
S3 Train
52.20 million · 26.5%
S4 Index
Builds AI index
3.99 million · 2.0%
S4 Index
Search index + AI Overviews
41.26 million · 21.0%
S5 Ask (AI real-time retrieval)
650,000 · 0.33%
S8 Act
Errands, lookups; browsing
18.09 million · 9.2%
S9 Visit (Organic Traffic)
309,826 visits
Referrals separate (197M requests)
AI Tools
7.08 million · 3.6%
Tracking in Progress
150,000 · 0.08%
Remaining traffic
73.27 million · 37.2%
Flow width = square root of the exact request count; the thinnest flow is drawn at 1.5px (1.5px is the minimum line width). Large numbers in the figure are rounded. S8 includes acting for people, checking addresses, and automated browsing.
Data period: records 2026/3/3–10/8; automated browsing 2026/8/26–10/8; total site traffic 2026/2/12–10/8.
S6, S7, and S10 take place inside AI Platforms and with the customer; they are tracked by direct measurement, see Figure 3-2.
ID
EO
AI Visit Structure Map: Who Comes and What They Come to Do
ItemValue
Apple24.62 million · 12.5%
Anthropic24.49 million · 12.5%
AI Agents (automated browsing)17.95 million · 9.1%
Microsoft12.05 million · 6.1%
OpenAI12.00 million · 6.1%
Meta11.58 million · 5.9%
Amazon5.45 million · 2.8%
Google3.41 million · 1.7%
Our AI Search2.82 million · 1.4%
Other platforms combined1.83 million · 0.93%
AI Tools7.08 million · 3.6%
Tracking in Progress150,000 · 0.08%
Remaining traffic73.27 million · 37.2%
S3 Train52.20 million · 26.5%
Builds AI index3.99 million · 2.0%
Search index + AI Overviews41.26 million · 21.0%
S5 Ask (AI real-time retrieval)650,000 · 0.33%
S8 Act18.09 million · 9.2%
S9 Visit (Organic Traffic)309,826 visits
CSV

How to readFollow the bands: Marketing Audiences on the left, functions on the right; the thicker the band, the larger the volume.

Figure 6-4 Full-Journey Outcomes Flow Map: From AI Exposure to Customer Visits

Full-Journey Outcomes Flow Map: From AI Exposure to Customer Visits Site-wide traffic split by AI Platforms and purpose, ending in Organic Traffic
Figure 6-4 Full-Journey Outcomes Flow Map: From AI Exposure to Customer Visits
View as text

Read from left to right: total site traffic → each AI platform → purpose → Organic Traffic; the thicker the band, the larger the volume, and purposes are ordered by journey step.

Full flow: traffic → AI Platforms → purpose → Organic Traffic
2026/3/3–10/8 · 197 million requests · 105 million classified AI · one color each
Total site traffic
All requests
AI Platforms by company
13 source types · requests, % of total
Purpose
8 types · ordered by journey stage
Total site traffic
197 million
Requests
Anthropic 24.49 million · 12.5%
OpenAI 12.00 million · 6.1%
Amazon 5.45 million · 2.8%
Apple 24.62 million · 12.5%
Meta 11.58 million · 5.9%
Microsoft 12.05 million · 6.1%
Our AI Search 2.82 million · 1.4%
Google 3.41 million · 1.7%
Other platforms combined 1.83 million · 0.93%
AI Agents (browsing) 17.95 million · 9.1%
AI tools 7.08 million · 3.6%
Tracking in Progress 150,000 · 0.08%
Remaining traffic 73.27 million · 37.2%
S3 Train
52.20 million · 26.5%
S4 Index
Builds AI index
3.99 million · 2.0%
S4 Index
Search index + AIO
41.26 million · 21.0%
S5 Ask (AI real-time retrieval)
650,000 · 0.33%
S8 Act
Errands, lookups; browsing
18.09 million · 9.2%
AI Tools
7.08 million · 3.6%
Tracking in Progress
150,000 · 0.08%
Remaining traffic
73.27 million · 37.2%
S9 Visit
Organic Traffic 309,826 visits
Search/AI clicks, separate
Yahoo Japan
10,278 · 3.3%
DuckDuckGo
1,049 · 0.34%
Baidu
713 · 0.23%
Meta
9,388 · 3.0%
Microsoft
20,053 · 6.5%
Google
267,734 · 86.4%
Other sources
611 · 0.20%
Flow width = exact request count, linear; thinnest flow 1.5px (1.5px minimum width); first three columns are requests, Organic Traffic separate. Dashed lines mark same-name AI Platforms.
Data period: records 2026/3/3–10/8; automated browsing 2026/8/26–10/8; total site traffic 2026/2/12–10/8. Large numbers are rounded.
ID
EO
Full-Journey Outcomes Flow Map: From AI Exposure to Customer Visits
ItemValue
Anthropic24.49 million · 12.5%
OpenAI12.00 million · 6.1%
Amazon5.45 million · 2.8%
Apple24.62 million · 12.5%
Meta11.58 million · 5.9%
Microsoft12.05 million · 6.1%
Our AI Search2.82 million · 1.4%
Google3.41 million · 1.7%
Other platforms combined1.83 million · 0.93%
AI Agents (browsing)17.95 million · 9.1%
AI tools7.08 million · 3.6%
Tracking in Progress150,000 · 0.08%
Remaining traffic73.27 million · 37.2%
S3 Train52.20 million · 26.5%
Builds AI index3.99 million · 2.0%
Search index + AIO41.26 million · 21.0%
S5 Ask (AI real-time retrieval)650,000 · 0.33%
S8 Act18.09 million · 9.2%
Organic Traffic309,826 visits
Yahoo Japan10,278 · 3.3%
DuckDuckGo1,049 · 0.34%
Baidu713 · 0.23%
Meta9,388 · 3.0%
Microsoft20,053 · 6.5%
Google267,734 · 86.4%
Other sources611 · 0.20%
CSV

How to readRead from left to right: total site traffic → each AI platform → purpose → Organic Traffic; the thicker the band, the larger the volume, and purposes are ordered by journey step.

Figure 6-5 Journey Results Comparison of Nine AI Platforms

Journey Results Comparison of Nine AI Platforms Same-scale comparison of each platform's crawl volume and referral results
Figure 6-5 Journey Results Comparison of Nine AI Platforms
View as text

One platform per panel; read each step's results from left to right. Compare across panels using the same column and the same unit.

Nine funnels: reads → actions → results → Organic Traffic
2026/3/3–10/8 · top nine AI Platforms by crawl volume · one scale
Brand color = requests Hatched = pages/counts Gray = Organic Traffic
Apple
Crawl volume #1
24.62 million requests
Total · req.
Action · req.
Results · #
S9 Visit
AI share
23.3%
S2
24.62M
S3
—
S4
24.62M
S5
—
S6
—
S7
—
S8
—
—
Tracking
Requests vs arrivals
S10 Return: Tracking
Anthropic
Crawl volume #2
24.49 million requests
Total · req.
Action · req.
Results · #
S9 Visit
AI share
23.2%
S2
24.49M
S3
24.48M
S4
11,000
S5
2,494
S6
—
S7
—
S8
—
—
Tracking
Requests vs arrivals
S10 Return: Tracking
Microsoft
Crawl volume #3
12.05 million requests
Total · req.
Action · req.
Results · #
S9 Visit
AI share
11.4%
S2
12.05M
S3
—
S4
12.05M
S5
—
S6
—
S7
31,711
S8
—
20,000
Share 6.5%
Requests vs arrivals
S10 Return: Tracking
OpenAI
Crawl volume #4
12 million requests
Total · req.
Action · req.
Results · #
S9 Visit
AI share
11.4%
S2
12M
S3
10.6M
S4
761,000
S5
635,000
S6
—
S7
—
S8
—
—
Tracking
Requests vs arrivals
S10 Return: Tracking
Meta
Crawl volume #5
11.58 million requests
Total · req.
Action · req.
Results · #
S9 Visit
AI share
11.0%
S2
11.58M
S3
11.58M
S4
—
S5
—
S6
—
S7
—
S8
—
9,388
Share 3.0%
Requests vs arrivals
S10 Return: Tracking
Amazon
Crawl volume #6
5.45 million requests
Total · req.
Action · req.
Results · #
S9 Visit
AI share
5.2%
S2
5.45M
S3
5.45M
S4
—
S5
—
S6
—
S7
—
S8
—
—
Tracking
Requests vs arrivals
S10 Return: Tracking
Google
Crawl volume #7
3.56 million requests
Total · req.
Action · req.
Results · #
S9 Visit
AI share
3.4%
S2
3.56M
S3
—
S4
3.41M
S5
474
S6
—
S7
—
S8
—
268,000
Share 86.4%
Requests vs arrivals
S10 Return: Tracking
Our AI Search
Crawl volume #8
2.82 million requests
Total · req.
Action · req.
Results · #
S9 Visit
AI share
2.7%
S2
2.82M
S3
—
S4
2.82M
S5
—
S6
—
S7
—
S8
—
—
Tracking
Requests vs arrivals
S10 Return: Tracking
Yandex
Crawl volume #9
511,000 requests
Total · req.
Action · req.
Results · #
S9 Visit
AI share
0.5%
S2
511,000
S3
—
S4
511,000
S5
—
S6
—
S7
—
S8
—
—
Tracking
Requests vs arrivals
S10 Return: Tracking
S2 Crawl → S3 Train → S4 Index → S5 Ask
S6 Mention → S7 Answer → S8 Act → S9 Visit → S10 Return
S4 indexed pages in September 2026: Google 282,000, Microsoft 375,000; S6 search impressions about 8.22 million, per-platform breakdown still being tracked.
S7 Copilot answer citations 31,711 (7/22–10/8); S9 Organic Traffic 309,826. Only approved per-platform breakdowns are shown.
Bar length = √count, same scale in all nine cells; share denominator = AI total 105,487,618. Requests, pages, counts, and arrivals each use their own units.
ID
EO
Journey Results Comparison of Nine AI Platforms
ItemTotal · req.S3S4S5S7S9 VisitAI share
Apple24.62 million requests—24.62M———23.3%
Anthropic24.49 million24.48M11,0002,494——23.2%
Microsoft12.05 million—12.05M—31,71120,00011.4%
OpenAI12 million10.6M761,000635,000——11.4%
Meta11.58 million11.58M———9,38811.0%
Amazon5.45 million5.45M————5.2%
Google3.56 million—3.41M474—268,0003.4%
Our AI Search2.82 million—2.82M———2.7%
Yandex511,000—511,000———0.5%
CSV

How to readOne platform per panel; read each step's results from left to right. Compare across panels using the same column and the same unit.

Figure 6-6 Cold Start Timeline: AI Platforms Arriving in Sequence and the Early-Mover Dividend

Cold Start Timeline: AI Platforms Arriving in Sequence and the Early-Mover Dividend Cold start and early dividends: the rhythm in which AI platforms arrive one after another
Figure 6-6 Cold Start Timeline: AI Platforms Arriving in Sequence and the Early-Mover Dividend
View as text

Each row is one of the AI Platforms, with time on the horizontal axis. The 30–35 days is the gap between the first crawler and the next from the same platform. This is an observation from a single site; for three platforms, the interval is a lower bound. Figure 7-1, “IDAEO Growth Milestones,” shows this site's cumulative volume. Records before Aug 24 may include duplicate requests. Arrival records are still needed to assess whether earlier readiness leads to earlier accumulation.

Cold Start Timeline: AI Platforms arrive in sequence; the earlier you are ready, the earlier you accumulate
2026/3/3–10/8 · 6 AI platforms with two or more crawlers, sorted by the first crawler's first day · dot = first-seen date (color = purpose, size = total requests)
Large number on the arc = days between the two first appearances; prior requests in the right column · right column = summary of the next crawler after measurement began
OpenAI
+30 days or more
Anthropic
+31 days or more
Perplexity
+35 days or more
DuckDuckGo
+30 days
Google
+31 days
Our AI Search
+70 days
Five of the six fall within 30–35 days; the one with a 3/3 first day is a lower bound.
AI traffic has an early-mover dividend: the earlier you are ready, the earlier you accumulate. AI platforms send their next crawler only about 30 days after the first.
Cold Start
AI traffic accumulates from 0; industry rule of thumb: about 90 days.
Even with S1 fully prepared, AI platforms still arrive in sequence.
Warm Start
Content meets S1 and goes live on an AI Traffic Hub; rule of thumb: about 30 days.
TK Lin's IDA: reached S7 (AI Answer) in 14 days.
AI Platforms
First crawler → next crawler after measurement began
3/3
Apr
May
Jun
Jul
Aug
Sep
10/8
Platform-verified AI ID from 8/24 ▸
OpenAI
3 crawlers · 12 million total
Training/real-time:
Present at start
30+ days
Training crawler ≤3/3
Real-time crawler 3/5
Search crawler 4/2
+30 days or more
First new arrival after measurement began: search crawler
First seen 4/2 · 30 days or more after the first
237,000+ prior requests
Real-time crawler: 40 times in the first week
Anthropic
5 crawlers · 24.49 million total
31+ days
+12 days
+47 days
+1 day
Training crawler ≤3/3
Real-time crawler 4/3
Search crawler 4/15
Unclassified crawler 6/1
Unclassified crawler 6/2
+31 days or more
Training crawler → real-time crawler
905+ prior requests (training crawler 905)
Real-time crawler: 57 times in the first week
Third: search crawler 4/15
+43 days or more · 4,687+ prior requests
Fourth: unclassified crawler 6/1
+90 days or more · 2.01M+ prior requests
Fifth: unclassified crawler 6/2
+91 days or more · 2.06M+ prior requests
Perplexity
2 crawlers · 229,000 total
35+ days
Search crawler ≤3/3
Real-time crawler 4/7
+35 days or more
Search crawler → real-time crawler
4,864+ prior requests (search crawler 4,864)
Real-time crawler: 2 times in the first week
DuckDuckGo
2 crawlers · 14,000 total
+30 days
Search crawler 3/5
Q&A crawler 4/4
+30 days
Search crawler → Q&A crawler
28 prior requests (search crawler 28)
Q&A crawler: 4 times in the first week
Google
5 crawlers · 3.56 million total
+31 days
+37 days
+25 days
+74 days
Search crawler 3/11
Note-organizing crawler 4/11
Deep research crawler 5/18
General bot 6/12
Image crawler 8/25
+31 days
Search crawler → note-organizing crawler
127,000 prior requests (search crawler 127,000)
Note-organizing crawler: 2 times in the first week
Third: deep research crawler 5/18
+68 days after the first · 365,000 prior requests
Fourth: general-purpose crawler 6/12
+93 days after the first · 995,000 prior requests
Fifth: image crawler 8/25
+167 days after the first · 2.39M prior requests
Our AI Search
2 crawlers · 2.82 million total
+70 days
Index crawler 6/26
Cross-site index crawler 9/4
+70 days
Index crawler → Cross-site index crawler
2.81 million prior requests (index crawler 2.81 million)
Cross-site index crawler first week 2,213 requests
AI Platforms with only one crawler (26, by first day)
Microsoft search ≤3/3
Yandex search ≤3/3
ByteDance search ≤3/3
Amazon training 3/5
Apple search crawler 3/11
You.com search 4/1
Baidu search 4/4
Common Crawl training 4/9
Brave search 4/10
Cohere unclassified 5/5
Huawei search crawler 5/6
Kagi search 5/16
Meta training 6/14
Sogou search 6/26
TollBit task 6/26
Task-tool platform 6/26
Linkup search 7/31
DeepSeek unclassified 8/7
Yahoo Japan search 8/7
Parallel index 8/24
Japan informatics institute 8/25
Auto-detected AI task 8/26
Golemreach page-check 8/26
Mistral real-time 8/29
Japan research institute 8/29
Andi page-check 9/17
Use
Training
Index
Someone asks AI
Crawl
Tracking in Progress
Hollow = present at start; 3/3 is a lower bound
Dashed = first seen after verification
Data: daily requests 2026/3/3–10/8; each dot is placed by the crawler’s first day, sized by the log of total requests.
First day 3/3 is the measurement start; days since then and prior requests are lower bounds.
From 8/24, platform-verified AI identities are used; dashed circles mark the first appearance after verification was enabled.
Family totals combine different crawlers from the same AI platform; AI tools and Tracking in Progress are listed separately.
ID
EO

How to readEach row is one of the AI Platforms, with time on the horizontal axis. The 30–35 days is the gap between the first crawler and the next from the same platform. This is an observation from a single site; for three platforms, the interval is a lower bound. Figure 7-1, “IDAEO Growth Milestones,” shows this site's cumulative volume. Records before Aug 24 may include duplicate requests. Arrival records are still needed to assess whether earlier readiness leads to earlier accumulation.

Key Points of This Chapter

ClaimWhy
AI Content Use at every stage counts as a result. Results at each stage must be assessed separately; an earlier stage cannot stand in for a later one.S1–S8 and website visits each reflect different kinds of progress. More reads do not mean more citations or customer actions. Totals from live tests of industry websites: 37,793 Copilot citations from April to September. Bing search clicks totaled 10,177. Both figures come from Microsoft, but their units and reporting periods differ. They should be interpreted separately.
An AI Crawl Volume of 97.46 million is what this book calls AI Impressions. This includes reads by search engines for indexing.Each time AI or a search engine reads your content, this book counts it as one AI impression. This reflects the number of reads. It does not mean the content has been used for training, indexed, mentioned, or cited. This is exposure to AI, not how many people saw it.
Reads for AI Answers, 46.05 million, include reads for search indexing and AI answers.These reads are grouped by purposes related to search and AI answers. This classification does not mean the content has appeared in search results or AI answers.
AI Real-Time Retrievals, 650,000, are content use triggered by immediate demand.AI fetches information on the spot in response to a question; this metric reflects customers' immediate needs.
The IDAEO platform's 31,700 AI Citations mean its content was listed as a source in answers.This is Copilot's citation result for the IDAEO platform since Jul 22. Being listed as a source does not mean customers have made decisions based on the content.
AI Agent Visits, 18.09 million, represent the volume of site arrivals. Whether actions were completed on customers' behalf still depends on subsequent results.AI Agents have begun visiting sites, and their visit volume remains under tracking. Of this, automated browsing accounts for 17.95 million (counted from Aug 26), and named AI Agents for 144,000. Visit volume shows the scale of contact, while task outcomes are read from subsequent actions.
Search & AI Referral Visits, 310,000 (search and AI combined; Google 268,000), represent customers arriving at the site via search or AI.This metric corresponds to S9, linking upstream AI Content Use with customer action.
Cold Start: AI traffic accumulates from 0; the industry rule of thumb is about 90 days.A new website has to wait for AI Platforms to find it one by one. With S1 ready, arriving crawlers have content to read. Figure 7-1, “IDAEO Growth Milestones,” records this site's request volume: 53 requests on the first day, Mar 3 → 635,000 in March → 16.07 million in June → 35.99 million requests in August. Records before Aug 24 may include duplicate requests. September was lower than August; check that counting methods are consistent before comparing months.
Warm Start: content meets S1 and goes live on an AI Traffic Hub. The rule of thumb is about 30 days, not a deadline for crawler arrival. A separate Cold Start observation from a single site found a gap of 30–35 days before the next crawler from the same platform (Figure 6-6). For three platforms, this is a lower bound and cannot be used to estimate Warm Start timing. TK Lin's personal IDA case reached S7 (Answer) in 14 days.Content published on the hub is available for existing crawlers to read. Whether it gets used sooner still requires separate evidence from the records. TK Lin's personal IDA, measured: on launch day, Sep 20, AI citations were 0. On Oct 3, a live test covered 100 questions across five AI models. This IDA appeared in AI search source lists for 84% of answers (four of the five models used the same search interface; the questions named the author himself; a single case). It appeared more often than any other source.
The necessary condition for an AI Traffic Hub is accumulating ten million or more AI requests per month.Existing request volume reflects the scale of reads on the platform. The IDAEO platform (idaeo.ai) is an AI Traffic Hub. The IDAEO platform: 25.97 million in July, 35.99 million in August, 15.79 million in September. September was lower than August. Records before Aug 24 may include duplicate requests; check that counting methods are consistent before comparing months. These are monthly platform totals and cannot predict when new content will be read.
The early-mover dividend in AI traffic means preparing information early so arriving crawlers can read it.When a merchant has its information ready in advance, AI Platforms have content to read when they arrive. Figure 6-6, “Cold Start Timeline,” records arrivals at this site. For five of the six AI Platforms, the gap between the first crawler and the next was 30–35 days. For three platforms, this is a lower bound. It cannot be generalized into an arrival pattern for all websites. If a site goes live early but no crawlers read it, there is no evidence of earlier accumulation.
Compounding Lead is currently a hypothesis: whether accumulating AI impressions can widen a lead remains to be verified.Reads for training or indexing do not mean the content has been used for training or indexed. The cumulative volume in Figure 7-1, “IDAEO Growth Milestones”: 635,000 by the end of March → 21.4 million by the end of June → 99.15 million by the end of September → 105.5 million cumulative as of Oct 8 (including AI, search engines, and Automated Bots; these are platform-site volumes and cannot be compared directly with a single merchant's website). Records before Aug 24 may include duplicate requests. This is the site's cumulative record; it does not prove that its lead has widened. Testing Compounding Lead requires comparing comparable subjects using the same counting method. If content use does not increase and the gap does not widen, the hypothesis is not supported.

Cold Start and Warm Start

Cold StartWarm Start
Starting pointAI traffic accumulates from 0.Content plugs into the existing traffic of an AI Traffic Hub.
PrerequisitesS1 data is complete, so AI that arrives can get the content.Content meets S1; the hub accumulates tens of millions of AI requests every month.
How longIndustry rule of thumb: about 90 days.Rule of thumb: about 30 days; TK Lin’s personal case reached S7 in 14 days.
Measured resultsMar 3, day one: 53 requests → 635,000 cumulative by end of March → 21.4 million by end of June → 99.15 million by end of September. Figures before Aug 24 may include duplicate requests.TK Lin’s personal IDA: launched Sep 20; tested on Oct 3. This IDA appeared in AI search source lists for 84% of answers (a single case).
What merchants doGet S1 ready and go live as early as possible; keep accumulating AI impressions.Publish content that meets S1 on an AI Traffic Hub.
Effect of timeWhether launching earlier can widen the lead remains to be tested.The hub's existing crawlers can read the content. Actual results still need to be observed.

Terms

AI Content Use
Use of content in AI reading, answer citations, and acting on customers' behalf.
AI Crawl Volume
S2–S4 are the steps in which AI and search engines obtain content. They cover crawls for training, AI indexing, and search indexing, totaling 97.46 million. These count only as reads for training or indexing. They do not mean the content has been used in training or indexed. There are also 650,000 real-time retrievals, 144,000 reads by named AI Agents, and 7.23 million by Automated Bots. Together, these total 105.5 million reads by AI, search engines, and Automated Bots. Figures before Aug 24 may include duplicate requests.
AI Impressions
Each time AI or a search engine reads your content is one AI impression; AI Impressions are the marketing meaning of AI Crawl Volume. This is exposure to AI—each time AI reads you counts as one, not how many people saw it.
Reads for AI Answers
The number of reads that serve search results and AI answers.
Cold Start
AI traffic accumulates from 0; the industry rule of thumb is about 90 days.
Warm Start
Content meets S1 and goes live on an AI Traffic Hub. Rule of thumb: about 30 days; TK Lin's personal IDA case reached S7 (Answer) in 14 days.
AI Traffic Hub
A platform that already has a large volume of AI requests; content connects to existing AI traffic as soon as it goes live. Necessary condition: ten million or more AI requests accumulated per month. The IDAEO platform (idaeo.ai) is an AI Traffic Hub.
Search & AI Referral Visits
This book measures it as the number of times customers click through to the website via search or AI.
Compounding Lead
Compounding Lead. The hypothesis that accumulated AI impressions may increase subsequent content use and widen the lead. Testing it requires consistent measurement and comparable subjects. An increase in cumulative volume alone does not prove that the lead has widened.

FAQ

Q: What is the difference between the 52.2 million reads crawled for training and real-time retrievals?

A: Training reads are reads for training. They do not mean the content has been used in training. Real-time retrievals respond to a customer's question at that moment. Their triggers and uses differ, so they should be interpreted separately.

Q: Does 97.46 million mean more than ninety million people saw it?

A: The 97.46 million is this book's AI Impressions figure. The unit is reads, counting the number of times AI and search engines read the content. A read means a machine has retrieved the content. It does not mean the content has been used in training, indexed, mentioned, or cited. This is exposure to AI, not a count of people who saw it.

Q: Why are reads for search and for AI answers counted together?

A: “Reads for AI Answers” totals the reads for use in search results and AI answers. It shows the volume of reads, not whether the content has been used in an answer. Compare it with answer citations and customer visits to assess each downstream result separately.

Q: What do the IDAEO platform's AI Citations of 31,700 mean?

A: These are citations of the IDAEO platform by Copilot since Jul 22. Figures from other platforms will be published later. Each platform discloses figures for its own scope and period, so citation volume has to be read together with its source.

Q: How long does a new website wait for AI?

A: The rule of thumb for a Warm Start is about 30 days; the industry rule of thumb for a Cold Start is about 90 days. These estimates are not deadlines for crawler arrivals. A separate single-site Cold Start observation found intervals of 30–35 days before the next crawler from the same AI platform arrived. The figures for three platforms are lower bounds and cannot be used to estimate Warm Start timing. TK Lin's personal IDA case reached S7 in 14 days. It went live on Sep 20 and was tested on Oct 3 across 100 questions and five AI models. The day count includes both the launch date and the test date. This IDA appeared in AI search source lists for 84% of answers; this is a single case. A Cold Start accumulates from 0, waiting for AI platforms to arrive one after another. A Warm Start puts content live on an AI Traffic Hub, where existing crawlers can read it. Actual arrival times still need to be observed.

Q: What kind of platform counts as an AI Traffic Hub?

A: The necessary condition listed in this book is ten million or more AI requests accumulated per month. The IDAEO platform (idaeo.ai) is an AI Traffic Hub. The IDAEO platform: 25.97 million in July, 35.99 million in August, 15.79 million in September. September was lower than August. Figures before Aug 24 may include duplicate requests, so comparisons across months require checking the counting methods. These are platform-wide monthly totals and cannot directly predict when crawlers will reach new content.

Q: How do you keep performance assessment close to business results?

A: Look at impressions, mentions, trusted answers, and S9 Visit together, and watch for returns. Goodhart's Law in Figure 8-2 “IDAEO Theoretical Foundations Map” states that once a single metric becomes the target, it gets distorted; only by cross-referencing multiple results do you get a complete judgment.

Q: What can a merchant do first during a Cold Start?

A: Get S1 ready first and go live as early as possible, so visiting AI can read the content. Whether reads increase subsequent content use remains to be seen; Compounding Lead is currently a hypothesis. You can also put the prepared content live on an AI Traffic Hub for existing crawlers to read. See Figure 7-1 for cumulative volume. The total includes AI, search engines, and Automated Bots. Figures before Aug 24 may include duplicate requests. This is a platform site's cumulative record and cannot be compared directly with a single merchant's website.

This Chapter in Three Sentences

  1. Reads, citations, and customer visits are outcomes at different stages.
  2. Before comparing figures, align the subjects, periods, and units.
  3. A Cold Start and a Warm Start have different starting points. Timelines from individual cases are not guarantees.

Three Things You Can Do This Week

  1. Check that your website's information is complete. Fill in any gaps and publish the updates.
  2. Label your performance records with their sources, periods, and units.
  3. Organize records of reads, answer citations, customer visits, and return visits separately.

Next ChapterThe next chapter presents records from the IDAEO site and early field-test merchants. It also explains how to understand what the statistics cover.

Self-CheckWhich journey steps do the eight measured figures in Figure 6-1 “Full-Journey Performance Dashboard” correspond to? Explain the marketing meaning of AI Impressions, AI Citations, and Search & AI Referral Visits; compare the starting point, prerequisites, and time required for a Cold Start and a Warm Start, and explain why AI Agent Visits are tracked.

Chapter 7

IDAEO Field Results: Our Own Site and Early Field-Test Merchants

This chapter answersHow did IDAEO’s own site go from zero to one hundred million requests? What changed for the first batch of joint field-test merchants during the field-test period?

Why it comes hereOur own site and early field-test merchants provide first-party observational data. There is no control group yet, so this does not show that IDAEO caused the results. Start with the cumulative results in Figure 7-1 “IDAEO Growth Milestones”, then look at the field results for platform merchant pages and merchant websites. First-Party Data from different settings shows the AI impressions, search contact, and customer visits of small and medium-sized businesses.

Figure 7-1 IDAEO Growth Milestones: From Zero to One Hundred Million Requests

IDAEO Growth Milestones: From Zero to One Hundred Million Requests Eight milestones and the cumulative curve show the site’s track record from zero to one hundred million requests
Figure 7-1 IDAEO Growth Milestones: From Zero to One Hundred Million Requests
View as text

Read the title, approach, and reads over the same period for each milestone in order from 1–8, then compare against the cumulative curve. May 20–Aug 23 is the stage in which IDAEO methodology validation took shape. From Aug 24 on, counting uses platform-verified AI identities, which identifies them more precisely. Figures before Aug 24 may include duplicate requests. The corresponding theory is noted under each card.

IDAEO Growth Milestones: From Zero to One Hundred Million Requests
2026/3/3–10/8 · Eight milestones: what was done, how reads grew
①
3/3
Measurement officially launched
Action: began measuring AI visits,
set a baseline.
Result: 53 requests on day one;
635,000 requests in March.
Theory:
Law of Full-Journey Outcomes
Daily records
②
3/9–3/17
Search impressions begin
Action: company page began getting
search impressions.
Result: 1.59 million reads in April.
Theory:
Law of Audience Adaptation
Daily records
③
4/15
First visit from an AI answer
Action: began tracking AI answers
that bring visitors to the site.
Result: first verifiable
visit record.
Theory:
Journey Design · S9 Visit
Visit records
④
5/20–5/23
Brand info fully upgraded
Action: upgraded brand info,
strengthening AI understanding.
Result: 3.11 million reads in May.
Theory:
Identity Continuity (S1 Readiness)
Daily records
⑤
6/1–6/12
Evidence-driven optimization
Action: compiled relevant
papers online, optimized using
methods proven effective in tests.
Result: 16.07 million reads in June.
Theory:
Basis: 17 existing theories
Daily records
⑥
6/25–7/4
New IDAEO site built
Action: built the site directly
with the full IDAEO methodology.
Result: 25.97 million reads in July.
Theory:
Five Dimensions & Nine Elements
Daily records
⑦
7/17–8/22
Reads hit a new peak
Action: deepened optimization,
raising AI Content Use
efficiency and stability.
Result: 35.99 million in August.
Theory:
AI Impressions (S2–S4)
Daily records
⑧
September to 10/8
Hundred-million-request mark
Action: kept tracking AI and
search engine cumulative reads.
Result: 15.79 million in September.
October to 10/8: 6.34 million reads.
Cumulative: 105.5 million.
Theory:
Compounding Lead & Living Theory
Daily records
April
May
June
July
August
Sep
3/3
10/8
①
②
③
④
⑤
⑥
⑦
⑧
Cumulative crawl requests (daily running total)
Unit: requests · y-axis 0–110 million, linear
5/20–8/23: IDAEO methodology validation takes shape
From 8/24: platform-verified AI IDs, more precise →
25M
50M
75M
100M
①
②
③
④
⑤
⑥
⑦
⑧
10/8 cumulative 105.5 million
AI Agents automated browsing 17.95 million (8/26–10/8) listed separately
3/3
April
May
June
July
August
Sep
10/8
Cumulative (month-end)
635,000
2.22 million
5.33 million
21.4 million
47.37 million
83.36 million
99.15 million
105.5 million
Basis: cumulative total includes AI tools 7.079 million; AI Agents automated browsing 17.95 million (8/26–10/8) listed separately.
Monthly volumes in the figure are compiled from daily records; from 8/24 on, counting uses platform-verified AI identities.
S1 Prepare → S2 Crawl; subsequent answers, actions, and return visits are each shown on their own basis.
ID
EO
IDAEO Growth Milestones: From Zero to One Hundred Million Requests
ItemCumulative (month-end)
3/3635,000
April2.22 million
May5.33 million
June21.4 million
July47.37 million
August83.36 million
Sep99.15 million
10/8105.5 million
CSV

How to readRead the title, approach, and reads over the same period for each milestone in order from 1–8, then compare against the cumulative curve. May 20–Aug 23 is the stage in which IDAEO methodology validation took shape. From Aug 24 on, counting uses platform-verified AI identities, which identifies them more precisely. Figures before Aug 24 may include duplicate requests. The corresponding theory is noted under each card.

Figure 7-2 Monthly Ranking Shifts of AI Platforms

Monthly Ranking Shifts of AI Platforms Monthly ranking changes in crawl volume by platform
Figure 7-2 Monthly Ranking Shifts of AI Platforms
View as text

Each row is one rank; follow the same-colored line to see each platform’s monthly rank, then read it together with the crawl volume for the same period.

Monthly ranking changes by platform
2026/3/3–10/8 · Top ten by monthly crawl requests (first place at top) · October through 10/8
Colors:
Apple
Anthropic
OpenAI
Microsoft
Meta
Amazon
Google
Our AI Search
Perplexity
DuckDuckGo
Neutral (names at band ends):
Yandex
ByteDance
Sogou
Huawei
Parallel
TollBit
Common Crawl
March
April
May
June
July
August
Sep
October (through 10/8)
Below top ten
Below top ten
1
237,000
2
141,000
3
102,000
4
5
6
7
8
9
10
1
444,000
2
363,000
3
349,000
4
5
6
7
8
9
10
1
1.65 million
2
766,000
3
302,000
4
5
6
7
8
9
10
1
5.73 million
2
3.94 million
3
2.45 million
4
5
6
7
8
9
10
1
10.71 million
2
4.36 million
3
3.83 million
4
5
6
7
8
9
10
1
12.66 million
2
10.22 million
3
6.01 million
4
5
6
7
8
9
10
1
2.69 million
2
1.78 million
3
1.68 million
4
5
6
7
8
9
10
1
1.63 million
2
803,000
3
326,000
4
5
6
7
8
9
10
OpenAI
Yandex
Amazon
Google
Microsoft
ByteDance
Perplexity
Apple
Anthropic
DuckDuckGo
Meta
Microsoft
Anthropic
Amazon
OpenAI
Apple
Google
Perplexity
Yandex
Sogou
Source: IDAEO first-party measurement records; each month, AI Platforms are ranked by request volume, and only the top ten are drawn.
October through 10/8; AI Platforms are ranked by counting each source separately; AI Agents automated browsing, AI tools, and Tracking in Progress are listed separately.
Band width scales with the square root of monthly requests; when one request serves two purposes, it is counted only once for the same platform in the AI Platforms ranking.
ID
EO
Monthly Ranking Shifts of AI Platforms
ItemMarchValueOctober (through 10/8)Value
1OpenAI237,000Meta1.63 million
2Yandex141,000Microsoft803,000
3Amazon102,000Anthropic326,000
CSV

How to readEach row is one rank; follow the same-colored line to see each platform’s monthly rank, then read it together with the crawl volume for the same period.

Figure 7-3 Early Field-Test Merchant Results: Changes During the Field-Test Period

Early Field-Test Merchant Results: Changes During the Field-Test Period Early field-test merchants verify it too
Figure 7-3 Early Field-Test Merchant Results: Changes During the Field-Test Period
View as text

Read from top to bottom. First, look at Google search clicks for IDAEO platform merchant pages, then the cumulative number of times AI brought customers into merchant pages, to see changes during the field-test period. Next, look at changes in the first batch of merchant websites after joining the IDAEO field test. Then look at search clicks, AI crawls, and bookings brought by AI for our own Washinmura website (hotel and tourism industry). Finally, look at AI impressions, the platforms that came to read, and their purposes for the IDA pages of the second batch of field-test industries. Read each figure according to the labeled subject, period, and purpose. The figures for the first batch of merchant websites are site-wide opens. There is no control group yet; these results do not establish causation.

Early Field-Test Merchant Results: Changes During the Field-Test Period
2026/3–10 · See each panel for its period · IDAEO first-party measurement records
A | Google search clicks on merchant pages (monthly)
Merchant pages on the IDAEO platform
March
297
April
2,810
May
8,127
June
9,673
July
10,734
August
12,119
Sep
15,128
Up seven months in a row; September is 5.4 times April
B | AI brings customers to merchant pages (cumulative)
Visits brought by AI answers · cumulative from 4/15
March
April
3
May
53
June
336
July
524
August
651
Sep
760
774 cumulative through 10/8
about 50.67 million
AI Impressions of merchant pages (read by AI, 5/19–10/9)
AI Impressions come first; the rest of the journey follows
C | Websites of the first batch of field-test merchants
Changes during participation in the IDAEO field test (no control group yet; this does not establish causation)
Official Website
Participating in the Field Test
First batch of field-test merchants
373,254
website opens
cumulative from 4/11
341
times
Visits brought by AI
Industry
May → September
Visits brought by AI
Parenting content site
52,817
55,286
294 visits
ChatGPT 236, Gemini 35,
Perplexity 15, Claude 6, Copilot 2
Food equipment maker
842
1,275
ChatGPT 15 visits
Event staging design
442
1,741
—
Leather goods brand
555
908
ChatGPT 2 visits
Hair salon
74
128
—
Studio
3
329
—
Among official websites with complete records for both May and September, most grew; some did not
D | Our own site: the Washinmura website (hotel and tourism industry)
www.washinmura.jp · The first field-test site of the IDAEO methodology
1 in every 8 reads is someone asking AI right now
AI real-time retrievals: 11,333, or 11.9% of the 95,333 reads by AI and search engines
S2–S4 AI Information Acquisition
95,333 reads
Reads by AI and search engines
8/20–10/8
S5 Ask
11,333 reads
AI real-time retrievals
ChatGPT 7,720, Claude 1,983,
Perplexity 1,630
S9 Visit
AI-referred bookings
Booking data to be published later
Google search clicks 109,140; search impressions 1,344,589
3/3–10/8
E | Second batch of field-test industries: joined July–August
373,776 AI impressions
IDA pages of the second batch of field-test industries · times read by AI, 7/18–10/8
Who reads
What they do
Meta
170,137
OpenAI
60,869
Anthropic
59,178
Amazon
37,218
Apple
36,744
Microsoft
9,407
Common Crawl
107
Google
102
Perplexity
11
ByteDance
3
Copies back for training
327,365 reads
Building AI and search indexes
46,399 reads
Real-Time Retrieval
12 reads
Real-time retrieval: AI reads these pages as someone asks.
Search clicks and customer visits for IDA pages: Tracking in Progress, to be published later.
Industry websites (April–September total)
Copilot citations
37,793 citations
Bing search clicks
10,177 clicks
AI citations, compared with search clicks:
3.7 times
IDAEO is field-tested at Washinmura, the first merchants, and a second wave of industries; wider public testing is next.
ID
EO
Merchant website figures are site-wide opens.

How to readRead from top to bottom. First, look at Google search clicks for IDAEO platform merchant pages, then the cumulative number of times AI brought customers into merchant pages, to see changes during the field-test period. Next, look at changes in the first batch of merchant websites after joining the IDAEO field test. Then look at search clicks, AI crawls, and bookings brought by AI for our own Washinmura website (hotel and tourism industry). Finally, look at AI impressions, the platforms that came to read, and their purposes for the IDA pages of the second batch of field-test industries. Read each figure according to the labeled subject, period, and purpose. The figures for the first batch of merchant websites are site-wide opens. There is no control group yet; these results do not establish causation.

Key Points of This Chapter

ClaimWhy
IDAEO is field-tested not only on the IDAEO site itself and Washinmura; early field-test merchants also contribute field data.Platform merchant pages, merchant websites, and the second batch of field-test industries provide first-party data from different settings, so the actual results of the same theory can be compared across industries. Washinmura is the first field-test site for the IDAEO methodology. Our own Washinmura website (www.washinmura.jp, hotel and tourism industry) received 109,140 Google search clicks (Mar 3–Oct 8); of the 95,333 crawls by AI and search engines (Aug 20–Oct 8), 11,333 were real-time retrievals, with AI reading the site on the spot when someone asked it, about 1 in every 8 crawls (11.9%). Washinmura has already received bookings brought by AI; booking data will be published later. Because questions trigger AI to read the website, and AI has already brought bookings, these results map to the journey: S2–S4 AI crawling → S5 Ask → S9 Visit (bookings brought by AI).
The small and medium-sized businesses in the field test saw the following changes during their time on the IDAEO platform.The platform connects merchant information to AI crawling, search, and customer visits. Google search clicks on merchant pages rose from 297 in March to 15,128 in September, up for seven consecutive months, with September at 5.4 times April. The first customer brought by an AI answer came on Apr 15, reaching 774 cumulative by Oct 8. AI impressions from May 19 to Oct 9 were about 50.67 million. These are changes during the field-test period. There is no control group yet; these results do not establish causation. Merchants can use First-Party Data to verify the results of each stage.
① Measurement officially launched → Law of Full-Journey Outcomes (Performance Measurement); ② Search exposure rolled out in parallel → Law of Audience Adaptation (Audience Strategy); ③ First visitor arrived via an AI answer → Journey Design: S9 Visit.Measurement gives the results of every stage a basis, and search exposure connects content to search audiences. When an AI answer brought a customer for the first time, upstream content use connected to an actual arrival in the journey. These records give the laws and the journey results that can be checked against each other. If new records do not align with what the laws predict, the laws must be revised.
④ Brand knowledge presentation fully upgraded → Law of Identity Continuity (S1 Merchant Readiness); ⑤ Research-Evidence-Driven Optimization → Theoretical foundation: 17 existing theories; ⑥ New IDAEO site built → Five Dimensions and Nine Elements.A consistent brand identity lets AI link new information back to the same entity. Research supports the design, and the new site implements each dimension and element, so later content use builds on the earlier foundation. The test is whether new information links back to the same identity. If it does not, this mapping does not hold.
⑦ Crawl performance hit a new peak → AI Impressions (S2–S4 AI Information Acquisition); ⑧ Cumulative requests passed one hundred million → Compounding Lead and Living Theory.The crawl peak shows the scale at which AI acquires information; continued content use leaves new data, making the next round of optimization more precise. A rising cumulative curve alone cannot prove a Compounding Lead. This remains a hypothesis to be tested; each month’s new field data also grows the theory. The cumulative curve in Figure 7-1 records this accumulation: 635,000 by end of March → 21.4 million by end of June → 99.15 million by end of September → 105.5 million cumulative by Oct 8 (including AI, search engines, and Automated Bots; these platform-site volumes cannot be compared directly with a single merchant's website). Figures before Aug 24 may include duplicate requests. The rule of thumb for a Warm Start is about 30 days; the industry rule of thumb for a Cold Start is about 90 days. A separate single-site observation found that the next crawler from the same AI platform arrived 30–35 days later. TK Lin’s personal IDA case reached S7 in 14 days. Warm Start content meets S1 and goes live on an AI Traffic Hub, where existing crawlers can read it.
Among the first batch of merchant websites that joined the field test and have complete records for both May and September, most grew and some did not. For the websites that grew, site-wide opens from May to September were as follows: a parenting content site rose from 52,817 to 55,286, a food-service equipment manufacturer from 842 to 1,275, an event staging design firm from 442 to 1,741, a leather goods brand from 555 to 908, a hair salon from 74 to 128, and a studio from 3 to 329.Site-wide opens record the change in visits for each industry after joining the field test. With consistent subjects and periods, this First-Party Data is available for joint research and cross-industry comparison. The list above includes only websites that grew. Websites that did not grow also exist but are not listed. There is no control group yet; these results do not establish causation.
The IDA pages of the second batch of field-test industries received 373,776 AI impressions from Jul 18–Oct 8 (the number of times they were read by AI and search engine crawlers).10 platforms read the site; the top six were Meta 170,137, OpenAI 60,869, Anthropic 59,178, Amazon 37,218, Apple 36,744, and Microsoft 9,407. By purpose, “reads for training” led with 327,365, “reads for AI indexing and search indexing” totaled 46,399, and real-time retrievals totaled 12. The records show that the content of the second batch of field-test industries has been read by AI and search engines. Search clicks and customer arrivals: Tracking in Progress. Results will be published later.

Terms

Milestone
A growth node marked by methodology implementation and its corresponding results.
Research-evidence-driven optimization
Combining relevant papers with methods proven effective in field tests to improve marketing results.
Full-Methodology Site Build
Integrating audience, journey, trust and verification, and performance measurement from the very start of building the site.
Cumulative curve
A curve showing the continuous accumulation of AI and search engine requests over time.
Early field-test merchants
The earliest batch of merchants and site owners who put measurement on their own websites and ran field tests together with IDAEO.
Joint field test
Collaborative research in which merchants, site owners, and IDAEO validate the methodology together using first-party data.

FAQ

Q: What main growth line do the eight milestones show?

A: Theory says what to look at. Field results provide outcomes to check against it. Measurement and search exposure map to Performance Measurement and Audience Strategy, and AI bringing customers maps to customer visits. The brand knowledge upgrade, research evidence, and the new site build map to identity consistency, theoretical grounding, and a complete framework. The crawl peak and continued accumulation map to AI Information Acquisition, Compounding Lead, and Living Theory. See Figure 7-1 for cumulative volume. The total includes AI, search engines, and Automated Bots. Figures before Aug 24 may include duplicate requests. Each month’s new data is used to test these relationships and strengthen the theoretical and empirical foundation.

Q: What does Research-Evidence-Driven Optimization mean?

A: IDAEO compiles relevant papers from the web and optimizes its own site with methods proven effective in field tests. Research provides the basis; field testing links optimization choices to real content-use results.

Q: What is distinctive about the new IDAEO site build?

A: The new site applies the full IDAEO methodology directly, bringing the Marketing Audiences and Optimization Domains from Figure 1-1, “Panorama of the Five Marketing Audiences,” into the plan. Information, trust, and results are linked from the moment the site is built, so later growth builds on the earlier results.

Q: What does “from Aug 24 on” on the curve mean?

A: From Aug 24 on, counting uses platform-verified AI identities, which identifies visitors more precisely. May 20–Aug 23 is the stage in which IDAEO methodology validation took shape. Figures before Aug 24 may include duplicate requests. September was lower than August; the August figures span Aug 24, when the counting method changed. When comparing monthly volumes across Aug 24, use periods on the same basis.

Q: How are changes in platform rankings used in marketing decisions?

A: Read crawl volume and ranking for the same period together to observe how contact with each platform changes. Ranking reflects relative position; crawl volume reflects actual contact. Reading both together gives a better grasp of audience distribution.

Q: What do the early field-test merchants’ data show?

A: The data show changes during the field-test period: search clicks on platform merchant pages keep rising, and AI answers bring customers to the site. Among the first batch of merchant websites, most grew and some did not. There is no control group yet; these results do not establish causation. Search clicks, AI bringing customers, and site-wide opens on merchant websites each measure a different kind of contact. Looking at them separately by subject and period makes the Marketing value of each result clear and provides a basis for joint research. The IDA pages of the second batch of field-test industries received 373,776 AI impressions from Jul 18 to Oct 8. They were read by 10 platforms including Meta, OpenAI, Anthropic, Amazon, Apple, and Microsoft, showing that the content of the second batch of field-test industries has already been acquired by AI. Search clicks and customer arrivals: Tracking in Progress. Results will be published later.

Q: Why recruit more merchants and website owners to field-test together?

A: To study how IDAEO can work better for merchants and website owners, and to keep deepening the theory, practice, methodology, and solutions. Because First-Party Data from more merchants and website owners shows actual results across different settings, joint field testing gives these advanced studies a more complete basis.

This Chapter in Three Sentences

  1. Our own site and early field-test merchants provide First-Party Data from different settings.
  2. Eight milestones pair each approach with reads over the same period. The counting methods differ before and from Aug 24.
  3. Among websites with complete records, most grew and some did not. There is no control group yet; these results do not establish causation.

Three Things You Can Do This Week

  1. Write down what you will track on your website and over what period before you start recording.
  2. Before comparing monthly totals, check how each month's figures were counted.
  3. Record changes in visits to your own website. Do not use someone else's growth curve to set your expectations.

Next ChapterThe next chapter explains IDAEO's theoretical basis and how it differs from AI Visibility tools on the market.

Self-CheckUsing the different settings of the IDAEO site itself, Washinmura, and the early field-test merchants, explain what joint field testing means. Using the milestones and monthly rankings, describe the path from zero to one hundred million requests. Then read Figure 7-3, “Early Field-Test Merchant Results,” and interpret the numbers, periods, and Marketing value for platform merchant pages, the websites of each industry, and the second batch of field-test industries. Explain what changed in each setting during the field-test period and why causation cannot yet be claimed.

Chapter 8

AI Visibility and Theoretical Foundations

This chapter answersWhere in the journey does AI Visibility sit, and what is the theoretical basis of IDAEO?

Why it comes hereOnly by grasping the full journey and the theoretical sources can you clearly explain how the metrics relate to the methodology. The theoretical framework is introduced after the measurements in the preceding chapters. The seven laws still require ongoing testing through real-world measurement.

Figure 8-1 AI Visibility Positioning Map: Where Visibility Sits in the Full Journey

AI Visibility tools mainly measure S5–S7, observing how the brand appears in answers. S1–S4 are the foundation; without them, AI has a harder time reading what you say about your business. Information readiness and AI Information Acquisition are the basis for being mentioned. IDAEO links the upstream preparation with S8–S10 (acting for the customer, conversion, and return) into one full journey.

AI Visibility Positioning Map: Where Visibility Sits in the Full Journey AI Visibility metrics are set against the full journey, stressing that the fundamentals are S1–S4
Figure 8-1 AI Visibility Positioning Map: Where Visibility Sits in the Full Journey
View as text

Read from top to bottom: the ten steps, industry topics, industry metrics, IDAEO Journey Diagnostics, and Service Tiers; each column is the same step.

Journey Steps
See Figure 2-1
S1
Prepare
S2
Crawl
S3
Train
S4
Index
S5
Ask AI
S6
AI Mention
S7
AI Answer
S8
Act
S9
Visit
S10
Return
Who is talking
The fundamentals of AI Visibility: S1–S4
AI has to read you first before you show up in its answers
What outsiders call “AI Visibility”
Whether you are in AI answers
Downstream: act, visit, return
The outside still rarely measures this
Outside metrics
Vendor tools
Covered by IDAEO Journey Diagnostics
Question
coverage
phrasings that
surface you
Mention %
mentioned
how often,
vs. peers
Citation %
whether it
links to you,
gets it right
or wrong
Covered by IDAEO Journey Diagnostics
IDAEO
Diagnostics
See Figure 2-1
Is the datacomplete?
Can theyget in?
Can itbe used?
Is itindexed?
Came toread?
Were younamed?
Did it getit right?
Can it getit done?
Did theyshow up?
Did theyreturn?
IDAEO
Service Tiers
Links to Figure 5-1
AEO Exposure
AEO+ Word of Mouth
IDA Brand PR
S1–S4 is the base: without it, AI can hardly read you
AI has to read you first before you appear in its answers; visibility is the result of S5–S7, and the foundation is S1–S4.
ID
EO
Original framework © 2026

How to readRead from top to bottom: the ten steps, industry topics, industry metrics, IDAEO Journey Diagnostics, and Service Tiers; each column is the same step.

Figure 8-2 IDAEO Theoretical Foundations Map

17 existing theories are arranged by the five dimensions, and each cell lists the source and the application; “Theoretical Foundations and References” at the end of the book also lists the further readings in eight categories.

IDAEO Theoretical Foundations Map 17 existing theories are arranged by the five dimensions, and each cell lists the source and the application
Figure 8-2 IDAEO Theoretical Foundations Map
View as text

In each cell, look at the author, year, and theory first, then follow the arrow to the corresponding IDAEO design. The arrows show analogies. They do not mean that the theory proves IDAEO's validity.

Five Dimensions
① Audience Strategy
For whom
② Journey Design
Which steps to take
Theory
RAG
Lewis et al. 2020 |
AI retrieves first →
Real-Time Retrieval
Principal–Agent
Jensen, Meckling
1976 | AI Agents are
the customer's agents
AI-Readable Specs
RFC 9309,
schema.org |
AI follows site rules
→ AI allowed through
Customer Journey
McKinsey 2009,
Google 2011 |
Consumer decisions loop back →
Ten Steps
Attention Scarcity
Simon 1971 |
AI names only a few → S6
Five Dimensions
④ Service Tiers
To which tier
⑤ Performance Measurement
Counting results
Theory
Signaling Theory
Spence 1973 |
A signal needs a cost
the weak can't pay,
to be credible →
tiers, badges
Maturity Model
Paulk et al. 1993 |
Capability in levels,
step by step →
IDAEO Service Tiers
Versioned Pricing
Shapiro, Varian
1998 | One product
offered in versions →
IDAEO Service Tiers
with different content
Effects Hierarchy
Lavidge, Steiner
1961 | Awareness,
liking, then action →
Exposure,Word of Mouth,
Brand PR
Share of Voice
Jones 1990 |
Read share of voice
with market share →
AI Mention Rate
Goodhart's Law
Goodhart 1975 |
Targeted metrics fail
→ not just clicks,
AI use at every step
Five Dimensions
③ Trust and Verification
Why trust it
Theory
Info Asymmetry
Akerlof 1970 |
Unsure? It dares not
cite → verify
Source Credibility
Hovland,
Weiss 1951 |
Who says it
sways belief →
facts labeled with
who said it
Trust Elements
Mayer et al. 1995 |
Ability, benevolence,
integrity; updated
→ re-verify on expiry
Entity Resolution
Fellegi, Sunter
1969 | Match many
fields per firm →
Official registry check
Data Provenance
W3C PROV 2013 |
Each record's source,
when → kept verbatim
Certifiers
Lizzeri 1999 |
Certifiers choose
what to disclose→ IDAEO
sources every item,
draws no verdicts
ID
EO
Original framework © 2026

How to readIn each cell, look at the author, year, and theory first, then follow the arrow to the corresponding IDAEO design. The arrows show analogies. They do not mean that the theory proves IDAEO's validity.

IDAEO Theory Framework: Seven Laws, Five Dimensions, Nine Elements

Seven Steps Linked into a Methodology Grounded in Real-World Measurement

The full explanation of the theory comes here, after the measured data. This chapter explains the theoretical framework and the claims still to be tested. TK Lin brought real-world measurement, verification, and theory together. He then linked process, diagnostics, solutions, and results to form IDAEO. It starts from First-Party Data and builds a verification model using data from three regions. Whether this can support credible facts still needs real-world testing. It combines 17 academic theories and 78 further readings. It connects them to the four phases and ten steps, the ten Journey Diagnostics gates, and Service Tiers. Finally, nine Performance Metrics verify results. Eight measured figures together with First-Party Data show the results accumulated so far, providing a basis for judging journey progress.

Core, Framework, and Components Each Have Their Place

IDAEO's structural definition is: the seven laws are the core, the five dimensions are the framework, and the nine elements are the components. TK Lin connected real-world measurement and verification data to theory. He then put process, diagnostics, methods, and solutions into the same marketing discipline. The laws currently serve as principles for judgment and still need real-world testing. The dimensions arrange the work, and the elements connect the work to results, giving real-world measurement a clear framework for interpretation.

Figure 8-3 The Seven Laws of IDAEO: Overview Map

The seven laws are the core; the five dimensions are the framework. Read top to bottom: law name, one-line statement, why, and the matching dimension. The Law of Audience Adaptation says “expression varies with the audience,” because people and AI understand information differently. When addressing different audiences, check whether the content is understood correctly. If it is still misunderstood, review how it is expressed. The Law of Identity Continuity says “the entity's identity is always consistent,” because AI's recognition of an entity builds up over the long term. When checking across sources, see whether AI links the content to the same entity. If AI still misidentifies it despite that consistency, consistency alone does not show that the approach works. The Law of Independent Verification says “verification has a cost, and conclusions follow the facts,” because credibility comes from judgment that is not swayed by the client. For commissioned work, check whether conclusions follow the evidence. If they change to suit the client, this law is not met. The Law of Fact Primacy says “credible content starts from verified facts,” because AI is more likely to use it once verified. After verification, check whether AI uses it correctly. If AI still often gets it wrong, revisit this law. The Law of Claim Traceability says “every claim has a traceable basis,” because only when it can be traced does AI cite with confidence. When making a claim, check whether its source supports it. If AI still often gets it wrong despite a source being provided, revisit this law. The Law of External Corroboration says “a credible claim must have external corroboration,” because independent viewpoints complete a one-sided account. When comparing external information, check whether it supports the same claim. A repost or information that contradicts the claim does not count as corroboration. The Law of Full-Journey Outcomes says “AI Content Use at every stage counts as a result,” because customers may complete their decision right in the AI answer. Record results at each stage separately. If there are no results at later stages, progress at earlier stages cannot stand in for them. The bottom row maps in order to Audience Strategy (who to target), Service Tiers (how far to go), Trust and Verification (why believe it), and Performance Measurement (how to count results).

The Seven Laws of IDAEO: Overview Map The Seven Laws of IDAEO are the core of the entire book
Figure 8-3 The Seven Laws of IDAEO: Overview Map
View as text

Read from top to bottom: law name, one-line summary, why, and corresponding dimension. The bottom row connects to Figure 0-2, “Panorama of the IDAEO Theory Framework,” linking the core principles to the framework. All seven laws land on the ten steps. Journey Design is where the seven laws are put into practice together, so the bottom row of Figure 8-3 does not list it separately. Services stack up tier by tier on the same entity, so the Law of Identity Continuity corresponds to Service Tiers. When cross-checking the same entity across sources, see whether AI links different content back to that entity. If consistent identity information still leads to misidentification, revisit this law.

Law
Core
The Seven Laws of IDAEO: Fundamental Principles of AI-Era Marketing
Seven Laws
Audience
Law of Audience
Adaptation
Identity
Law of Identity
Continuity
Verification
Law of
Independent
Verification
Fact Primacy
Law of Fact
Primacy
Traceability
Law of Claim
Traceability
Corroboration
Law of External
Corroboration
Full Journey
Law of
Full-Journey
Outcomes
In one line
Expression fits
the audience
Identity stays
consistent
Checks cost;
facts decide
Only verified
facts count
Every claim
is traceable
Claims need
corroboration
Every AI use
is an outcome
Why
Humans and AI
understand info
in different ways
What AI knows
grows over time
Credibility needs
judgment free of
client influence
Once verified,
AI trusts it
Traceable, AI
is confident
to cite it
Outside views
balance one side
In AI answers,
customers decide
Dimension
① Audience
For whom
④ Service Tiers
To which tier
③ Trust and Verification
Why trust it
⑤ PerformanceMeasurement
Counting results
ID
EO
Original framework © 2026

How to readRead from top to bottom: law name, one-line summary, why, and corresponding dimension. The bottom row connects to Figure 0-2, “Panorama of the IDAEO Theory Framework,” linking the core principles to the framework. All seven laws land on the ten steps. Journey Design is where the seven laws are put into practice together, so the bottom row of Figure 8-3 does not list it separately. Services stack up tier by tier on the same entity, so the Law of Identity Continuity corresponds to Service Tiers. When cross-checking the same entity across sources, see whether AI links different content back to that entity. If consistent identity information still leads to misidentification, revisit this law.

How IDAEO Was Built: Seven Steps from Field Testing to Performance

StepWhat we didWhere to see it
① Field TestingMeasure First-Party Data: 105.5 million cumulative requests (including AI, search engines, and Automated Bots). Requests before Aug 24 may include duplicates. AI Impressions total 97.46 million. These data and visitor types form the basis for marketing decisions.See Figure 6-1, “Full-Journey Performance Dashboard,” and Chapter 1
② VerificationBuild the IDAEO Verification Model on big data from Japan, Taiwan, and Hong Kong. Whether the model can support credible facts still needs evidence from real-world tests.See Figure 4-1, “IDAEO Verification Model”
③ TheoryCombine 17 theories and 78 further readings so marketing design has a theoretical source.See Figure 8-2, “IDAEO Theoretical Foundations Map,” and the references at the end of the book
④ ProcessBuild the four-phase, ten-step AI Customer Journey, connecting information preparation to customer return.See Figure 2-1, “AI Customer Journey Map”
⑤ DiagnosisSet up the ten Journey Diagnostics gates so every step has a clear acceptance check.See Figure 2-2, “Journey Diagnostics Gate Map”
⑥ SolutionsConnect IDAEO Solutions and service tiers to the four phases and ten steps, arranging the scope of support by journey.See Figure 5-2, “Performance Metrics Mapping Matrix,” and Figure 5-1, “Service Tiers Ladder”
⑦ PerformanceCheck the journey against nine Performance Metrics, paired with eight measured figures and First-Party Data, to measure marketing results.See Figure 6-1, “Full-Journey Performance Dashboard”

See the appendix “Claim Basis Table” at the end of the book: it lists the basis type and sources for each of the book’s 57 claims.

Key Points of This Chapter

ClaimWhy
External AI Visibility mainly corresponds to the answer phase, S5–S7.The tools ask questions to observe whether the brand is mentioned; the focus is on AI’s answers.
The fundamentals of AI Visibility are S1–S4Only when S1 data is complete does AI have full content to understand. The crawls in S2–S4 bring the content into the information sources for search, training, and answers, supporting later mentions and citations. S1–S4 are the foundation. Without them, it is harder for AI to read what you say about your business.
IDAEO connects the foundation of S1–S4 with the action, conversion, and return of S8–S10 in a single journey.The front end supports the brand being used; the back end carries the customer’s choice. Only full-journey measurement shows the results clearly.
IDAEO’s theoretical foundations fall into eight categories: marketing fundamentals, generative engine and AI search research, AI customers and AI Agents, information retrieval and credibility, performance measurement, start-up and accumulation, official documentation of AI Platforms and agent protocols, and the theory behind the seven laws and the journey.The eight categories of literature support audiences, journey, credible information, judging results, start-up timing, and how AI Platforms actually operate, making the basis of the framework traceable.
The figure lists 17 existing theories; see “Theoretical Foundations and References” at the end of the book for the full references.The figure lists the design correspondences; the full references give the author, year, and source.
Each month’s new data and field verification keep strengthening IDAEO’s theoretical and empirical foundation.New results test the relationships among audiences, journey, and outcomes, letting the Living Theory keep absorbing real-world changes.

Terms

AI Visibility
How a brand appears in AI answers; IDAEO looks at both being mentioned and answer accuracy.
Mention Rate
The share of AI answers in a set of observation questions that mention the brand.
Theoretical Foundations
The research that supports the marketing framework and measurement design.
IDAEO Learners
The general public who want to understand and apply AI-Era Marketing.

FAQ

Q: If you already have an AI Visibility tool, do you still need IDAEO?

A: Yes. AI Visibility tools observe how the brand appears in answers; IDAEO then links the front end—information preparation and AI crawling—with the back end—acting for customers and customer visits. Answers build on the content foundation and also shape later choices; only by putting them back into the full journey can you grasp the results of each stage.

Q: How deeply do IDAEO Learners need to study the theory?

A: First understand which design each theory supports, then read the original literature as needed. Theory helps with judgment and application; once you grasp the correspondences, you can go deeper.

Q: How do you compare numbers from different AI Visibility tools?

A: First align the question scope, observation period, and metric definitions, then compare on the same basis. Each tool has a different design focus, so only comparisons on the same basis have clear meaning.

Q: What are the theoretical foundations of IDAEO?

A: IDAEO combines marketing fundamentals, generative engine and AI search research, AI customers and AI Agents, information retrieval and credibility, and performance measurement. The corresponding research includes Lemon & Verhoef (2016) on the Customer Journey, Aggarwal et al. (2024) on generative engine optimization, Gal & Elkin-Koren (2017) on algorithmic consumers, Brin & Page (1998) on search engine architecture, and Dong et al. (2015) on source credibility.

Q: Which part of being mentioned by AI does AI Visibility correspond to?

A: It corresponds to the final gate, S6–S7: whether AI names you and gets you right. The four ways before it are about letting AI read you; see Figure 2-5.

This Chapter in Three Sentences

  1. Tools on the market mainly cover S5–S7; IDAEO also covers S8–S10.
  2. S1–S4 are the foundation. Without them, it is harder for AI to read what you say about your business.
  3. IDAEO draws on 17 existing theories and related literature. The authors, years, and sources can be checked.

Three Things You Can Do This Week

  1. Organize the basic information on your website. Check that it is consistent and complete.
  2. Ask AI about your business. Check whether it is mentioned and described accurately.
  3. When comparing AI Visibility tools, first align the scope of the questions, the observation period, and the metric definitions.

Next ChapterNext, read “How This Book Grows” at the end of the book.

Self-CheckUsing Figure 8-1, “AI Visibility Positioning Map,” explain where the answer phase sits and why S1–S4 are the fundamentals; then take one theory and explain how it supports IDAEO’s design, and explain how each month’s new data and field results grow the theory.

Ten Things a Merchant Can Do This Week

These ten tasks are preparation, not a guarantee of results. Each is something merchants can complete themselves.

What to doHow to do it and check it yourselfMaps to
1. Write a Fact SheetWrite down your name, address, phone number, opening hours, what you do, and why you are credible. Replace adjectives with verifiable facts, such as your opening year, products, and prices. Put each fact in its own sentence, with a source and date. Check every item yourself.Maps to S1; Law of Fact Primacy and Law of Claim Traceability; see the Q&A in Chapter 2, the Q&A in Chapter 4, and Figure 4-1; for W3C PROV, see Figure 8-2
2. Use the Same Wording Across the WebUse exactly the same business name, address, and hours on your website, maps, and every platform. Copy the listings side by side. Make the wording consistent on pages you can edit. Flag pages managed by others for review.Maps to S1; Law of Identity Continuity; see Figure 2-5 ③ and entity resolution in Figure 8-2 (Fellegi & Sunter 1969)
3. Check Access and Decide Who to Let InCheck that pages open and can be found within your site. Review the access rules your website publishes for crawlers. Your website settings determine whether crawlers can access your site. For each platform's policies on training use, check its documentation.Maps to S2; diagnostic gate question: “Can they get in?”; see the Q&A in Chapter 2; for RFC 9309, see Figure 8-2
4. Provide a Version Machines Can ReadTurn your fact sheet into machine-readable formats: structured data on your web pages and a content guide file for AI. You can do this yourself or get help from a Third-Party Source. When finished, compare it with the fact sheet to check for missing items.Maps to S1; Law of Audience Adaptation; for schema.org, see Figure 8-2; for llms.txt (Howard 2024), see the references at the end of the book
5. Answer One Question per PageWrite a short answer on a separate page for each common customer question: how to book, prices, directions, and who you serve. Every sentence must match your fact sheet. Delete anything that does not.Maps to S5, S7; see Figure 2-5 ②; for retrieval-augmented generation (Lewis et al. 2020), see Figure 8-2
6. Cross-check what other pages say about youCheck information about you across platforms and pages verified by a Third-Party Source. Do they still match your fact sheet? Correct errors on your own pages. Flag errors on external pages for review. Do not create a different version of the facts.Maps to S4–S5; Law of External Corroboration; see Figure 2-5 ③④; for Chen et al. 2025, see the references at the end of the book
7. Remove outdated information or add datesFind discontinued items, old prices, and old hours. Remove them where possible. Otherwise, mark them as no longer current and state when they applied. Check again whenever you change prices or hours.Maps to S7; see Chapter 4, “Verify each fact and keep checking that it is current,” and re-verification when validity expires
8. Make sure tasks can be completedWrite booking instructions, contact details, and directions so both people and machines can follow them. Then try each process yourself to find any sticking points.Maps to S8; gate question: “Can the task be completed?”; see Chapter 1 on AI Agents acting for customers; for principal–agent theory, see Figure 8-2
9. Ask several AI services questions in your customers’ wordsAsk questions the way your customers would. Record whether AI mentions you and gets the facts right. If it gets something wrong, revisit items 1 and 6. Answers with sources can still be wrong, so check them against your fact sheet.Maps to S6, S7; see the Chapter 3 Q&A, “Regularly ask several AI services questions to check mentions and answer accuracy”; for Venkit et al. 2025, see the references at the end of the book
10. Review records by event type and record your starting pointReview your existing records of site visits, inquiries, and returns by event type. Mark unclear sources as unknown. Record where you stand now. Then check each month whether the answers from item 9 have changed. Do not focus on a single metric.Maps to S9, S10; see Chapter 3, “Interpret results from each source separately, using their respective units,” and Figure 6-1; for the Cold Start timeline, see Figure 6-6; Goodhart’s law

What to avoid

  • Do not hide instructions for AI in your pages or stuff them with keywords. Research shows that adding a passage to a page may sway AI recommendations (Kumar & Lakkaraju 2024).
  • Do not present exaggerated or unverifiable descriptions as facts. Replace them with facts that can be checked. See item 1.
  • Do not rewrite facts to please a particular AI service. Webpage text can manipulate AI recommendation rankings (Pfrommer et al. 2024). When everyone competes to manipulate them, performance worsens for all parties (Nestaas et al. 2025).
  • Do not treat a single AI response as a final verdict. Relying on one result can lead you to the wrong conclusion.

How This Book Grows

This is a living book. Each month's new data is published first at km.idaeo.ai/idaeo. A new edition of the book comes out each month. See what changed in the changelog: km.idaeo.ai/idaeo/changelog.html. All items marked “to be published later” in the main text are listed below.

Items to Add Starting with the Next Edition

  • AI Mention Rate and AI Answer Accuracy Rate figures across all platforms.
  • AI Return Visits figures.
  • This site's figures for Google generative AI impressions.
  • Field measurements of search clicks and customer site visits, covering the second group of industries in the field test.
  • AI Citations data from platforms other than Copilot, with sources and time periods clearly labeled.
  • Data on bookings generated by AI.
  • Record-by-record cross-checks between search appearances at S6 in the figure and mentions in AI answers for the same page.
  • Local Search field tests.

ParticipateTo take part in the field tests, see km.idaeo.ai/idaeo/participate.

About the Author

TK Lin (林毅祥) is a serial entrepreneur. In 2008, he founded ADPartner Asia Pacific Digital Advertising Group, a social media advertising agency. In 2016, he founded Botpartner, an AI chatbot company, in Paris. In 2020, he founded Washinmura in Chiba, Japan. In 2026, he founded IDAEO.

Usage in This Book Compared with Market Usage

The same term can have different meanings. The following compares this book's definitions with terms used in the market.

TermsUsage in this bookUsage in the market
GEOIn this book, GEO is the optimization domain that improves content visibility in generative answers, following Aggarwal et al. (2024). Building the AI index is the name of an S4 function, not GEO.Generative Engine Optimization focuses on content visibility in generative answers.
AEO (Optimization Domain)Gets AI answers to use your content. It includes AIO's AI Overview Optimization and supports AI real-time retrieval, AI Agents, and Automated Information Services. This is an optimization domain, not a service tier. The first service tier is called AEO Exposure and covers only S1–S4.Gets content used or cited by answer engines.
AEO ExposureA service plan covering S1–S4, with the goal of getting content read first. Mentions in answers belong to AEO+ Word of Mouth (S5–S6); being listed as a source belongs to S7.In the market, AEO is often understood as getting cited by answer engines.
LLMOIn this book, LLMO means optimization aimed at model training. Reads for training can be observed, but they do not mean a model has been trained on your content or remembers you.The name is Large Language Model Optimization.
AIOIn this book, AIO refers only to AI Overview Optimization for search engines. When AIO is used in the market as a general term for AI Optimization, it spans multiple domains. That broader usage cannot be placed entirely under this book's AEO.In the market, it can mean AI Overview Optimization or serve as a general term for AI Optimization.

AEO focuses on getting AI answers to use content. GEO focuses on improving visibility in generative answers. The two Optimization Domains overlap.

Standard Glossary

The whole book uses only the terms in this table. Marketing originated in the United States, so each term is fixed first in English and then in Traditional Chinese; Simplified Chinese stays close to Traditional Chinese, and Japanese follows the same line as English. The last two columns show which marketing concept each term corresponds to, and its definition.

EnglishTraditional ChineseSimplified ChineseJapaneseMarketing ConceptDefinition
Marketing行銷营销マーケティングMarketingCovers online and offline; it gets the right customers to find you, trust you, and choose you.
AI-Era MarketingAI 時代行銷學AI 时代营销学AI時代のマーケティング学MarketingMarketing for people and AI together, in an era when customers ask AI directly.
The Seven Laws of IDAEOIDAEO 七大定律IDAEO 七大定律IDAEOの七大法則Marketing PrinciplesThe core of IDAEO: the principles for judgment that integrate audience, identity, verification, facts, traceability, corroboration, and full-journey outcomes.
Marketing Audiences行銷受眾营销受众マーケティング・オーディエンスTarget AudiencesThe people and AI that marketing must reach and whose needs it must understand.
Humans人類人类人(生活者)ConsumersPeople who look for merchants through search, AI, or local search.
Search Engine Crawlers搜尋引擎爬蟲搜索引擎爬虫検索エンジンクローラーSearch ChannelsAI that builds the index and produces AI Overviews for search engines.
AI CrawlersAI 爬蟲AI 爬虫AIクローラーAI ChannelsAI that copies content back for training, builds AI indexes, and retrieves in real time for AI companies.
AI AgentsAI AgentAI AgentAIエージェントProxy Decision-MakersAI that acts for customers.
Automated Bots機械爬蟲机械爬虫自動サービスボットInformation TouchpointsAI that provides Automated Information Services such as information analysis and web page previews.
Optimization Domains優化領域优化领域最適化領域Channel OptimizationThe scope of optimization, divided by Marketing Audiences and information function.
Search Engine OptimizationSEO搜索引擎优化検索エンジン最適化Search MarketingGet search engines to index you and rank you.
AI Overview OptimizationAIOAI 概览优化AIによる概要の最適化Search MarketingIn this book, AIO refers only to AI Overview Optimization for search engines. When AIO is used in the market as a general term for AI Optimization, it spans multiple domains. That broader usage cannot be placed entirely under this book's AEO.
Large Language Model OptimizationLLMO大语言模型优化LLM最適化Brand AwarenessIn this book, LLMO means optimization aimed at model training. Reads for training can be observed, but they do not mean a model has been trained on your content or remembers you.
Generative Engine OptimizationGEO生成式引擎优化生成エンジン最適化Content MarketingIn this book, GEO is the optimization domain that improves content visibility in generative answers, following Aggarwal et al. (2024). Building the AI index is the name of an S4 function, not GEO.
Answer Engine OptimizationAEO答案引擎优化アンサーエンジン最適化Real-Time ServicesGets AI answers to use your content. It includes AIO's AI Overview Optimization and supports AI real-time retrieval, AI Agents, and Automated Information Services. This is an optimization domain, not a service tier. The first service tier is called AEO Exposure and covers only S1–S4.
Map Engine Optimization (Local SEO)MEO地图引擎优化MEO(マップエンジン最適化)Local MarketingGet customers to find you through local search.
Customer Journey顧客旅程顾客旅程カスタマージャーニーCustomer ExperienceThe path a customer takes from forming a need and getting information to choosing and returning.
S1 PrepareS1 店家準備好S1 店家准备好S1 準備Information PreparationThe merchant's information is complete, ready for people and AI to understand the brand.
S2 CrawlS2 爬蟲來敲門S2 爬虫来敲门S2 クロールReachAI visits the site to get brand information.
S3 TrainS3 抄回去訓練S3 抄回去训练S3 学習Brand MemoryAI takes content for model training.
S4 IndexS4 建目錄S4 建目录S4 インデックスInformation IndexingSearch engines and AI add the content to their indexes.
S5 AskS5 有人問 AIS5 有人问 AIS5 質問Need FormationA customer states a need, and AI goes on to get the information to answer it.
S6 MentionS6 AI 點名幾家S6 AI 点名几家S6 言及Consideration SetAI mentions relevant merchants in its answer.
S7 AnswerS7 AI 回答細節S7 AI 回答细节S7 回答Information EvaluationAI answers with specific information about the merchant.
S8 ActS8 替客人辦事S8 替客人办事S8 代行Acting for CustomersAI Agents search, book, and carry out tasks for customers.
S9 VisitS9 客人上門S9 客人上门S9 来訪Customer ConversionThe customer takes action by clicking through to the website or visiting the store.
S10 ReturnS10 回來再問S10 回来再问S10 再訪Customer LoyaltyThe customer raises a need again and returns.
Journey Diagnostics旅程診斷旅程诊断ジャーニー診断Marketing AuditConfirm progress and improvement priorities by journey step and performance metrics.
Ten Diagnostic Gates十道診斷關卡十道诊断关卡十の診断ゲートJourney ManagementEach of the ten steps has its own gate: Ready, Reachable, Learnable, Indexable, Readable, Selectable, Credible, Actionable, Visitable, Returnable.
Triangulated Verification三角驗證三角验证三角検証(トライアンギュレーション)Source CredibilityThe principle of combining Official Source, First-Party Source, and Third-Party Source evidence to form a credible judgment.
Official Source官方官方公的情報源Source CredibilityInformation provided by the public sector, such as government public registrations.
First-Party Source本方本方当事者情報源Brand ClaimsA statement by a merchant or its owner about their own information.
Third-Party Source第三方第三方第三者情報源external corroborationPublic information provided by independent external sources.
IDAEO Service Tiers服務分級(三級)服务分级(三级)サービス階層Service DesignHow far to go: choose AEO Exposure, AEO+ Word of Mouth, or IDA Brand PR by goal; each covers a different part of the journey. ID → IDA → AEO in the title is the order of the work: identity, then official and verifiable identity data, then use by answer engines. AEO → AEO+ → IDA is the depth of service: read first (S1–S4), named in the answer (S5–S6), then answered right, visit, and return (S7–S10, includes the first two tiers). Same letters, different order; the AEO in the title is an optimization domain, not the first service tier. The cover line describes what the whole book aims for, not the name of any tier.
AEO Exposure — Gets read first (S1–S4)AEO 曝光 — 先被讀到(S1–S4)AEO 曝光 — 先被读到(S1–S4)AEO露出 — まず読まれる(S1–S4)Brand ExposureThe name of a plan that covers only S1–S4. Its goal is to get your content read first. It does not mean being mentioned or cited by answer engines, as commonly understood in the market. Mentions fall under the next tier, AEO+ Word of Mouth (S5–S6). Being listed as a source falls under S7.
AEO+ Word of Mouth — Named in the answer (S5–S6)AEO+ 口碑 — 被點名(S5–S6)AEO+ 口碑 — 被点名(S5–S6)AEO+ クチコミ — 言及される(S5–S6)Word-of-Mouth MarketingCovers S5–S6: building word of mouth when AI names you in its answers; whether it recommends you depends on what the answer says. Word of mouth in the AI era = AI speaks for you (AI Word of Mouth).
IDA Brand PR — Described right, visit, return (S7–S10, includes the first two tiers)IDA 品牌公關 — 講對、上門、回來(S7–S10,含前兩級)IDA 品牌公关 — 讲对、上门、回来(S7–S10,含前两级)IDAブランドPR — 正しく語られ、来訪、再訪(S7–S10、前の二階層を含む)Brand PRFocuses on S7–S10 and includes the first two tiers, so the full journey S1–S10 is completely covered. The service tier that supports brand choice through credible answers, acting for customers, and customer return. This is the name of the highest service tier. In the book title, IDA means Identity Data Authority. In the verification model, IDA Verification is a method. These three uses share the name IDA but differ in scope.
Performance Metrics成效指標成效指标成果指標Marketing Performance MeasurementThe nine measures that correspond to the results of each journey step.
AI Readiness ScoreAI 就緒分AI 就绪分AIレディネス・スコアReadiness AssessmentHow well prepared a merchant is at S1, scored 0–100.
AI Crawl VolumeAI 讀取量AI 读取量AIクロール数AI ExposureThe number of times AI and search engines obtain content in S2–S4: crawled for training, AI indexing, and search indexing, totaling 97.46 million.
AI Real-Time RetrievalsAI 當場來讀量AI 当场来读量AIリアルタイム取得数Real-Time DemandThe number of times AI retrieves content in real time in response to a customer's question.
AI Mention RateAI 點名率AI 点名率AI言及率Brand MentionsThe share of the same set of questions in which AI mentions the merchant.
AI Answer Accuracy RateAI 正確率AI 正确率AI回答正確率Information QualityThe share of AI answers about the merchant that match verified facts.
AI CitationsAI 引用量AI 引用量AI引用数Citation OutcomesThe number of times AI answers list your content as a source.
AI Agent VisitsAI Agent 到站量AI Agent 到站量AIエージェント訪問数Agent TouchpointsThe total number of website visits by automated browsing classified by behavioral signature and by named AI Agents; named AI Agents can be identified directly as visiting on customers' behalf.
Search & AI Referral VisitsAI 導客量AI 导客量検索・AI経由流入数Referral TrafficThis book measures it as the number of times customers click through to the website via search or AI.
AI Return VisitsAI 回訪量AI 回访量AI再訪数Customer Re-engagementThe result of the same customer asking again and visiting again.
AI Content UseAI 取用AI 取用AIによるコンテンツ利用Content PerformanceUse of content in AI reading, answer citations, and acting on customers' behalf.
AI VisibilityAI 能見度AI 能见度AI可視性Brand VisibilityHow a brand appears in AI answers; IDAEO looks at both being mentioned and answer accuracy.
First-Party Data第一方數據第一方数据ファーストパーティデータFirst-Party DataData that IDAEO measures and accumulates directly, used to build the methodology and verify results.
Organic Traffic自然流量自然流量自然流入Organic ReachThe number of times customers click through to the website from search or AI.
Tracking in Progress實測追蹤中实测跟踪中計測中Performance MeasurementIDAEO keeps accumulating measurement results and will publish them later.
Black Box黑盒子黑盒子ブラックボックスDecision ProcessMentions, answers, and actions in S6–S8, along with the training and ranking that follow crawls in S3–S4, all happen inside AI Platforms; IDAEO measures them through both-end measurement and periodic live tests.
Five Marketing Audiences五類行銷受眾五类营销受众五つのマーケティング・オーディエンスTarget AudiencesHumans, Search Engine Crawlers, AI Crawlers, AI Agents, and Automated Bots.
Four AI Audiences四類 AI 受眾四类 AI 受众四つのAIオーディエンスAI CustomersSearch Engine Crawlers, AI Crawlers, AI Agents, and Automated Bots.
Six Optimization Domains六大優化領域六大优化领域六つの最適化領域Channel OptimizationThe optimization scope shared by SEO, AIO, AEO, GEO, LLMO, and MEO. AIO handles search engines' AI summaries; AEO handles AI answers and real-time reading. GEO is the domain of raising content's visibility in generative answers and overlaps with AEO at the answer stage. LLMO faces model training and is observed through reads for training. Building the AI index is the name of the S4 function.
Five Dimensions of IDAEO MarketingIDAEO 行銷五大構面IDAEO 营销五大构面IDAEOマーケティングの五つの構成軸Marketing FrameworkThe framework of IDAEO: it organizes marketing work through Audience Strategy (who it is for), Journey Design (which steps to take), Trust and Verification (why anyone should believe it), Service Tiers (which tier to deliver), and Performance Measurement (how results are counted).
Audience Strategy受眾策略受众策略オーディエンス戦略Target MarketWho it is for: arrange information and contact according to the needs of Marketing Audiences.
Journey Design旅程設計旅程设计ジャーニー設計Customer ExperienceWhich steps to take: link brand contact, AI Content Use, and customer action into a journey.
Trust and Verification信任驗證信任验证信頼と検証Brand TrustWhy anyone should believe it: support brand claims with credible facts and external corroboration.
Performance Measurement成效衡量成效衡量成果測定Marketing ResultsHow results are counted: use the metrics matched to each step to read the value of content use and conversion.
Nine Elements of the IDAEO FrameworkIDAEO 架構九大要素IDAEO 架构九大要素IDAEOフレームワークの九要素Marketing FrameworkThe components of IDAEO: Marketing Audiences, Optimization Domains, Customer Journey, Journey Diagnostics, IDAEO Solutions, Verification Principles, Service Tiers, Performance Metrics, and First-Party Data.
IDAEO SolutionsIDAEO 解決方案IDAEO 解决方案IDAEOソリューションMarketing SupportProfessional services matched to the Customer Journey and marketing goals.
Verification Principles驗證原則验证原则検証原則CredibilityBuild credible claims on verified facts, a traceable basis, and external corroboration.
AI Customer Journey: Four Phases, Ten StepsAI 顧客旅程:四階段十步驟AI 顾客旅程:四阶段十步骤AIカスタマージャーニー:四つのフェーズと十のステップCustomer JourneyLinks S1–S10 through Merchant Readiness, AI Information Acquisition, AI-Assisted Decision and Action, and Customer Conversion and Re-engagement.
Merchant Readiness店家就緒店家就绪店舗レディネスInformation PreparationAt S1, brand information is ready for people and AI to understand.
AI Information AcquisitionAI 資訊取得AI 信息获取AIによる情報取得Information TouchpointsAt S2–S4, AI acquires information for search, training, and answering.
AI-Assisted Decision and ActionAI 輔助決策與行動AI 辅助决策与行动AIによる意思決定・行動支援Decision SupportAt S5–S8, AI responds to the need, mentions brands, answers details, and acts for customers.
Customer Conversion and Re-engagement顧客轉換與回流顾客转化与回流顧客のコンバージョンと再エンゲージメントConversion and Relationship ManagementAt S9–S10, the customer takes action and engages the brand again.
AI ImpressionsAI 曝光數AI 曝光数AIインプレッション数Exposure MeasurementEach time AI or a search engine reads your content is one AI impression. This is exposure to AI—each time AI reads you counts as one, not how many people saw it; it is the marketing meaning of AI Crawl Volume.
Automated Information Services自動化資訊服務自动化信息服务自動化情報サービスInformation ServicesServices such as information organization, analysis, and web page previews provided by Automated Bots.
Local Search在地搜尋本地搜索ローカル検索Local MarketingCustomers looking for merchants or services by location and nearby needs.
IDAEO LearnersIDAEO 學習者IDAEO 学习者IDAEO学習者Marketing EducationThe general public who want to understand and apply AI-Era Marketing.
Law of Audience Adaptation受眾適配定律受众适配定律オーディエンス適応の法則Audience StrategyExpression varies with the audience, because people and AI understand information differently.
Law of Identity Continuity身分連續定律身份连续定律アイデンティティ連続性の法則Brand AwarenessThe entity's identity is always consistent; AI's recognition of an entity builds up over the long term.
Law of Independent Verification驗證獨立定律验证独立定律独立検証の法則Brand TrustVerification has a cost, and conclusions follow the facts, because credibility comes from judgment that is not swayed by the client.
Law of Fact Primacy事實先行定律事实先行定律事実優先の法則CredibilityCredible content starts from verified facts; only once verified does AI use it with confidence.
Law of Claim Traceability主張溯源定律主张溯源定律主張の追跡可能性の法則Source CredibilityEvery claim has a traceable basis; only when it can be traced does AI cite it with confidence.
Law of External Corroboration外部印證定律外部印证定律外部裏付けの法則external corroborationA credible claim must have external corroboration, because independent viewpoints complete a one-sided account.
Law of Full-Journey Outcomes全程成效定律全程成效定律ジャーニー全体の成果の法則Marketing PerformanceAI Content Use at every stage counts as a result, because customers complete their decision right in the AI answer.
IDAEO Verification ModelIDAEO 驗證模型IDAEO 验证模型IDAEO 検証モデルBrand TrustBuilt on big data from Japan, Taiwan, and Hong Kong, it combines Official Source, First-Party Source, and Third-Party Source evidence, accumulates data over the long term, keeps checking, and re-verifies on expiry, to support credible judgments on individual facts.
Cold Start冷啟動冷启动コールドスタートTraffic AccumulationAI traffic accumulates from 0; the industry rule of thumb is about 90 days.
Warm Start熱啟動热启动ウォームスタートTraffic AccumulationContent meets S1 and goes live on an AI Traffic Hub. Rule of thumb: about 30 days; TK Lin's personal IDA case reached S7 (Answer) in 14 days.
AI Traffic HubAI 流量樞紐AI 流量枢纽AIトラフィック・ハブChannels and PlatformsA platform that accumulates ten million or more AI requests per month; content connects to existing AI traffic as soon as it goes live. The IDAEO platform (idaeo.ai) is an AI Traffic Hub.
Compounding Lead複利領先复利领先複利的リードTraffic AccumulationAI impressions accumulate and bring more content use and data; the earlier you start, the more your lead widens over time.
AI PlatformsAI 平台AI 平台AIプラットフォームChannels and PlatformsCompanies that operate search engines, AI services, and crawlers, such as Google, OpenAI, Microsoft, Anthropic, Apple, and Meta.
Living Theory活的學說活的学说生きている理論MarketingIDAEO gains new data and new real-world verification every month, and its theoretical and empirical foundation keeps strengthening.

Theoretical Foundations and References

Every design in IDAEO has a theoretical source. The top half is the full bibliography for the 17 theories listed in Figure 8-2 (19 sources); the bottom half is 78 further readings in eight categories: marketing fundamentals, generative engine and AI search research, AI customers and AI Agents, information retrieval and credibility, performance measurement, start-up and accumulation, official documentation of AI Platforms and agent protocols, and the theory behind the Seven Laws and the journey.

TheorySourceHow IDAEO Uses It
The 17 theories listed in Figure 8-2 of this book (19 sources)
Retrieval-Augmented GenerationLewis, P., Perez, E., Piktus, A., Petroni, F., Karpukhin, V., Goyal, N., Küttler, H., Lewis, M., et al. (2020). Retrieval-Augmented Generation for Knowledge-Intensive NLP Tasks. Advances in Neural Information Processing Systems 33 (NeurIPS 2020). arXiv:2005.11401.AI retrieves before answering → real-time retrieval
Principal–AgentJensen, M. C., & Meckling, W. H. (1976). Theory of the firm: Managerial behavior, agency costs and ownership structure. Journal of Financial Economics, 3(4), 305–360. AI Agents are the customer's agents
AI-readable standards (robots protocol)Koster, M., Illyes, G., Zeller, H., & Sassman, L. (2022). Robots Exclusion Protocol. RFC 9309, IETF (Proposed Standard), September 2022.AI follows rules when reading websites → let AI through
AI-readable standards (structured data vocabulary)Schema.org. About Schema.org. Schema.org community (founding companies: Google, Microsoft, Yahoo, Yandex).AI follows rules when reading websites → let AI through
Customer Journey (consumer decision journey)Court, D., Elzinga, D., Mulder, S., & Vetvik, O. J. (2009). The consumer decision journey. McKinsey Quarterly, June 2009.Consumer decisions are a loop that circles back → Ten Steps
Customer Journey (Zero Moment of Truth, ZMOT)Lecinski, J. (2011). Winning the Zero Moment of Truth. Google (free e-book).Customers search online before buying, and the path can move forward or turn back → Ten Steps
Attention ScarcitySimon, H. A. (1971). Designing Organizations for an Information-Rich World. In M. Greenberger (Ed.), Computers, Communications, and the Public Interest (pp. 37–72). Baltimore: The Johns Hopkins Press.More information makes attention scarcer → S6 AI mentions only a few at a time
Information AsymmetryAkerlof, G. A. (1970). The Market for "Lemons": Quality Uncertainty and the Market Mechanism. The Quarterly Journal of Economics, 84(3), 488–500. Asymmetric quality information affects transaction decisions → verification fills in the credible evidence
Source CredibilityHovland, C. I., & Weiss, W. (1951). The Influence of Source Credibility on Communication Effectiveness. Public Opinion Quarterly, 15(4), 635–650. Who says it affects whether people believe it → Law of Claim Traceability: every claim comes with its source
Three Elements of TrustMayer, R. C., Davis, J. H., & Schoorman, F. D. (1995). An Integrative Model of Organizational Trust. The Academy of Management Review, 20(3), 709–734. Trust rests on ability, benevolence, and integrity, and updates with behavior → trust updates with time
Entity ResolutionFellegi, I. P., & Sunter, A. B. (1969). A Theory for Record Linkage. Journal of the American Statistical Association, 64(328), 1183–1210. The same business must match on multiple fields → Law of Identity Continuity
Data ProvenanceMoreau, L., & Missier, P. (Eds.) (2013). PROV-DM: The PROV Data Model. W3C Recommendation, April 30, 2013.Where and when each piece of data came from → Law of Claim Traceability
Third-Party Certification IntermediariesLizzeri, A. (1999). Information Revelation and Certification Intermediaries. The RAND Journal of Economics, 30(2), 214–231. The certification intermediary decides how much information to disclose → Law of Independent Verification
Signaling TheorySpence, M. (1973). Job Market Signaling. The Quarterly Journal of Economics, 87(3), 355–374. Signal costs differ by type, and the high-quality party can better afford them → credible signals for service tiers
Capability Maturity ModelPaulk, M. C., Curtis, B., Chrissis, M. B., & Weber, C. V. (1993). Capability maturity model, version 1.1. IEEE Software, 10(4), 18–27. Capabilities are graded and climb level by level → service tiers
Versioned PricingShapiro, C., & Varian, H. R. (1998). Versioning: The Smart Way to Sell Information. Harvard Business Review, 76(6), 106–114. The same product is offered in versions → service tiers differ in content
Hierarchy of EffectsLavidge, R. J., & Steiner, G. A. (1961). A Model for Predictive Measurements of Advertising Effectiveness. Journal of Marketing, 25(6), 59–62. Awareness, liking, and action come in sequence → Exposure, Word of Mouth, Brand PR
Share of VoiceJones, J. P. (1990). Ad Spending: Maintaining Market Share. Harvard Business Review, 68(1), 38–42. Advertising share of voice is read alongside market share → the concept is borrowed to measure AI Mention Rate
Goodhart's LawGoodhart, C. A. E. (1976). Problems of Monetary Management: The U.K. Experience. In Papers in Monetary Economics, Vol. I. Sydney: Reserve Bank of Australia. (Presented at a conference in Sydney in July 1975; commonly cited as Goodhart 1975)When a measure becomes a target, it loses its power to measure → look at clicks and AI content use at every step together
Further Reading: Marketing Fundamentals
The official definition of marketingAmerican Marketing Association. Definition of Marketing. AMA official website (accessed 2026-10-11).Marketing is the activity of creating and exchanging value for customers and society → the audience extends to AI
AIDA (attention, interest, desire, action)Strong, E. K., Jr. (1925). Theories of selling. Journal of Applied Psychology, 9(1), 75–86. Strong organized the attention, interest, desire, action account of sales stages → an early reference for dividing the Customer Journey into stages
Customer Journey and customer experienceLemon, K. N., & Verhoef, P. C. (2016). Understanding Customer Experience Throughout the Customer Journey. Journal of Marketing, 80(6), 69–96. The journey is divided into before, during, and after the purchase decision, with multiple touchpoints → the Ten Steps add AI touchpoints
Customer-based brand equityKeller, K. L. (1993). Conceptualizing, Measuring, and Managing Customer-Based Brand Equity. Journal of Marketing, 57(1), 1–22. Brand equity comes from the brand knowledge in customers' minds → extended to the knowledge in AI's mind
Service-dominant logicVargo, S. L., & Lusch, R. F. (2004). Evolving to a New Dominant Logic for Marketing. Journal of Marketing, 68(1), 1–17. Value is co-created with customers in use → AI acting on their behalf is part of that co-creation
The effect of word of mouth on new product diffusionArndt, J. (1967). Role of Product-Related Conversations in the Diffusion of a New Product. Journal of Marketing Research, 4(3), 291–295. Positive word of mouth drives consumer adoption of new products → word of mouth is the core of “AEO+ Word of Mouth”
Two-step flow and opinion leadersKatz, E., & Lazarsfeld, P. F. (1955). Personal Influence: The Part Played by People in the Flow of Mass Communications. Glencoe, IL: Free Press. Opinion leaders interpret and relay messages for the public → AI plays the same intermediary role
The sales effect of traditional and social earned mediaStephen, A. T., & Galak, J. (2012). The Effects of Traditional and Social Earned Media on Sales: A Study of a Microlending Marketplace. Journal of Marketing Research, 49(5), 624–639. Earned media drives sales → evidence from a third-party source carries more weight than self-claims
Service blueprintShostack, G. L. (1984). Designing Services That Deliver. Harvard Business Review, 62(1), 133–139. A service blueprint marks the potential failure points in a process → the Ten Steps confirm what to improve step by step
Commitment and trust (relationship marketing)Morgan, R. M., & Hunt, S. D. (1994). The Commitment-Trust Theory of Relationship Marketing. Journal of Marketing, 58(3), 20–38. Trust and commitment are the keys to successful relationship marketing → Trust and Verification connects to S10 Return
Customer valueGupta, S., Lehmann, D. R., & Stuart, J. A. (2004). Valuing Customers. Journal of Marketing Research, 41(1), 7–18. Customers' long-term value can be used to estimate firm value → outcomes are tracked all the way to return visits
Further Reading: Generative Engine and AI Search Research
Generative Engine Optimization (GEO)Aggarwal, P., Murahari, V., Rajpurohit, T., Kalyan, A., Narasimhan, K., & Deshpande, A. (2024). GEO: Generative Engine Optimization. Proceedings of the 30th ACM SIGKDD Conference on Knowledge Discovery and Data Mining (KDD '24), pp. 5–16.First proposed the GEO optimization framework and measured visibility → this book follows its core direction: raising content's visibility in generative answers.
Verifiability of generative search enginesLiu, N. F., Zhang, T., & Liang, P. (2023). Evaluating Verifiability in Generative Search Engines. Findings of the Association for Computational Linguistics: EMNLP 2023, pp. 7001–7025.How well citations support generative search answers varies → accuracy must be measured separately
Ranking manipulation in conversational search enginesPfrommer, S., Bai, Y., Gautam, T., & Sojoudi, S. (2024). Ranking Manipulation for Conversational Search Engines. Proceedings of the 2024 Conference on Empirical Methods in Natural Language Processing (EMNLP 2024), pp. 9523–9552. arXiv:2406.03589.Web page text can manipulate AI recommendation rankings → hence the need for three-party verification
Manipulating language models to increase product visibilityKumar, A., & Lakkaraju, H. (2024). Manipulating Large Language Models to Increase Product Visibility. arXiv preprint arXiv:2404.07981.Adding one passage to a product page can push it to the top of the recommendations → mention rate can be manipulated
Adversarial SEO against language modelsNestaas, F., Debenedetti, E., & Tramèr, F. (2025). Adversarial Search Engine Optimization for Large Language Models. ICLR 2025. arXiv:2406.18382. When everyone races to manipulate AI, everyone's results get worse → IDAEO advocates building on verifiable facts for the long term
AI search favors earned mediaChen, M., Wang, X., Chen, K., & Koudas, N. (2025). Generative Engine Optimization: How to Dominate AI Search. arXiv preprint arXiv:2509.08919.AI search cites third-party sources more than brand-owned ones → third-party evidence matters most
A benchmark of whether conversational SEO worksPuerto, H., Gubri, M., Green, T., Oh, S. J., & Yun, S. (2025). C-SEO Bench: Does Conversational SEO Work? Advances in Neural Information Processing Systems 38 (NeurIPS 2025 Datasets & Benchmarks), pp. 31145–31169. arXiv:2506.11097.Most rewriting tricks have limited effect → judge optimization results by measured performance
The “cited, therefore credible” gap in AI searchNarayanan Venkit, P., Laban, P., Zhou, Y., Mao, Y., & Wu, C.-S. (2025). Search Engines in the AI Era: A Qualitative Understanding to the False Promise of Factual and Verifiable Source-Cited Responses in LLM-based Search. Proceedings of the 2025 ACM Conference on Fairness, Accountability, and Transparency (FAccT '25), pp. 1325–1340. arXiv:2410.22349.AI answers with sources attached still often get things wrong → verify every fact, one by one
AI summaries reduce clicksChapekis, A., & Lieb, A. (2025). Google users are less likely to click on links when an AI summary appears in the results. Pew Research Center, July 22, 2025.Users click fewer links when an AI summary appears → measure both clicks and AI Content Use
Further Reading: AI Customers and AI Agents
Algorithmic consumersGal, M. S., & Elkin-Koren, N. (2017). Algorithmic Consumers. Harvard Journal of Law & Technology, 30(2), 309–353. Algorithms choose and place orders on people's behalf → marketing targets extend to AI customers
Adoption barriers for automated shopping systemsde Bellis, E., & Johar, G. V. (2020). Autonomous Shopping Systems: Identifying and Overcoming Barriers to Consumer Adoption. Journal of Retailing, 96(1), 74–87. Consumers face psychological barriers when they hand purchase decisions to a system → S8 needs a foundation of trust
How AI shopping agents pick productsAllouah, A., Besbes, O., Figueroa, J. D., Kanoria, Y., & Kumar, A. (2025). What Is Your AI Agent Buying? Evaluation, Biases, Model Dependence, & Emerging Implications for Agentic E-Commerce. arXiv:2508.02630; also in Proceedings of the ACM Web Conference 2026, pp. 8697–8700.AI agents show position and model biases when picking products → merchants must optimize for agents
An experimental environment for agent-to-agent marketsBansal, G., Hua, W., Huang, Z., Fourney, A., Swearngin, A., Epperson, W., Payne, T., Hofman, J. M., et al. (2025). Magentic Marketplace: An Open-Source Environment for Studying Agentic Markets. arXiv preprint arXiv:2510.25779.Uses a simulated market to study how agents on both sides of a transaction interact → the experimental basis for S8
Further Reading: Information Retrieval and Credibility
PageRank and large-scale search engine architectureBrin, S., & Page, L. (1998). The anatomy of a large-scale hypertextual Web search engine. Computer Networks and ISDN Systems, 30(1–7), 107–117. Crawl, index, and compute authority from links → the technical prototype for S2 and S4
Authorities and hubs (HITS)Kleinberg, J. M. (1999). Authoritative sources in a hyperlinked environment. Journal of the ACM, 46(5), 604–632. Authority is established by who points to you → citations from third-party sources are where authority comes from
Assessing source trustworthiness by factual correctness (KBT)Dong, X. L., Gabrilovich, E., Murphy, K., Dang, V., Horn, W., Lugaresi, C., Sun, S., & Zhang, W. (2015). Knowledge-based trust: Estimating the trustworthiness of web sources. Proceedings of the VLDB Endowment, 8(9), 938–949. Rates trustworthiness by whether a page's facts are right → the basis for fact-by-fact verification
Knowledge Graph (entities, not strings)Singhal, A. (2012). Introducing the Knowledge Graph: things, not strings. Google official blog, May 16, 2012.Search moved from matching strings to recognizing entities → merchants must become recognizable entities
A survey of knowledge graphsHogan, A., Blomqvist, E., Cochez, M., d'Amato, C., de Melo, G., Gutierrez, C., Kirrane, S., Labra Gayo, J. E., et al. (2021). Knowledge Graphs. ACM Computing Surveys, 54(4), 1–37.How knowledge graphs are built, verified, and updated → the academic overview for S4
E-E-A-T (Experience, Expertise, Authoritativeness, Trustworthiness)Google Search Central (2022). Our latest update to the quality rater guidelines: E-A-T gets an extra E for Experience. Google Search Central Blog, December 15, 2022. See also Google Search Central. Creating helpful, reliable, people-first content (accessed 2026-10-11).Google's quality rater guidelines look at four dimensions, with trust mattering most → a reference point for verification
The FEVER fact-checking datasetThorne, J., Vlachos, A., Christodoulopoulos, C., & Mittal, A. (2018). FEVER: a Large-scale Dataset for Fact Extraction and VERification. NAACL-HLT 2018 (Long Papers), pp. 809–819.Each claim is judged against the evidence as supported, refuted, or insufficient → the prototype for the three verification states
The FActScore atomic-fact accuracy rateMin, S., Krishna, K., Lyu, X., Lewis, M., Yih, W., Koh, P. W., Iyyer, M., Zettlemoyer, L., et al. (2023). FActScore: Fine-grained Atomic Evaluation of Factual Precision in Long Form Text Generation. EMNLP 2023, pp. 12076–12100.Split an answer into single facts and score each one for correctness → how the accuracy rate is calculated
Survey of hallucination in language generationJi, Z., Lee, N., Frieske, R., Yu, T., Su, D., Xu, Y., Ishii, E., Bang, Y. J., et al. (2023). Survey of Hallucination in Natural Language Generation. ACM Computing Surveys, 55(12), 1–38.Language models generate unsupported content → why the accuracy rate must be measured
Further Reading: Performance Measurement
Net Promoter Score (NPS)Reichheld, F. F. (2003). The One Number You Need to Grow. Harvard Business Review, 81(12), 46–54. Willingness to recommend correlates with company growth → a reference for measuring word of mouth; return visits are tracked in addition
Multi-channel conversion attributionLi, H., & Kannan, P. K. (2014). Attributing Conversions in a Multichannel Online Marketing Environment: An Empirical Model and a Field Experiment. Journal of Marketing Research, 51(1), 40–56. Conversions must be apportioned across every channel touched → AI channels count in attribution too
Data-driven multi-touch attributionShao, X., & Li, L. (2011). Data-driven multi-touch attribution models. Proceedings of the 17th ACM SIGKDD International Conference on Knowledge Discovery and Data Mining (KDD '11), pp. 258–264.Use data to estimate each touchpoint's contribution → links crawl volume to referral visits
Campbell's law (a metric used for decisions gets distorted)Campbell, D. T. (1979). Assessing the impact of planned social change. Evaluation and Program Planning, 2(1), 67–90. The more a quantitative metric drives decisions, the more it is distorted → the nine Performance Metrics must check one another
Experimental versus observational comparison of advertising effectivenessGordon, B. R., Zettelmeyer, F., Bhargava, N., & Chapsky, D. (2019). A Comparison of Approaches to Advertising Measurement: Evidence from Big Field Experiments at Facebook. Marketing Science, 38(2), 193–225. Effectiveness calculated from observational data often diverges from experimental results → always compare performance on the same basis
Further Reading: Start-Up and Accumulation
First-mover advantageLieberman, M. B., & Montgomery, D. B. (1988). First-mover advantages. Strategic Management Journal, 9(S1), 41–58. Entering first brings an advantage and also a cost → the early-mover dividend is held through sustained investment
Increasing returns and path dependenceArthur, W. B. (1989). Competing Technologies, Increasing Returns, and Lock-In by Historical Events. The Economic Journal, 99(394), 116–131. Under increasing returns, an early lead can lock in the market → the theoretical reference for Compounding Lead
The Cold Start problemSchein, A. I., Popescul, A., Ungar, L. H., & Pennock, D. M. (2002). Methods and metrics for cold-start recommendations. Proceedings of the 25th Annual International ACM SIGIR Conference on Research and Development in Information Retrieval (SIGIR '02), pp. 253–260.A recommender system struggles to recommend new items that have no accumulated data → the theoretical reference for Cold Start
Further Reading: Official Documentation of AI Platforms and Agent Protocols
OpenAI crawler documentationOpenAI. Overview of OpenAI Crawlers. OpenAI developer documentation (accessed 2026-10-11).GPTBot, OAI-SearchBot, and ChatGPT-User each have their own purpose → three kinds of reading: training, indexing, and real-time retrieval
Anthropic crawler documentationAnthropic. Does Anthropic crawl data from the web, and how can site owners block the crawler? Claude Help Center (accessed 2026-10-11).ClaudeBot, Claude-SearchBot, and Claude-User each have their own purpose → one platform also splits into three kinds of reading
Perplexity crawler documentationPerplexity. Perplexity Crawlers. Perplexity official documentation (accessed 2026-10-11).PerplexityBot builds search results; Perplexity-User reads when a user asks → indexing and real-time retrieval
Amazon crawler documentationAmazon. About Amazonbot. Amazon Developer (accessed 2026-10-11).Amazonbot improves products and services and may be used for training; Amzn-User reads on user request → training and real-time retrieval
Google crawler overviewGoogle. Google's common crawlers. Google Crawling Infrastructure documentation (accessed 2026-10-11).Googlebot builds the search index; Google-Extended controls AI use → treat Search Engine Crawlers and AI use separately
External measurement of AI crawling and referralsTomé, J. (2025). The crawl-to-click gap: Cloudflare data on AI bots, training, and referrals. Cloudflare Blog, August 29, 2025.External measurement counts AI crawling and referrals separately → measure AI Impressions and customers brought by AI separately
Model Context Protocol (MCP)Model Context Protocol. Specification (2025-06-18 version). modelcontextprotocol.io.AI Agents access data and tools through a standard interface → S8 Act
Agent-to-Agent Protocol (A2A)Google (2025). Announcing the Agent2Agent Protocol (A2A). Google Developers Blog, April 9, 2025.Different AI Agents hand off tasks through a shared standard → AI Agents are new Marketing Audiences
Agent Payments Protocol (AP2)Google Cloud (2025). Announcing Agent Payments Protocol (AP2). Google Cloud Blog, September 2025.Agent transactions need user authorization and traceable credentials → Trust and Verification from S8 to S9
The llms.txt proposalHoward, J. (2024). The /llms.txt file (currently v2). llmstxt.org, first published September 3, 2024.Prepare a content guide for models → the AI-readable layer of S1 Prepare
Further Reading: Theory Behind the Seven Laws and the Journey
Law of Audience Adaptation|Semantic WebBerners-Lee, T., Hendler, J., & Lassila, O. (2001). The Semantic Web. Scientific American, 284(5), 34–43. Software agents can act for people only when web pages carry machine-readable structure → address humans and AI each in a form they can read
Law of Audience Adaptation|Media RichnessDaft, R. L., & Lengel, R. H. (1986). Organizational Information Requirements, Media Richness and Structural Design. Management Science, 32(5), 554–571. Different information needs suit different forms of expression → arrange content formats by audience
Law of Identity Continuity|Brand as SignalErdem, T., & Swait, J. (1998). Brand Equity as a Signaling Phenomenon. Journal of Consumer Psychology, 7(2), 131–157. Consistent, credible brand signals reduce customer uncertainty → trust accumulates only when identity stays consistent over time
Law of Identity Continuity|Entity LinkingShen, W., Wang, J., & Han, J. (2015). Entity Linking with a Knowledge Base: Issues, Techniques, and Solutions. IEEE Transactions on Knowledge and Data Engineering, 27(2), 443–460. Systems link text back to the same entity by name and context → only a consistent name lets AI link back to the same merchant
Law of Independent Verification|Audit IndependenceDeAngelo, L. E. (1981). Auditor size and audit quality. Journal of Accounting and Economics, 3(3), 183–199. Verification quality depends on the ability to find problems and the willingness to report them truthfully → verification conclusions do not change with the client relationship
Law of Independent Verification|Quality Disclosure and CertificationDranove, D., & Jin, G. Z. (2010). Quality Disclosure and Certification: Theory and Practice. Journal of Economic Literature, 48(4), 935–963. The effect of third-party certification depends on the certifier's incentives and practices → the overall theoretical reference for IDA verification
Law of Fact Primacy|Data QualityWang, R. Y., & Strong, D. M. (1996). Beyond Accuracy: What Data Quality Means to Data Consumers. Journal of Management Information Systems, 12(4), 5–33. Data quality covers not only accuracy but also completeness, timeliness, and interpretability → verify each merchant fact item by item and mark its validity period
Law of Claim Traceability|Attribution of Generated ContentRashkin, H., Nikolaev, V., Lamm, M., Aroyo, L., Collins, M., Das, D., Petrov, S., Tomar, G. S., et al. (2023). Measuring Attribution in Natural Language Generation Models. Computational Linguistics, 49(4), 777–840.Factual sentences in AI-generated content must point back to an identified source → every claim comes with traceable support
Law of Claim Traceability|Data provenanceBuneman, P., Khanna, S., & Tan, W.-C. (2001). Why and Where: A Characterization of Data Provenance. Database Theory — ICDT 2001, Lecture Notes in Computer Science 1973, pp. 316–330.Data must be able to answer “why it was produced and where it came from” → link every claim back to concrete evidence
Law of External Corroboration|Communicator biasEagly, A. H., Wood, W., & Chaiken, S. (1978). Causal inferences about communicators and their effect on opinion change. Journal of Personality and Social Psychology, 36(4), 424–435. Listeners infer why a speaker says what they say → a First-Party Source's claim is stronger when paired with independent corroboration
Law of External Corroboration|Triangulated VerificationJick, T. D. (1979). Mixing Qualitative and Quantitative Methods: Triangulation in Action. Administrative Science Quarterly, 24(4), 602–611. Evidence from different sources can be checked against each other → read the Official Source, First-Party Source, and Third-Party Source together
Law of Full-Journey Outcomes|Needs met without a clickLi, J., Huffman, S., & Tokuda, A. (2009). Good abandonment in mobile and PC internet search. Proceedings of the 32nd International ACM SIGIR Conference on Research and Development in Information Retrieval (SIGIR '09), pp. 43–50.When users leave without clicking, part of the reason is that the results page already met their need → content use at the answer stage is itself an outcome
Law of Full-Journey Outcomes|Customer equity and return on marketingRust, R. T., Lemon, K. N., & Zeithaml, V. A. (2004). Return on Marketing: Using Customer Equity to Focus Marketing Strategy. Journal of Marketing, 68(1), 109–127. Marketing investment must connect to customers' long-term value → nine metrics run from the front end all the way to return visits
S6 Mention|Consideration setHauser, J. R., & Wernerfelt, B. (1990). An Evaluation Cost Model of Consideration Sets. Journal of Consumer Research, 16(4), 393–408. Evaluation has a cost, so customers put only some brands into their consideration set → AI Mention Rate is the chance of making the shortlist
S6 Mention|Recall drives choiceNedungadi, P. (1990). Recall and Consumer Consideration Sets: Influencing Choice without Altering Brand Evaluations. Journal of Consumer Research, 17(3), 263–276. A brand that is recalled and enters the consideration set can change the choice → being mentioned by AI is itself an outcome
S8 Act|Levels of automationParasuraman, R., Sheridan, T. B., & Wickens, C. D. (2000). A model for types and levels of human interaction with automation. IEEE Transactions on Systems, Man, and Cybernetics – Part A, 30(3), 286–297. Automation comes in four types: information acquisition, analysis, decision, and action → tell whether AI Agents are looking up information or getting things done for the customer
S10 Return|Expectation confirmationBhattacherjee, A. (2001). Understanding Information Systems Continuance: An Expectation-Confirmation Model. MIS Quarterly, 25(3), 351–370. When use meets expectations, people are more willing to keep using → return visits show whether customers are willing to ask again and come back
AI Impressions|Times read and how much the model remembersKandpal, N., Deng, H., Roberts, A., Wallace, E., & Raffel, C. (2023). Large Language Models Struggle to Learn Long-Tail Knowledge. Proceedings of the 40th International Conference on Machine Learning (ICML 2023), PMLR 202, pp. 15696–15707. arXiv:2211.08411.A model's chance of getting a fact right depends on how many relevant documents are in its training data → the number of times content is copied back for training is worth measuring
AI Impressions|Repetition and model memoryCarlini, N., Ippolito, D., Jagielski, M., Lee, K., Tramèr, F., & Zhang, C. (2023). Quantifying Memorization Across Neural Language Models. ICLR 2023. arXiv:2202.07646. The more often content repeats in the training data, the more easily the model memorizes it verbatim → the value of S3 Train
AI Visibility|Brand salienceRomaniuk, J., & Sharp, B. (2004). Conceptualizing and measuring brand salience. Marketing Theory, 4(4), 327–342. Brand salience is how easily a brand is noticed and recalled in a buying situation → AI Mention Rate measures the chance a brand is recalled in AI answers
Performance Metrics|Construct validityCronbach, L. J., & Meehl, P. E. (1955). Construct validity in psychological tests. Psychological Bulletin, 52(4), 281–302. A metric must prove it measures the concept it is named for → each of the Performance Metrics states clearly what it measures
IDA Third-Party Verification|Credence goodsDarby, M. R., & Karni, E. (1973). Free Competition and the Optimal Amount of Fraud. The Journal of Law and Economics, 16(1), 67–88. Some qualities are hard for customers to judge even after use → leave facts like licenses and professional credentials to third-party verification
Warm Start|Crawler revisit schedulingCho, J., & Garcia-Molina, H. (2003). Effective page refresh policies for Web crawlers. ACM Transactions on Database Systems, 28(4), 390–426. Crawler resources are limited, so revisit frequency is allocated by weighing how much pages change → the mechanism reference for Warm Start
Compounding Lead|Preferential attachmentBarabási, A.-L., & Albert, R. (1999). Emergence of Scaling in Random Networks. Science, 286(5439), 509–512. As a network grows, new links favor nodes that already have more links → the network-science reference for Compounding Lead
Compounding Lead|Cumulative advantageMerton, R. K. (1968). The Matthew Effect in Science. Science, 159(3810), 56–63. Those who already have a reputation receive more recognition and attention → content used early has a better chance of being used again
Living Theory|Research programmeLakatos, I. (1970). Falsification and the Methodology of Scientific Research Programmes. In I. Lakatos & A. Musgrave (Eds.), Criticism and the Growth of Knowledge (pp. 91–196). Cambridge: Cambridge University Press.A research programme has core claims and progresses by continually predicting new facts → the Seven Laws are the core, and new data each month keeps testing them
Living Theory|Design scienceHevner, A. R., March, S. T., Park, J., & Ram, S. (2004). Design Science in Information Systems Research. MIS Quarterly, 28(1), 75–106. A designed method must be built, evaluated, and refined repeatedly in real settings → monthly live tests are used to revise the diagnostics and metrics

All entries were checked one by one on 2026-10-11 against publication records and official pages for author, year, title, and source; entries marked “preprint” have not been peer-reviewed. The Goodhart's Law paper was presented in 1975 and published in a collected volume in 1976. Official documentation keeps being updated; the content on the date of access applies. In the table, what comes before “→” is the literature's original statement, and what comes after “→” is how IDAEO applies it; IDAEO's conclusions come from real-world measurement, based on the measured data in each chapter, and the literature is their theoretical reference.

Appendix: Claim Basis Table

The claims in each chapter’s “Key Points of This Chapter” total 57, and each one is marked with what it rests on: First-Party Data (IDAEO’s own measurement records), Platform or Standards Documents (official documents from AI platforms and standards bodies), Academic Literature (the theoretical foundations and the numbered entries in the reference list), Rule of Thumb (industry or author rules of thumb, not measured on this site), and Theory Definition (IDAEO’s own definitions and forecasts). One claim can rest on several types at once. The classification was made independently by three reviewers, arbitrated against the data ledger, and then confirmed by the author. These are the basis types of the claims, which is a different matter from the Official Source, First-Party Source, and Third-Party Source of “Triangulated Verification” in Chapter 4.

ClaimBasis TypeReferencesNotes
Chapter 0 — IDAEO: AI-Era Marketing
IDAEO is AI-Era Marketing: it links the complete journey through real-world website measurement, credible facts, and theory.Theory Definition
AI Impressions provide a foundation for the rest of the journey; impressions do not guarantee that the later steps will happen.First-Party Data, Academic Literature, Theory Definition[59] Arthur, W. B. (1989); [95] Merton, R. K. (1968)
The seven laws are the core, the five dimensions are the framework, and the nine elements are the components (see Chapter 8).Theory Definition
The Five Dimensions of IDAEO Marketing link the whole process: Audience Strategy (who it is for), Journey Design (which steps to take), Trust and Verification (why anyone should believe it), Service Tiers (which tier to deliver), and Performance Measurement (how results are counted).Theory Definition
The Nine Elements of the IDAEO Framework correspond to one another: Marketing Audiences, Optimization Domains, Customer Journey, Journey Diagnostics, IDAEO Solutions, Verification Principles, Service Tiers, Performance Metrics, and First-Party Data.Theory Definition
IDAEO is a Living Theory.Academic Literature, Theory Definition[96] Lakatos, I. (1970)
Chapter 1 — Audience Strategy (Who to Target): Five Marketing Audiences and Six Optimization Domains
The Five Marketing Audiences are Humans, Search Engine Crawlers, AI Crawlers, AI Agents, and Automated Bots.Platform or Standards Documents, Academic Literature, Theory Definition[40] Gal, M. S., & Elkin-Koren, N. (2017); [68] Google (2025)
Classify AI traffic by function first, then look at the AI Platforms.Platform or Standards Documents, Theory Definition[61] OpenAI. Overview of OpenAI Crawlers. OpenAI developer documentation (accessed 2026-10-11); [62] Anthropic. Does Anthropic crawl data from the web, and how can site owners block the crawler?
Visits by AI Agents have been observed, and their scale is still being tracked.First-Party Data, Academic Literature, Theory Definition[40] Gal, M. S., & Elkin-Koren, N. (2017)From the 7th revision, the forecast that AI Agents will be the "main force" is dropped; the book only states they have appeared and are being tracked. 18.09 million = 17.95 million automated browsing + 144,000 named agents, from First-Party Data.
The Six Optimization Domains are SEO, AIO, AEO, GEO, LLMO, and MEO. SEO builds the search index, AIO focuses on search engine AI Overviews, and AEO gets AI answers to use your content. GEO improves visibility in generative answers, LLMO corresponds to copying back for training, and MEO corresponds to Local Search. AEO and GEO both operate at the answer stage, and AIO is linked to AEO. Building the AI index is the name of an S4 function, not GEO.Academic Literature, Theory Definition[31] Aggarwal, P., Murahari, V., Rajpurohit, T., Kalyan, A., Narasimhan, K., & Deshpande, A. (2024). GEO: Generative Engine Optimization
AI, search engines, and Automated Bots combined: 105.5 million (since Mar 3; these are platform-scale figures and cannot be compared directly with a single merchant's website). Organic Traffic from Humans: 310,000 (since Aug 26). Requests before Aug 24 may include duplicates.First-Party Data
AI Crawlers read content 52.2 million times for training and 3.99 million times for building the AI index (including 2.82 million by the site's own Cloudflare AI Search), and made 650,000 real-time reads.First-Party Data, Platform or Standards Documents[61] OpenAI. Overview of OpenAI Crawlers. OpenAI developer documentation (accessed 2026-10-11)
The Optimization Domains in Figure 1-1, “Panorama of the Five Marketing Audiences,” list the abbreviation and its full name, with terms for the same domain listed below.Theory Definition
Chapter 2 — Journey Design (Which Steps to Take): AI Customer Journey: Four Phases, Ten Steps
AI Customer Journey: Four Phases, Ten Steps—S1 Merchant Readiness, S2–S4 AI Information Acquisition, S5–S8 AI-Assisted Decision and Action, S9–S10 Customer Conversion and Re-engagement. S1–S10 are diagnostic checkpoints, not a sequence every customer must follow.Academic Literature, Theory Definition[5] Court, D., Elzinga, D., Mulder, S., & Vetvik, O. J. (2009); [22] Lemon, K. N., & Verhoef, P. C. (2016)
Each step has a diagnostic question to check where the merchant is getting stuck.Academic Literature, Theory Definition[28] Shostack, G. L. (1984)
In S1 the merchant prepares its information; S2–S4 are led by crawlers; S5–S7 are human–AI interaction; in S8 AI Agents act; S9–S10 are customer conversion and re-engagement.Platform or Standards Documents, Academic Literature, Theory Definition[86] Parasuraman, R., Sheridan, T. B., & Wickens, C. D. (2000)
S10 loops back to S5, forming a continuous cycle.Academic Literature, Theory Definition[5] Court, D., Elzinga, D., Mulder, S., & Vetvik, O. J. (2009)
Crawls in S2–S5, site arrivals in S8, and customer visits in S9 are measured first-party by IDAEO; indexing and search impressions (not AI mentions) come from search platforms; mentions and answers in S6–S7 are tracked by IDAEO live tests.First-Party Data, Platform or Standards Documents
Chapter 3 — Measurement Sources and the AI Black Box: The Data Foundation of Performance Measurement
The AI black box is the training, ranking, mentions, answers, and actions that happen inside AI platforms.Theory Definition
IDAEO measures both ends of the black box, then uses platform data and periodic live tests to measure the results of content use.First-Party Data, Platform or Standards Documents, Academic Literature, Theory Definition[81] Jick, T. D. (1979)
Periodic live tests of TK Lin's personal IDA record whether it appears in AI search source lists.First-Party DataOf the five AI models, four were queried through Perplexity’s search interface.
Results from each source are read separately by unit.Academic Literature, Theory Definition[57] Gordon, B. R., Zettelmeyer, F., Bhargava, N., & Chapsky, D. (2019)
The platform AI Citations figure published in this book comes from Copilot: the IDAEO platform has been cited 31,700 times since Jul 22.Platform or Standards Documents
Chapter 4 — Trust and Verification (Why Believe It): Credible Facts and External Corroboration
IDAEO uses credible facts and external corroboration to turn merchant claims into a basis AI can cite.Academic Literature, Theory Definition[76] Dranove, D., & Jin, G. Z. (2010)
Law of Fact Primacy: credible content starts from verified facts.Academic Literature, Theory Definition[77] Wang, R. Y., & Strong, D. M. (1996)
Law of Claim Traceability: every claim has a traceable basis.Academic Literature, Theory Definition[9] Hovland, C. I., & Weiss, W. (1951); [78] Rashkin, H., Nikolaev, V., Lamm, M., Aroyo, L., Collins, M., Das, D., Petrov, S., Tomar, G. S., et al. (2023). Measuring Attribution in Natural Language Generation Models
Law of External Corroboration: a credible claim must have external corroboration.Academic Literature, Theory Definition[80] Eagly, A. H., Wood, W., & Chaiken, S. (1978); [81] Jick, T. D. (1979)
Verify facts one by one, and keep confirming they are still current.Academic Literature, Theory Definition[77] Wang, R. Y., & Strong, D. M. (1996)
Chapter 5 Service Tiers (How Far to Go): AEO Exposure — Read first; AEO+ Word of Mouth — Named in the answer; IDA Brand PR — Answered right, visit, return
Service tiers build on the earlier foundations: AEO Exposure — Get Read First (S1–S4), AEO+ Word of Mouth — Get Mentioned (S5–S6), and IDA Brand PR — Accurate Answers, Visits, and Returns (S7–S10, including the first two tiers), so the full journey S1–S10 is completely covered.Academic Literature, Theory Definition[15] Paulk, M. C., Curtis, B., Chrissis, M. B., & Weber, C. V. (1993); [17] Lavidge, R. J., & Steiner, G. A. (1961)
Each higher service tier includes the tier below it.Academic Literature, Theory Definition[15] Paulk, M. C., Curtis, B., Chrissis, M. B., & Weber, C. V. (1993)
The nine Performance Metrics are AI Readiness Score, AI Crawl Volume, AI Real-Time Retrievals, AI Mention Rate, AI Answer Accuracy Rate, AI Citations, AI Agent Visits, Search & AI Referral Visits, and AI Return Visits.Academic Literature, Theory Definition[56] Campbell, D. T. (1979); [83] Rust, R. T., Lemon, K. N., & Zeithaml, V. A. (2004)
AEO+ Word of Mouth helps merchants stay on top of AI mentions; IDA Brand PR includes the AI Visibility results IDAEO publishes periodically.Theory Definition
Chapter 6 — Performance Measurement (How to Count Results): AI Impressions and Full-Journey Value
AI Content Use at every stage counts as a result. Results at each stage must be assessed separately; an earlier stage cannot stand in for a later one.Platform or Standards Documents, Academic Literature, Theory Definition[82] Li, J., Huffman, S., & Tokuda, A. (2009)
An AI Crawl Volume of 97.46 million is what this book calls AI Impressions. This includes reads by search engines for indexing.First-Party Data, Academic Literature, Theory Definition[88] Kandpal, N., Deng, H., Roberts, A., Wallace, E., & Raffel, C. (2023)
Reads for AI Answers, 46.05 million, include reads for search indexing and AI answers.First-Party Data, Theory Definition
AI Real-Time Retrievals, 650,000, are content use triggered by immediate demand.First-Party Data, Platform or Standards Documents, Academic Literature[1] Lewis, P., Perez, E., Piktus, A., Petroni, F., Karpukhin, V., Goyal, N., Küttler, H., Lewis, M., et al. (2020). Retrieval-Augmented Generation for Knowledge-Intensive NLP Tasks; [61] OpenAI. Overview of OpenAI Crawlers. OpenAI developer documentation (accessed 2026-10-11); [63] Perplexity. Perplexity Crawlers. Perplexity official documentation (accessed 2026-10-11)
The IDAEO platform's 31,700 AI Citations mean its content was listed as a source in answers.Platform or Standards Documents, Theory Definition
AI Agent Visits, 18.09 million, represent the volume of site arrivals. Whether actions were completed on customers' behalf still depends on subsequent results.First-Party Data, Academic Literature, Theory Definition[86] Parasuraman, R., Sheridan, T. B., & Wickens, C. D. (2000)
Search & AI Referral Visits, 310,000 (search and AI combined; Google 268,000), represent customers arriving at the site via search or AI.First-Party Data
Cold Start: AI traffic accumulates from 0; the industry rule of thumb is about 90 days.First-Party Data, Rule of ThumbAbout 90 days is an industry rule of thumb, not measured on this site (confirmed by the author on 2026-10-13); monthly reads from 53 → 35.99 million are first-party data.
Warm Start: content meets S1 and goes live on an AI Traffic Hub. The rule of thumb is about 30 days, not a deadline for crawler arrival. A separate Cold Start observation from a single site found a gap of 30–35 days before the next crawler from the same platform (Figure 6-6). For three platforms, this is a lower bound and cannot be used to estimate Warm Start timing. TK Lin's personal IDA case reached S7 (Answer) in 14 days.First-Party Data, Academic Literature, Rule of Thumb[93] Cho, J., & Garcia-Molina, H. (2003)About 30 days is a rule of thumb; the 30–35-day gap before the next crawler from the same AI platform is measured in Figure 6-6; 14 days and 84% come from TK Lin’s personal IDA field test (confirmed by the author on 2026-10-13).
The necessary condition for an AI Traffic Hub is accumulating ten million or more AI requests per month.First-Party Data, Theory Definition
The early-mover dividend in AI traffic means preparing information early so arriving crawlers can read it.First-Party Data, Academic Literature, Theory Definition[58] Lieberman, M. B., & Montgomery, D. B. (1988)
Compounding Lead is currently a hypothesis: whether accumulating AI impressions can widen a lead remains to be verified.First-Party Data, Academic Literature, Theory Definition[59] Arthur, W. B. (1989); [94] Barabási, A.-L., & Albert, R. (1999)
Chapter 7 — IDAEO Field Results: Our Own Site and Early Field-Test Merchants
IDAEO is field-tested not only on the IDAEO site itself and Washinmura; early field-test merchants also contribute field data.First-Party Data, Platform or Standards Documents
The small and medium-sized businesses in the field test saw the following changes during their time on the IDAEO platform.First-Party Data, Platform or Standards Documents, Theory Definition
① Measurement officially launched → Law of Full-Journey Outcomes (Performance Measurement); ② Search exposure rolled out in parallel → Law of Audience Adaptation (Audience Strategy); ③ First visitor arrived via an AI answer → Journey Design: S9 Visit.First-Party Data, Theory Definition
④ Brand knowledge presentation fully upgraded → Law of Identity Continuity (S1 Merchant Readiness); ⑤ Research-Evidence-Driven Optimization → Theoretical foundation: 17 existing theories; ⑥ New IDAEO site built → Five Dimensions and Nine Elements.Theory Definition
⑦ Crawl performance hit a new peak → AI Impressions (S2–S4 AI Information Acquisition); ⑧ Cumulative requests passed one hundred million → Compounding Lead and Living Theory.First-Party Data, Theory Definition
Among the first batch of merchant websites that joined the field test and have complete records for both May and September, most grew and some did not. For the websites that grew, site-wide opens from May to September were as follows: a parenting content site rose from 52,817 to 55,286, a food-service equipment manufacturer from 842 to 1,275, an event staging design firm from 442 to 1,741, a leather goods brand from 555 to 908, a hair salon from 74 to 128, and a studio from 3 to 329.First-Party Data
The IDA pages of the second batch of field-test industries received 373,776 AI impressions from Jul 18–Oct 8 (the number of times they were read by AI and search engine crawlers).First-Party Data
Chapter 8 — AI Visibility and Theoretical Foundations
External AI Visibility mainly corresponds to the answer phase, S5–S7.Academic Literature, Theory Definition[31] Aggarwal, P., Murahari, V., Rajpurohit, T., Kalyan, A., Narasimhan, K., & Deshpande, A. (2024). GEO: Generative Engine Optimization
The fundamentals of AI Visibility are S1–S4Academic Literature, Theory Definition[88] Kandpal, N., Deng, H., Roberts, A., Wallace, E., & Raffel, C. (2023)
IDAEO connects the foundation of S1–S4 with the action, conversion, and return of S8–S10 in a single journey.Academic Literature, Theory Definition[83] Rust, R. T., Lemon, K. N., & Zeithaml, V. A. (2004)
IDAEO’s theoretical foundations fall into eight categories: marketing fundamentals, generative engine and AI search research, AI customers and AI Agents, information retrieval and credibility, performance measurement, start-up and accumulation, official documentation of AI Platforms and agent protocols, and the theory behind the seven laws and the journey.Theory Definition
The figure lists 17 existing theories; see “Theoretical Foundations and References” at the end of the book for the full references.Theory Definition
Each month’s new data and field verification keep strengthening IDAEO’s theoretical and empirical foundation.Academic Literature, Theory Definition[96] Lakatos, I. (1970); [97] Hevner, A. R., March, S. T., Park, J., & Ram, S. (2004)

Data Notes

  • First-Party Data: taken from IDAEO's first-party measurement records. The period is Mar 3, 2026–Oct 8, old site and new site combined. AI, search engines, and Automated Bots total 105.5 million requests (105,487,618). This is consistent with IDAEO's approved basis. These are platform-site totals and cannot be compared directly with a single business's official website. Records before Aug 24 may include duplicate requests. AI Crawl Volume is 97.46 million, listed by the purpose of the requests. Copied back for training: 52.2 million. This means requests made for training. Building the AI index: 3.99 million (including 2.82 million from our own Cloudflare AI Search, to be deducted in next month's update). Building the search index: 41.26 million. The indexing figures only indicate requests made for indexing. These requests do not mean the content has been used in training or included in an index. Applebot, PetalBot, YouBot, and Kagibot are classified as Search Engine Crawlers. The classification follows each company's official documentation (checked Oct 14, 2026).
  • AI Agents: 17.95 million is automated browsing from Aug 26, 2026–Oct 8, listed separately by the function of programs operating a browser; named AI Agents are 144,000, for a total of 18.09 million. Hermes, OpenClaw, Devin, Grok, and Muse are listed as still being tracked, and named-visit results will be published later; Manus has 14 visits.
  • Humans: Organic Traffic of 310,000 is the number of click-throughs to the website from search or AI (mainly from Aug 26, 2026 onward), of which Google accounts for 268,000; Local Search is still being tracked and will be published later.
  • Automated Bots provide Automated Information Services: “AI tools” refers to requests labeled AI by name and classified by source under other automated services. SEO tool crawlers (Semrush, Majestic, Moz, Ahrefs, etc.) and web page previews (Facebook, LinkedIn, X, etc.) are listed by platform-verified identity (Aug 24, 2026–Oct 8), counted separately, and fall outside the totals above. The identity and function of the 150,000 requests marked “Tracking in Progress” are being confirmed by IDAEO on an ongoing basis, and classification results will be published later.
  • Search result impressions: the breakdowns in each figure are the search platforms' original values (Google 7.41 million, Bing 910,000, totaling 8.32 million); the overview's approximately 8.22 million follows IDAEO's approved basis, a difference of about 100,000. Indexed pages are the September 2026 value; Bing is the sum of its subfolders.
  • TK Lin's personal IDA field test (Oct 3, 2026): 100 questions in five groups of 20 (identity, company, expertise, Washinmura, IDA). The five AI models were Perplexity Sonar, OpenAI GPT-5.4, Anthropic Claude Sonnet 5, Google Gemini 3.5 Flash, and xAI Grok 4.5, for 500 answers in total. 84% means this IDA appeared in the source list the AI retrieved (four of the five models used the same search interface; the questions named the author himself; a single case), corresponding to 419 answers. It appeared 439 times in the source lists, ranking first among all sources. For the 40 questions that name him directly (the identity and company groups), the figure was 91.5% (183 answers), with this IDA appearing 190 times. Oct 11 follow-up: of 16 Perplexity questions in four languages, 13 had this IDA among their sources. A single case cannot be generalized directly to businesses.
  • Start-up time: about 30 days for a Warm Start is a rule of thumb; Figure 6-6, “Cold Start Timeline,” adds a measurement: crawlers from the same AI platform arrive in sequence, 30–35 days apart. About 90 days for a Cold Start is an industry rule of thumb; 14 days is the measured case of TK Lin's personal IDA.
  • Field-test merchants: the first batch of field-test merchants and the second batch of field-test industries are all real operating businesses, and IDAEO has verified each one's identity; by agreement, this book lists only the industry, and merchant names stay in IDAEO's internal records.
  • Publisher: IDAEO is operated by 株式会社和心 (Washin Co., Ltd.; corporate number 8011401020677; Minato-ku, Tokyo, Japan); author TK Lin.
  • Theoretical foundations: all 17 existing sources have been verified one by one, with authors and years listed per the reference list; for six of them, verification covered the publisher's catalog entry and abstract. Goodhart was presented in 1975 and published in 1976. The theoretical basis is grouped into marketing fundamentals, generative engine and AI search research, AI customers and AI Agents, information retrieval and credibility, performance measurement, start-up and accumulation, official documentation of AI Platforms and agent protocols, and the theory behind the Seven Laws and the journey; see “Theoretical Foundations and References” at the end of the book for the full references.
  • External AI Visibility metrics: compiled from vendor documentation and each company's public definitions verified on 2026-10-11; comparisons use the same measurement scope and metric definitions.
  • All logos are trademarks of their respective owners and are used in this book to identify the AI Platforms.
  • The nine Performance Metrics and the IDAEO Solutions use this book's naming; validation data are counted across all platforms, and single-merchant results are measured from that merchant's own data. The measurement methods for AI Mention Rate, AI Answer Accuracy Rate, and AI Return Visits are set; IDAEO continues to accumulate them and will publish them later.
  • Same-domain terms within the Optimization Domains are grouped by this book's functional classification, following each term's context of use; AIO is linked to AEO, and both correspond to AI answers using content. AAO, AXO, AAIO, as well as GAIO and AISO, are listed per the AI Platforms' glossary pages verified on 2026-10-11; SXO, VSO, ASO, CRO, SMO, SGE, and LLM SEO follow common industry usage, and this round's item-by-item verification covered the AI Platforms' glossary terms above.
  • The extended figures follow the visual framework of the introductory course “Website Traffic in the AI Era”; the numbers are compiled from the same first-party measurement records through Oct 8, 2026, and journey steps are always written as S1–S10. The statistical scope of this edition is defined by the items listed in each figure.
  • Read each extended figure by its period: AI requests Mar 3–Oct 8; whole site Feb 12–Oct 8; automated browsing Aug 26–Oct 8; per-site breakdown Aug 20–Oct 8; Copilot citations Jul 22–Oct 8. Before Aug 24, first-party measurement records from multiple sources were merged and may include duplicate requests; when citing, note this scope as well.
  • Copilot citations of 31,700 follow IDAEO's approved basis and cover the formal content scope; the raw aggregate is 52,600.
  • “Reads for AI Answers,” 46.05 million, follows IDAEO's approved basis and includes search indexing and AI Overview generation, AI indexing, real-time retrieval, and named AI Agents. Of this, 41.26 million search-indexing reads are shared by search and AI answers; the rest are summed by function, presenting the scope of content use as a whole.
  • Figure 6-6, “Cold Start Timeline,” shows the record of AI Platforms arriving in sequence. For five of the six AI Platforms, the first crawler and the next were 30–35 days apart. This is the gap between different crawlers from the same AI platform appearing in sequence. Crawlers whose first day is Mar 3, 2026 were already present when measurement began. The listed intervals are calculated from the observation start and represent the lower bound of the actual interval. A Cold Start is a new website's AI traffic accumulating from 0. The industry rule of thumb is about 90 days. A Warm Start has content that meets S1 and goes live on an AI Traffic Hub. This means a platform accumulating ten million or more AI requests per month. The IDAEO platform had 25.97 million in July, 35.99 million in August, and 15.79 million in September. Records before Aug 24 may include duplicate requests, so the counting basis differs before and after that date. The figure for September was lower than for August; keep the counting basis in mind when comparing months. The rule of thumb for a Warm Start is about 30 days. TK Lin's personal IDA case reached S7 in 14 days: live on Sep 20, tested on Oct 3 with 100 questions and five AI models. 84% means this IDA appeared in the source list the AI retrieved (four of the five models used the same search interface; the questions named the author himself; a single case). See the data notes for “TK Lin's Personal IDA Field Test” for limitations. The findings cannot be generalized to businesses.
  • AI Agent Visits of 18.09 million = automated browsing 17.95 million + named AI Agents 144,000. A further 5,102 AI Agent visits came through ordinary browsers; these are counted separately and are not included in any total.
  • Early test merchants, the second batch of test industries, and our own Washinmura official site: merchant-page search clicks, AI-referred customers, AI reads of merchant pages, and merchant official-site opens are taken from IDAEO first-party measurement records (queried 2026-10-10); AI exposure of the second-batch test industries' IDA pages is taken from IDAEO first-party measurement records (queried 2026-10-11, period Jul 18–Oct 8; summed across the 10 platforms or across the three purposes, each totals 373,776); search clicks and Copilot citations for industry official sites are taken from authorized search platform data (queried 2026-10-11), totals only. The Washinmura official site's 109,140 Google search clicks (Mar 3–Oct 8) are taken from search platform data; its 95,333 AI and search engine reads and 11,333 AI real-time retrievals (Aug 20–Oct 8) are taken from IDAEO first-party measurement records. The Google comparison with the same month last year includes only official sites with last year's records; in the Bing total, data for some official sites starts from Aug 13.
Data Sources
  • IDAEO product feature registry (2026-10-09 edition)
  • IDAEO methodology document (2026-10 edition)
  • IDAEO first-party measurement records (data through 2026-10-08)
  • “Website Traffic in the AI Era” introductory course (2026-09-28)
  • Theory and terminology verification log (2026-10-11)
Generated: 2026-10-20 15:34 JST

Free to download, updated monthly

Cover of IDAEO: Marketing in the Age of AI
⬇ Download PDFFull edition · Free
Get each new edition by email
Leave your email to hear about each monthly edition. Unsubscribe anytime.
Take Part in This Book: corrections, counterexamples, field data, partnerships →Changelog

Cite this book

IDAEO: Marketing in the Age of AI · 林毅祥(TK Lin) · 1st edition, 8th revision · · https://km.idaeo.ai/idaeo/textbook?lang=en · CC BY 4.0