Chapter 7
IDAEO Field Results: Our Own Site and Early Field-Test Merchants
How did IDAEO’s own site go from zero to one hundred million requests? What changed for the first batch of joint field-test merchants during the field-test period?
IDAEO Field Results: Our Own Site and Early Field-Test Merchants
This chapter answersHow did IDAEO’s own site go from zero to one hundred million requests? What changed for the first batch of joint field-test merchants during the field-test period?
Why it comes hereOur own site and early field-test merchants provide first-party observational data. There is no control group yet, so this does not show that IDAEO caused the results. Start with the cumulative results in Figure 7-1 “IDAEO Growth Milestones”, then look at the field results for platform merchant pages and merchant websites. First-Party Data from different settings shows the AI impressions, search contact, and customer visits of small and medium-sized businesses.
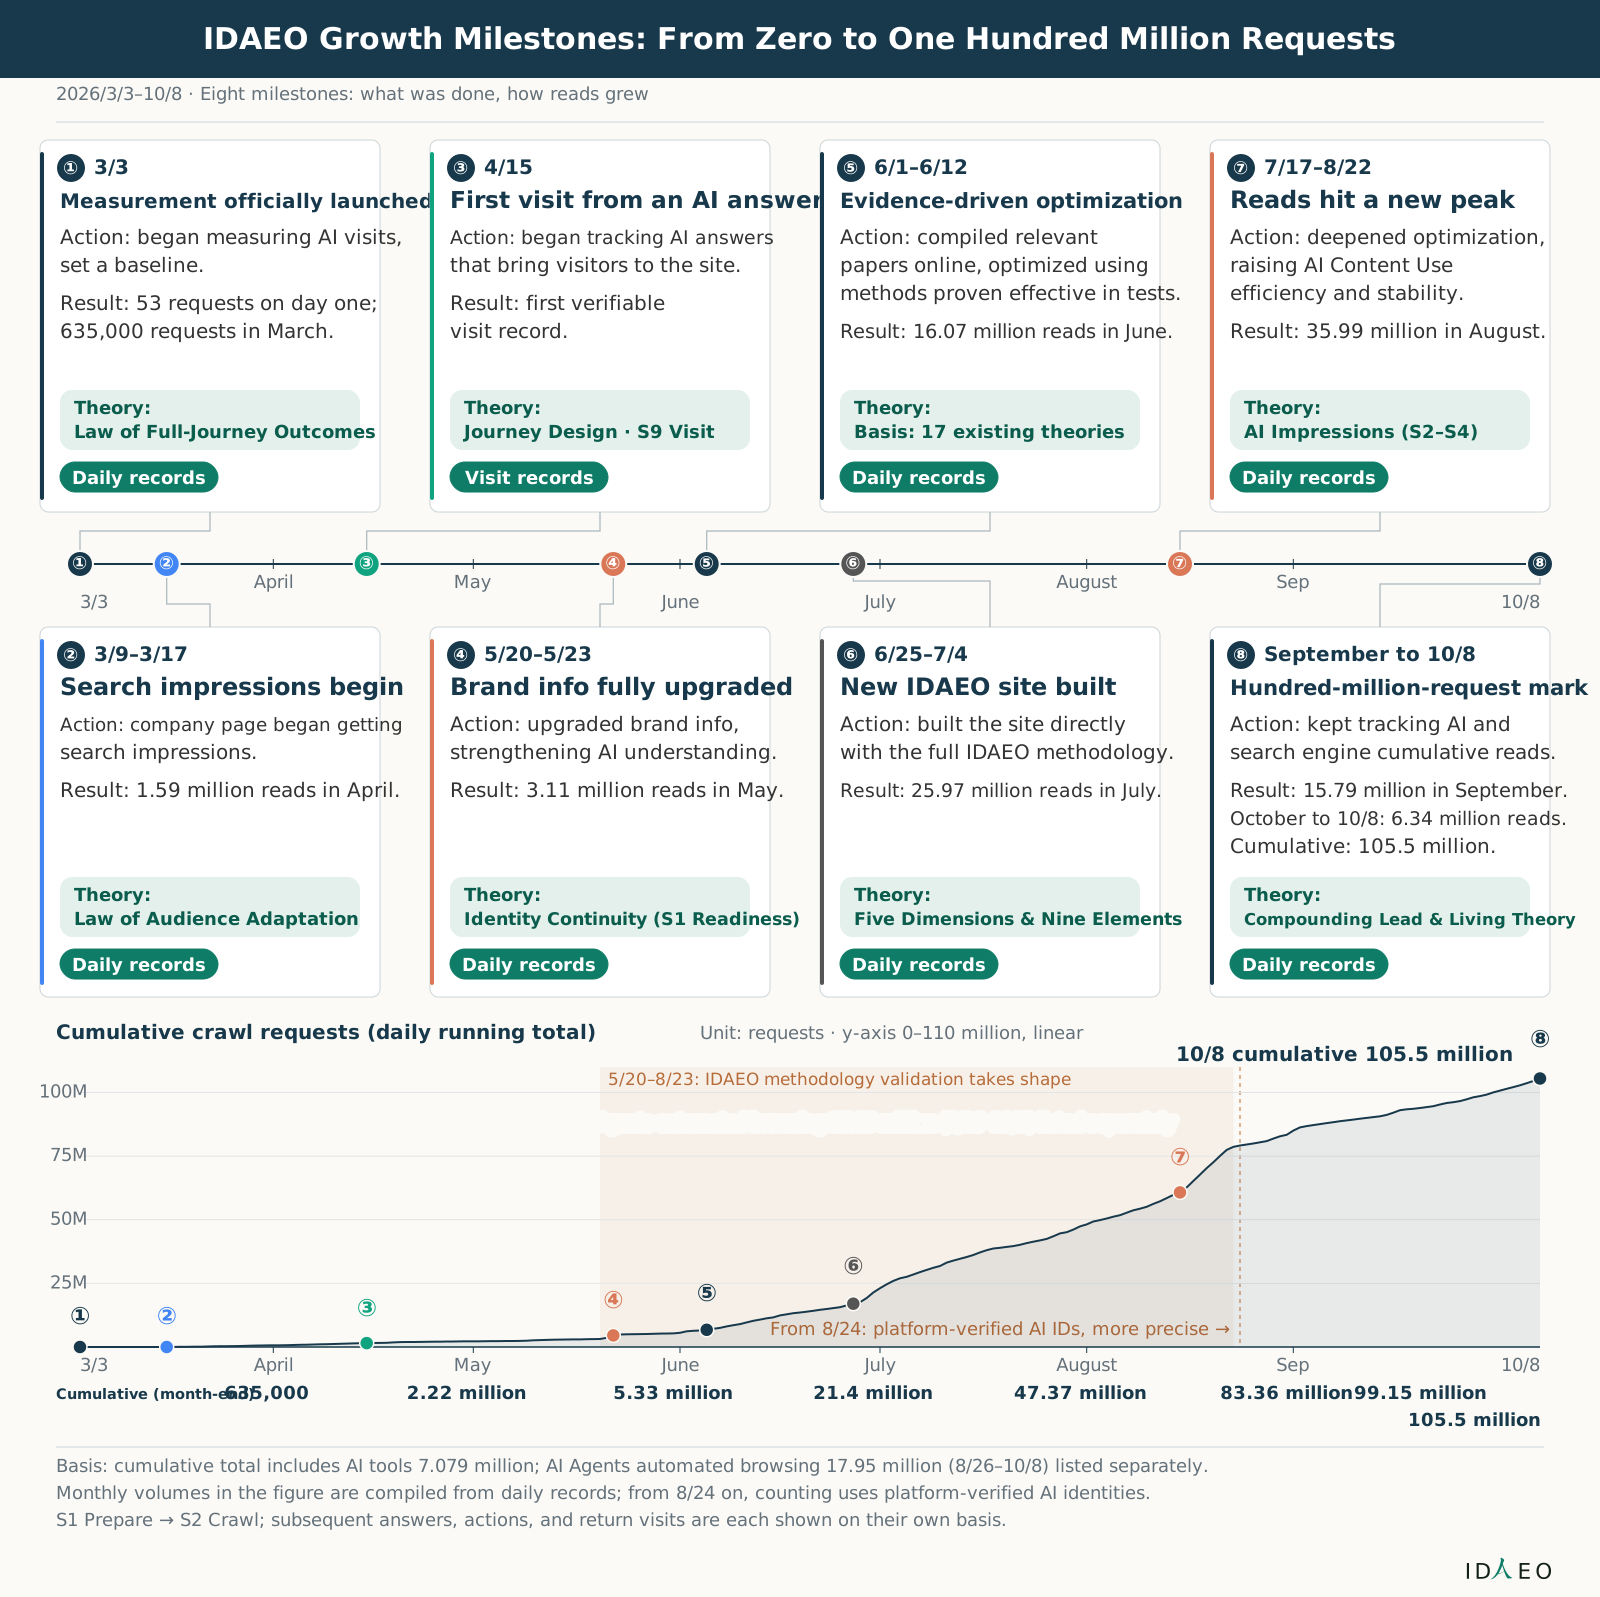
Figure 7-1 IDAEO Growth Milestones: From Zero to One Hundred Million Requests
View as text
Read the title, approach, and reads over the same period for each milestone in order from 1–8, then compare against the cumulative curve. May 20–Aug 23 is the stage in which IDAEO methodology validation took shape. From Aug 24 on, counting uses platform-verified AI identities, which identifies them more precisely. Figures before Aug 24 may include duplicate requests. The corresponding theory is noted under each card.
IDAEO Growth Milestones: From Zero to One Hundred Million Requests
2026/3/3–10/8 · Eight milestones: what was done, how reads grew
①
3/3
Measurement officially launched
Action: began measuring AI visits,
set a baseline.
Result: 53 requests on day one;
635,000 requests in March.
Theory:
Law of Full-Journey Outcomes
Daily records
②
3/9–3/17
Search impressions begin
Action: company page began getting
search impressions.
Result: 1.59 million reads in April.
Theory:
Law of Audience Adaptation
Daily records
③
4/15
First visit from an AI answer
Action: began tracking AI answers
that bring visitors to the site.
Result: first verifiable
visit record.
Theory:
Journey Design · S9 Visit
Visit records
④
5/20–5/23
Brand info fully upgraded
Action: upgraded brand info,
strengthening AI understanding.
Result: 3.11 million reads in May.
Theory:
Identity Continuity (S1 Readiness)
Daily records
⑤
6/1–6/12
Evidence-driven optimization
Action: compiled relevant
papers online, optimized using
methods proven effective in tests.
Result: 16.07 million reads in June.
Theory:
Basis: 17 existing theories
Daily records
⑥
6/25–7/4
New IDAEO site built
Action: built the site directly
with the full IDAEO methodology.
Result: 25.97 million reads in July.
Theory:
Five Dimensions & Nine Elements
Daily records
⑦
7/17–8/22
Reads hit a new peak
Action: deepened optimization,
raising AI Content Use
efficiency and stability.
Result: 35.99 million in August.
Theory:
AI Impressions (S2–S4)
Daily records
⑧
September to 10/8
Hundred-million-request mark
Action: kept tracking AI and
search engine cumulative reads.
Result: 15.79 million in September.
October to 10/8: 6.34 million reads.
Cumulative: 105.5 million.
Theory:
Compounding Lead & Living Theory
Daily records
April
May
June
July
August
Sep
3/3
10/8
①
②
③
④
⑤
⑥
⑦
⑧
Cumulative crawl requests (daily running total)
Unit: requests · y-axis 0–110 million, linear
5/20–8/23: IDAEO methodology validation takes shape
From 8/24: platform-verified AI IDs, more precise →
25M
50M
75M
100M
①
②
③
④
⑤
⑥
⑦
⑧
10/8 cumulative 105.5 million
AI Agents automated browsing 17.95 million (8/26–10/8) listed separately
3/3
April
May
June
July
August
Sep
10/8
Cumulative (month-end)
635,000
2.22 million
5.33 million
21.4 million
47.37 million
83.36 million
99.15 million
105.5 million
Basis: cumulative total includes AI tools 7.079 million; AI Agents automated browsing 17.95 million (8/26–10/8) listed separately.
Monthly volumes in the figure are compiled from daily records; from 8/24 on, counting uses platform-verified AI identities.
S1 Prepare → S2 Crawl; subsequent answers, actions, and return visits are each shown on their own basis.
ID
EO
| Item | Cumulative (month-end) |
|---|---|
| 3/3 | 635,000 |
| April | 2.22 million |
| May | 5.33 million |
| June | 21.4 million |
| July | 47.37 million |
| August | 83.36 million |
| Sep | 99.15 million |
| 10/8 | 105.5 million |
How to readRead the title, approach, and reads over the same period for each milestone in order from 1–8, then compare against the cumulative curve. May 20–Aug 23 is the stage in which IDAEO methodology validation took shape. From Aug 24 on, counting uses platform-verified AI identities, which identifies them more precisely. Figures before Aug 24 may include duplicate requests. The corresponding theory is noted under each card.
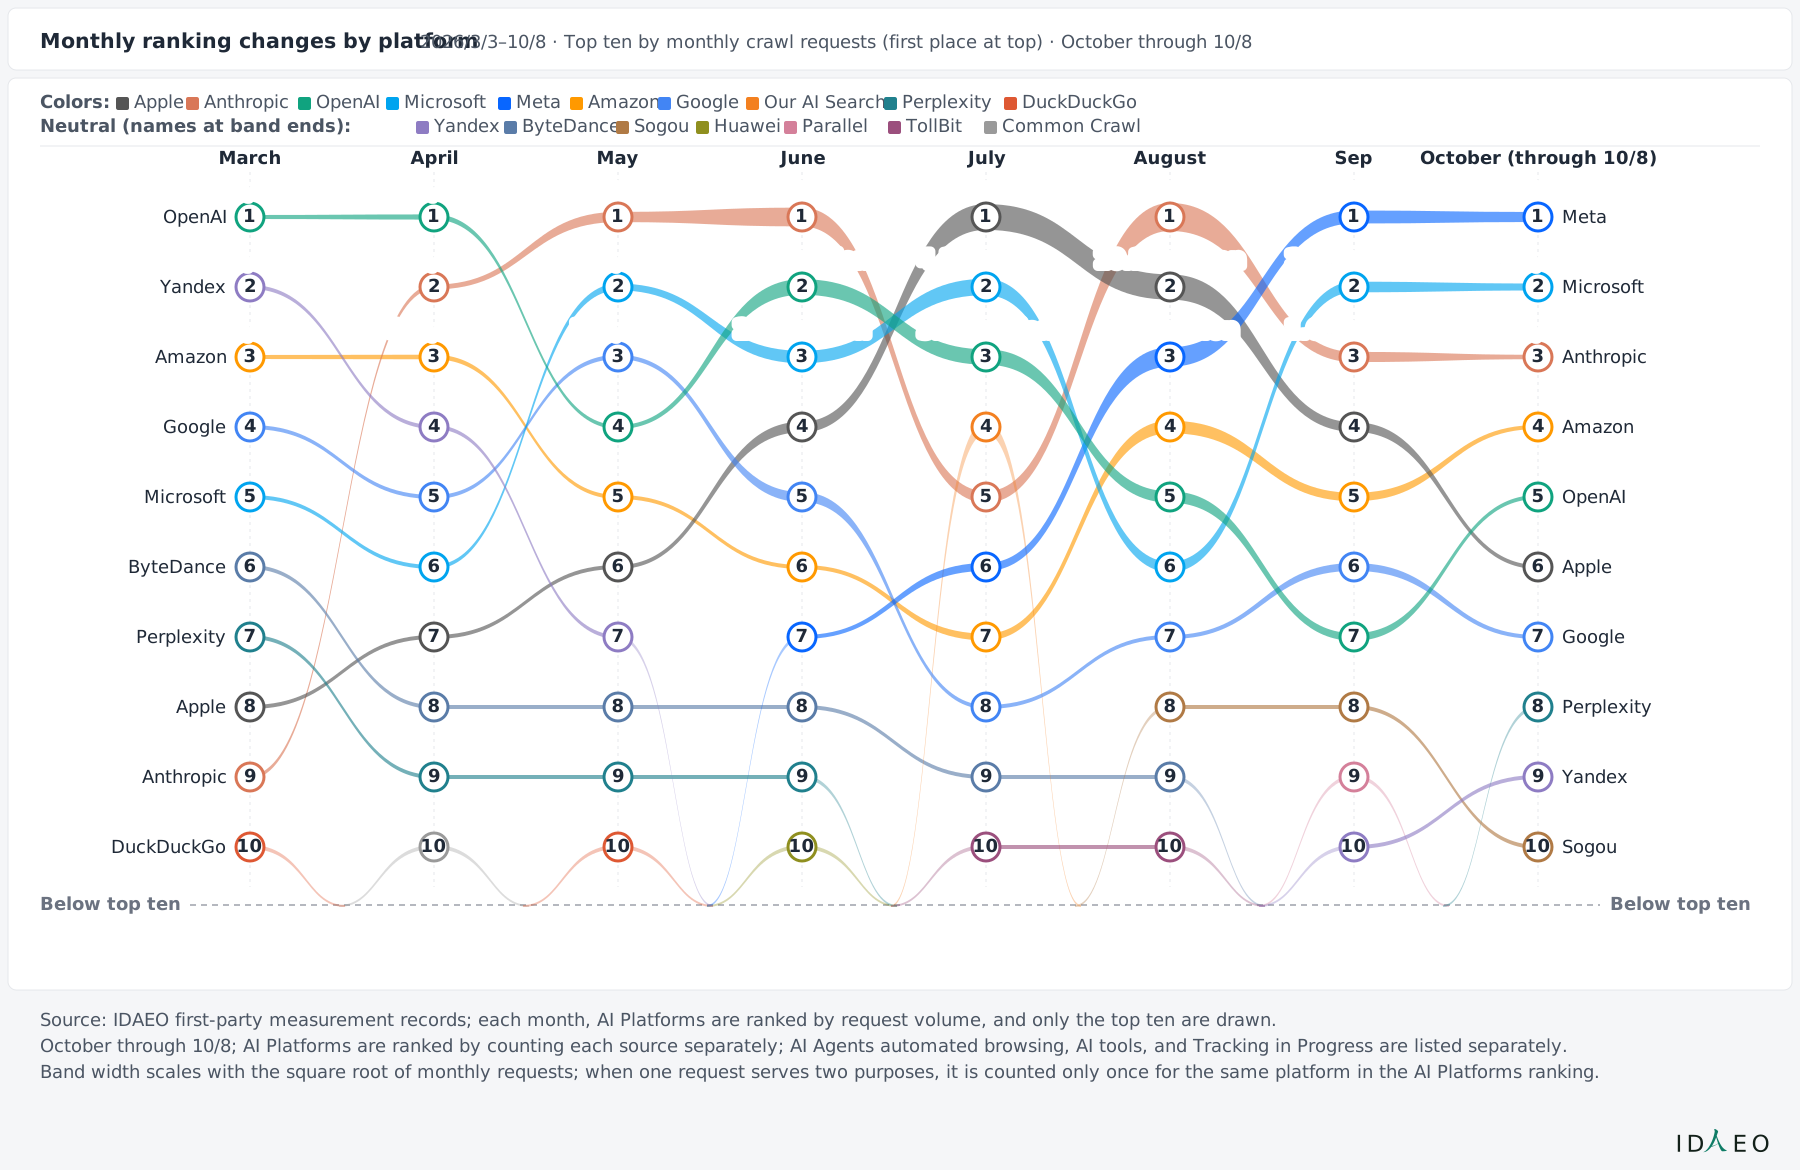
Figure 7-2 Monthly Ranking Shifts of AI Platforms
View as text
Each row is one rank; follow the same-colored line to see each platform’s monthly rank, then read it together with the crawl volume for the same period.
Monthly ranking changes by platform
2026/3/3–10/8 · Top ten by monthly crawl requests (first place at top) · October through 10/8
Colors:
Apple
Anthropic
OpenAI
Microsoft
Meta
Amazon
Google
Our AI Search
Perplexity
DuckDuckGo
Neutral (names at band ends):
Yandex
ByteDance
Sogou
Huawei
Parallel
TollBit
Common Crawl
March
April
May
June
July
August
Sep
October (through 10/8)
Below top ten
Below top ten
1
237,000
2
141,000
3
102,000
4
5
6
7
8
9
10
1
444,000
2
363,000
3
349,000
4
5
6
7
8
9
10
1
1.65 million
2
766,000
3
302,000
4
5
6
7
8
9
10
1
5.73 million
2
3.94 million
3
2.45 million
4
5
6
7
8
9
10
1
10.71 million
2
4.36 million
3
3.83 million
4
5
6
7
8
9
10
1
12.66 million
2
10.22 million
3
6.01 million
4
5
6
7
8
9
10
1
2.69 million
2
1.78 million
3
1.68 million
4
5
6
7
8
9
10
1
1.63 million
2
803,000
3
326,000
4
5
6
7
8
9
10
OpenAI
Yandex
Amazon
Google
Microsoft
ByteDance
Perplexity
Apple
Anthropic
DuckDuckGo
Meta
Microsoft
Anthropic
Amazon
OpenAI
Apple
Google
Perplexity
Yandex
Sogou
Source: IDAEO first-party measurement records; each month, AI Platforms are ranked by request volume, and only the top ten are drawn.
October through 10/8; AI Platforms are ranked by counting each source separately; AI Agents automated browsing, AI tools, and Tracking in Progress are listed separately.
Band width scales with the square root of monthly requests; when one request serves two purposes, it is counted only once for the same platform in the AI Platforms ranking.
ID
EO
| Item | March | Value | October (through 10/8) | Value |
|---|---|---|---|---|
| 1 | OpenAI | 237,000 | Meta | 1.63 million |
| 2 | Yandex | 141,000 | Microsoft | 803,000 |
| 3 | Amazon | 102,000 | Anthropic | 326,000 |
How to readEach row is one rank; follow the same-colored line to see each platform’s monthly rank, then read it together with the crawl volume for the same period.
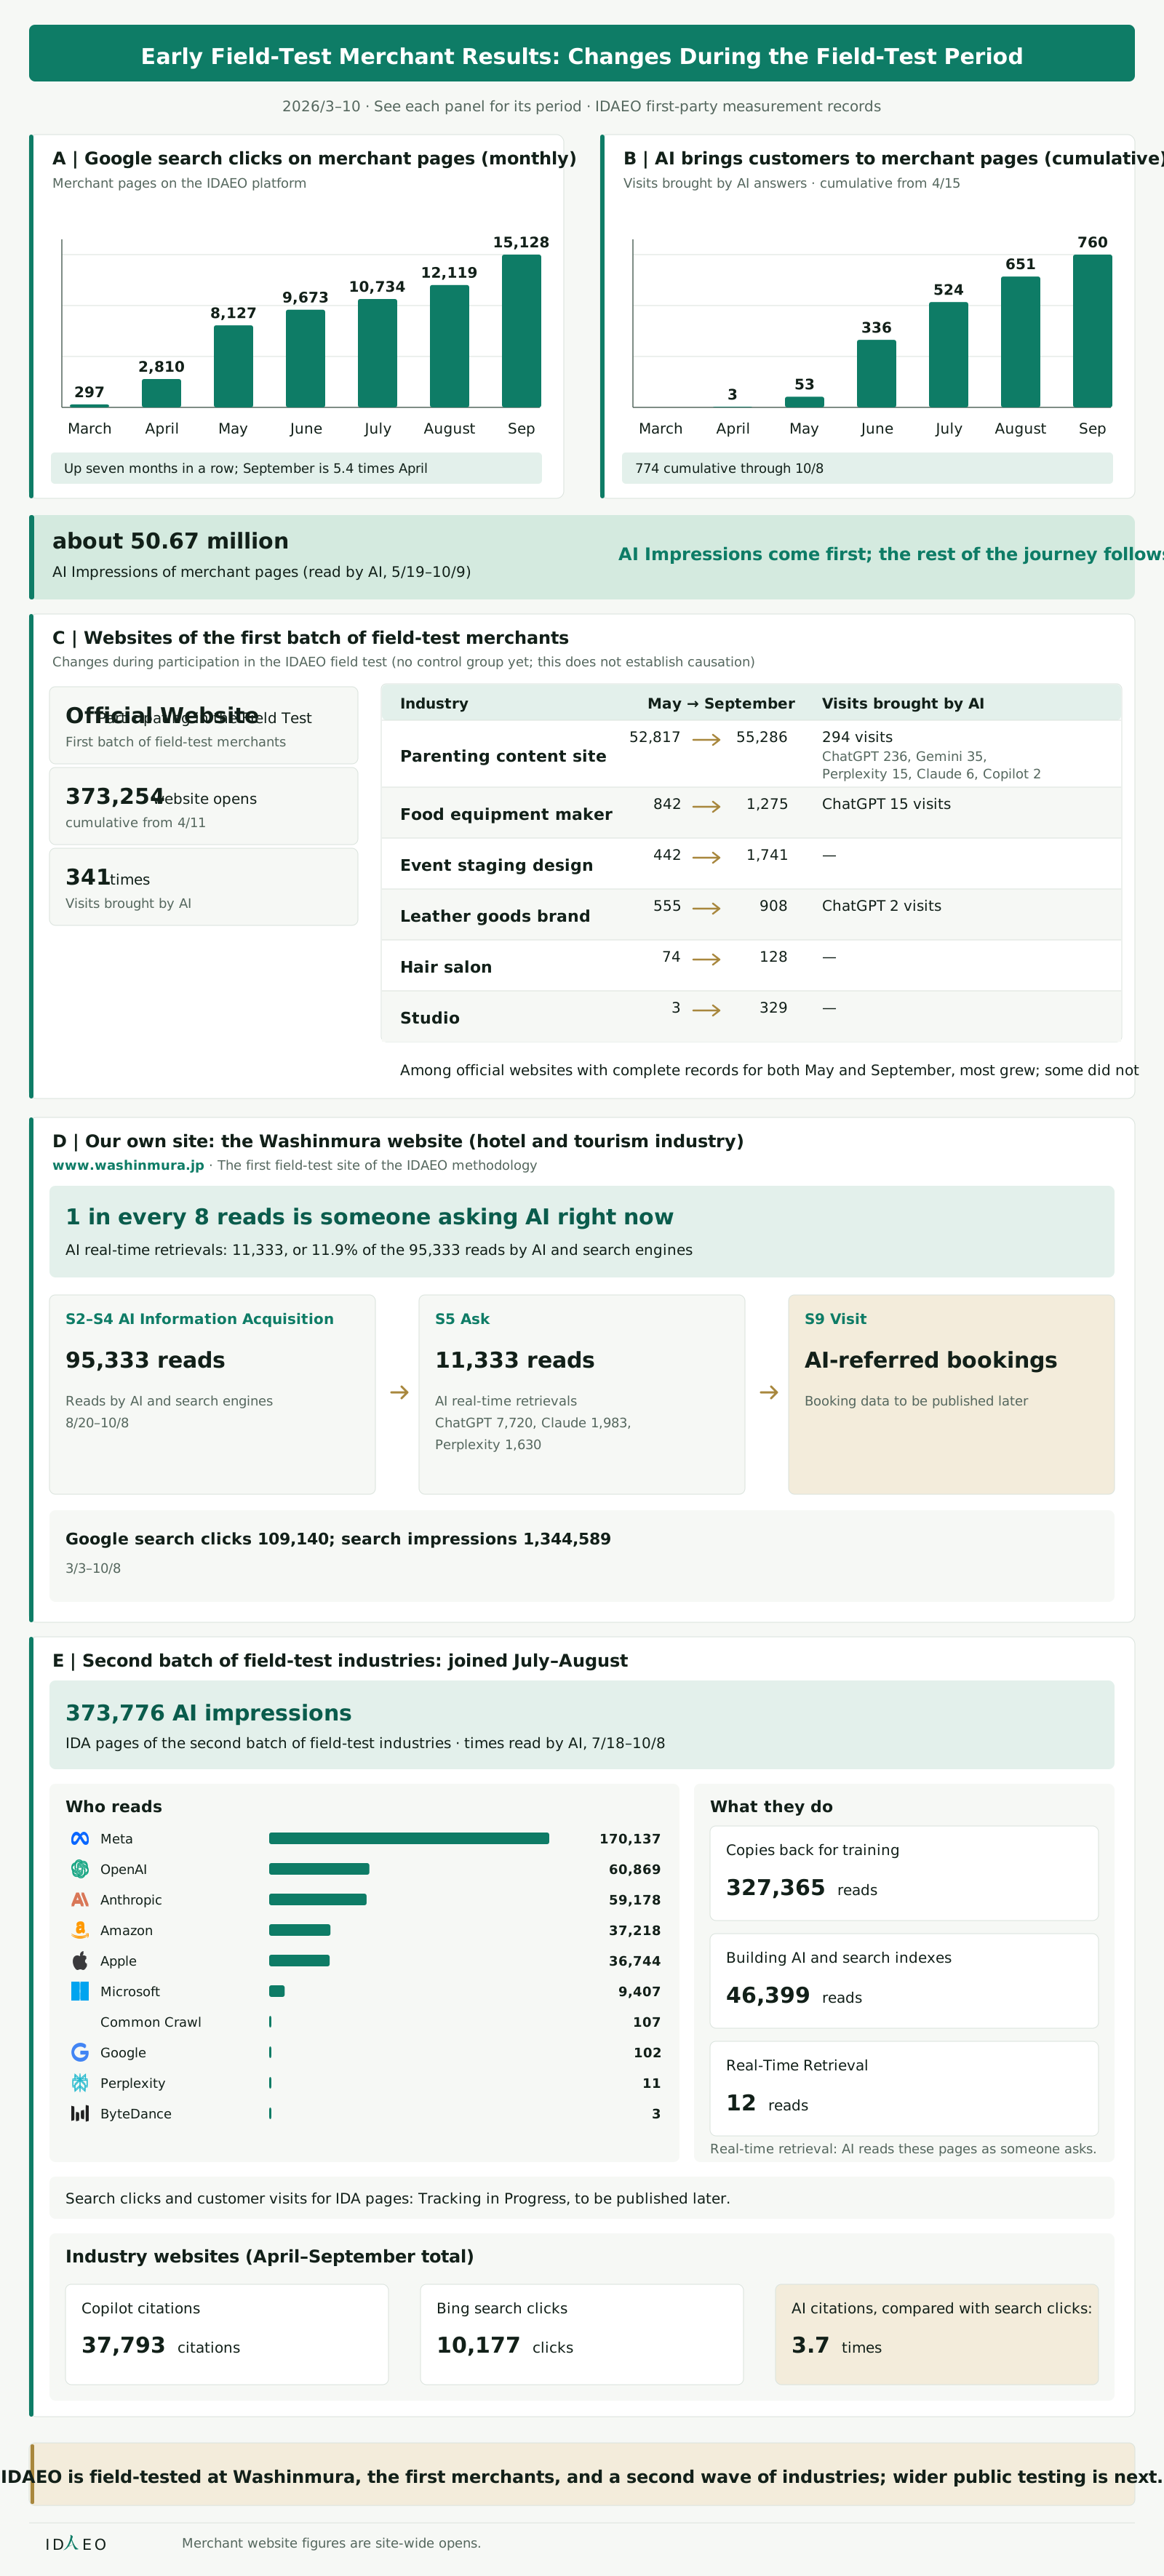
Figure 7-3 Early Field-Test Merchant Results: Changes During the Field-Test Period
View as text
Read from top to bottom. First, look at Google search clicks for IDAEO platform merchant pages, then the cumulative number of times AI brought customers into merchant pages, to see changes during the field-test period. Next, look at changes in the first batch of merchant websites after joining the IDAEO field test. Then look at search clicks, AI crawls, and bookings brought by AI for our own Washinmura website (hotel and tourism industry). Finally, look at AI impressions, the platforms that came to read, and their purposes for the IDA pages of the second batch of field-test industries. Read each figure according to the labeled subject, period, and purpose. The figures for the first batch of merchant websites are site-wide opens. There is no control group yet; these results do not establish causation.
Early Field-Test Merchant Results: Changes During the Field-Test Period
2026/3–10 · See each panel for its period · IDAEO first-party measurement records
A | Google search clicks on merchant pages (monthly)
Merchant pages on the IDAEO platform
March
297
April
2,810
May
8,127
June
9,673
July
10,734
August
12,119
Sep
15,128
Up seven months in a row; September is 5.4 times April
B | AI brings customers to merchant pages (cumulative)
Visits brought by AI answers · cumulative from 4/15
March
April
3
May
53
June
336
July
524
August
651
Sep
760
774 cumulative through 10/8
about 50.67 million
AI Impressions of merchant pages (read by AI, 5/19–10/9)
AI Impressions come first; the rest of the journey follows
C | Websites of the first batch of field-test merchants
Changes during participation in the IDAEO field test (no control group yet; this does not establish causation)
Official Website
Participating in the Field Test
First batch of field-test merchants
373,254
website opens
cumulative from 4/11
341
times
Visits brought by AI
Industry
May → September
Visits brought by AI
Parenting content site
52,817
55,286
294 visits
ChatGPT 236, Gemini 35,
Perplexity 15, Claude 6, Copilot 2
Food equipment maker
842
1,275
ChatGPT 15 visits
Event staging design
442
1,741
—
Leather goods brand
555
908
ChatGPT 2 visits
Hair salon
74
128
—
Studio
3
329
—
Among official websites with complete records for both May and September, most grew; some did not
D | Our own site: the Washinmura website (hotel and tourism industry)
www.washinmura.jp · The first field-test site of the IDAEO methodology
1 in every 8 reads is someone asking AI right now
AI real-time retrievals: 11,333, or 11.9% of the 95,333 reads by AI and search engines
S2–S4 AI Information Acquisition
95,333 reads
Reads by AI and search engines
8/20–10/8
S5 Ask
11,333 reads
AI real-time retrievals
ChatGPT 7,720, Claude 1,983,
Perplexity 1,630
S9 Visit
AI-referred bookings
Booking data to be published later
Google search clicks 109,140; search impressions 1,344,589
3/3–10/8
E | Second batch of field-test industries: joined July–August
373,776 AI impressions
IDA pages of the second batch of field-test industries · times read by AI, 7/18–10/8
Who reads
What they do
Meta
170,137
OpenAI
60,869
Anthropic
59,178
Amazon
37,218
Apple
36,744
Microsoft
9,407
Common Crawl
107
Google
102
Perplexity
11
ByteDance
3
Copies back for training
327,365 reads
Building AI and search indexes
46,399 reads
Real-Time Retrieval
12 reads
Real-time retrieval: AI reads these pages as someone asks.
Search clicks and customer visits for IDA pages: Tracking in Progress, to be published later.
Industry websites (April–September total)
Copilot citations
37,793 citations
Bing search clicks
10,177 clicks
AI citations, compared with search clicks:
3.7 times
IDAEO is field-tested at Washinmura, the first merchants, and a second wave of industries; wider public testing is next.
ID
EO
Merchant website figures are site-wide opens.
How to readRead from top to bottom. First, look at Google search clicks for IDAEO platform merchant pages, then the cumulative number of times AI brought customers into merchant pages, to see changes during the field-test period. Next, look at changes in the first batch of merchant websites after joining the IDAEO field test. Then look at search clicks, AI crawls, and bookings brought by AI for our own Washinmura website (hotel and tourism industry). Finally, look at AI impressions, the platforms that came to read, and their purposes for the IDA pages of the second batch of field-test industries. Read each figure according to the labeled subject, period, and purpose. The figures for the first batch of merchant websites are site-wide opens. There is no control group yet; these results do not establish causation.
Key Points of This Chapter
| Claim | Why |
|---|---|
| IDAEO is field-tested not only on the IDAEO site itself and Washinmura; early field-test merchants also contribute field data. | Platform merchant pages, merchant websites, and the second batch of field-test industries provide first-party data from different settings, so the actual results of the same theory can be compared across industries. Washinmura is the first field-test site for the IDAEO methodology. Our own Washinmura website (www.washinmura.jp, hotel and tourism industry) received 109,140 Google search clicks (Mar 3–Oct 8); of the 95,333 crawls by AI and search engines (Aug 20–Oct 8), 11,333 were real-time retrievals, with AI reading the site on the spot when someone asked it, about 1 in every 8 crawls (11.9%). Washinmura has already received bookings brought by AI; booking data will be published later. Because questions trigger AI to read the website, and AI has already brought bookings, these results map to the journey: S2–S4 AI crawling → S5 Ask → S9 Visit (bookings brought by AI). |
| The small and medium-sized businesses in the field test saw the following changes during their time on the IDAEO platform. | The platform connects merchant information to AI crawling, search, and customer visits. Google search clicks on merchant pages rose from 297 in March to 15,128 in September, up for seven consecutive months, with September at 5.4 times April. The first customer brought by an AI answer came on Apr 15, reaching 774 cumulative by Oct 8. AI impressions from May 19 to Oct 9 were about 50.67 million. These are changes during the field-test period. There is no control group yet; these results do not establish causation. Merchants can use First-Party Data to verify the results of each stage. |
| ① Measurement officially launched → Law of Full-Journey Outcomes (Performance Measurement); ② Search exposure rolled out in parallel → Law of Audience Adaptation (Audience Strategy); ③ First visitor arrived via an AI answer → Journey Design: S9 Visit. | Measurement gives the results of every stage a basis, and search exposure connects content to search audiences. When an AI answer brought a customer for the first time, upstream content use connected to an actual arrival in the journey. These records give the laws and the journey results that can be checked against each other. If new records do not align with what the laws predict, the laws must be revised. |
| ④ Brand knowledge presentation fully upgraded → Law of Identity Continuity (S1 Merchant Readiness); ⑤ Research-Evidence-Driven Optimization → Theoretical foundation: 17 existing theories; ⑥ New IDAEO site built → Five Dimensions and Nine Elements. | A consistent brand identity lets AI link new information back to the same entity. Research supports the design, and the new site implements each dimension and element, so later content use builds on the earlier foundation. The test is whether new information links back to the same identity. If it does not, this mapping does not hold. |
| ⑦ Crawl performance hit a new peak → AI Impressions (S2–S4 AI Information Acquisition); ⑧ Cumulative requests passed one hundred million → Compounding Lead and Living Theory. | The crawl peak shows the scale at which AI acquires information; continued content use leaves new data, making the next round of optimization more precise. A rising cumulative curve alone cannot prove a Compounding Lead. This remains a hypothesis to be tested; each month’s new field data also grows the theory. The cumulative curve in Figure 7-1 records this accumulation: 635,000 by end of March → 21.4 million by end of June → 99.15 million by end of September → 105.5 million cumulative by Oct 8 (including AI, search engines, and Automated Bots; these platform-site volumes cannot be compared directly with a single merchant's website). Figures before Aug 24 may include duplicate requests. The rule of thumb for a Warm Start is about 30 days; the industry rule of thumb for a Cold Start is about 90 days. A separate single-site observation found that the next crawler from the same AI platform arrived 30–35 days later. TK Lin’s personal IDA case reached S7 in 14 days. Warm Start content meets S1 and goes live on an AI Traffic Hub, where existing crawlers can read it. |
| Among the first batch of merchant websites that joined the field test and have complete records for both May and September, most grew and some did not. For the websites that grew, site-wide opens from May to September were as follows: a parenting content site rose from 52,817 to 55,286, a food-service equipment manufacturer from 842 to 1,275, an event staging design firm from 442 to 1,741, a leather goods brand from 555 to 908, a hair salon from 74 to 128, and a studio from 3 to 329. | Site-wide opens record the change in visits for each industry after joining the field test. With consistent subjects and periods, this First-Party Data is available for joint research and cross-industry comparison. The list above includes only websites that grew. Websites that did not grow also exist but are not listed. There is no control group yet; these results do not establish causation. |
| The IDA pages of the second batch of field-test industries received 373,776 AI impressions from Jul 18–Oct 8 (the number of times they were read by AI and search engine crawlers). | 10 platforms read the site; the top six were Meta 170,137, OpenAI 60,869, Anthropic 59,178, Amazon 37,218, Apple 36,744, and Microsoft 9,407. By purpose, “reads for training” led with 327,365, “reads for AI indexing and search indexing” totaled 46,399, and real-time retrievals totaled 12. The records show that the content of the second batch of field-test industries has been read by AI and search engines. Search clicks and customer arrivals: Tracking in Progress. Results will be published later. |
Terms
- Milestone
- A growth node marked by methodology implementation and its corresponding results.
- Research-evidence-driven optimization
- Combining relevant papers with methods proven effective in field tests to improve marketing results.
- Full-Methodology Site Build
- Integrating audience, journey, trust and verification, and performance measurement from the very start of building the site.
- Cumulative curve
- A curve showing the continuous accumulation of AI and search engine requests over time.
- Early field-test merchants
- The earliest batch of merchants and site owners who put measurement on their own websites and ran field tests together with IDAEO.
- Joint field test
- Collaborative research in which merchants, site owners, and IDAEO validate the methodology together using first-party data.
FAQ
Q: What main growth line do the eight milestones show?
A: Theory says what to look at. Field results provide outcomes to check against it. Measurement and search exposure map to Performance Measurement and Audience Strategy, and AI bringing customers maps to customer visits. The brand knowledge upgrade, research evidence, and the new site build map to identity consistency, theoretical grounding, and a complete framework. The crawl peak and continued accumulation map to AI Information Acquisition, Compounding Lead, and Living Theory. See Figure 7-1 for cumulative volume. The total includes AI, search engines, and Automated Bots. Figures before Aug 24 may include duplicate requests. Each month’s new data is used to test these relationships and strengthen the theoretical and empirical foundation.
Q: What does Research-Evidence-Driven Optimization mean?
A: IDAEO compiles relevant papers from the web and optimizes its own site with methods proven effective in field tests. Research provides the basis; field testing links optimization choices to real content-use results.
Q: What is distinctive about the new IDAEO site build?
A: The new site applies the full IDAEO methodology directly, bringing the Marketing Audiences and Optimization Domains from Figure 1-1, “Panorama of the Five Marketing Audiences,” into the plan. Information, trust, and results are linked from the moment the site is built, so later growth builds on the earlier results.
Q: What does “from Aug 24 on” on the curve mean?
A: From Aug 24 on, counting uses platform-verified AI identities, which identifies visitors more precisely. May 20–Aug 23 is the stage in which IDAEO methodology validation took shape. Figures before Aug 24 may include duplicate requests. September was lower than August; the August figures span Aug 24, when the counting method changed. When comparing monthly volumes across Aug 24, use periods on the same basis.
Q: How are changes in platform rankings used in marketing decisions?
A: Read crawl volume and ranking for the same period together to observe how contact with each platform changes. Ranking reflects relative position; crawl volume reflects actual contact. Reading both together gives a better grasp of audience distribution.
Q: What do the early field-test merchants’ data show?
A: The data show changes during the field-test period: search clicks on platform merchant pages keep rising, and AI answers bring customers to the site. Among the first batch of merchant websites, most grew and some did not. There is no control group yet; these results do not establish causation. Search clicks, AI bringing customers, and site-wide opens on merchant websites each measure a different kind of contact. Looking at them separately by subject and period makes the Marketing value of each result clear and provides a basis for joint research. The IDA pages of the second batch of field-test industries received 373,776 AI impressions from Jul 18 to Oct 8. They were read by 10 platforms including Meta, OpenAI, Anthropic, Amazon, Apple, and Microsoft, showing that the content of the second batch of field-test industries has already been acquired by AI. Search clicks and customer arrivals: Tracking in Progress. Results will be published later.
Q: Why recruit more merchants and website owners to field-test together?
A: To study how IDAEO can work better for merchants and website owners, and to keep deepening the theory, practice, methodology, and solutions. Because First-Party Data from more merchants and website owners shows actual results across different settings, joint field testing gives these advanced studies a more complete basis.
This Chapter in Three Sentences
- Our own site and early field-test merchants provide First-Party Data from different settings.
- Eight milestones pair each approach with reads over the same period. The counting methods differ before and from Aug 24.
- Among websites with complete records, most grew and some did not. There is no control group yet; these results do not establish causation.
Three Things You Can Do This Week
- Write down what you will track on your website and over what period before you start recording.
- Before comparing monthly totals, check how each month's figures were counted.
- Record changes in visits to your own website. Do not use someone else's growth curve to set your expectations.
Next ChapterThe next chapter explains IDAEO's theoretical basis and how it differs from AI Visibility tools on the market.
Self-CheckUsing the different settings of the IDAEO site itself, Washinmura, and the early field-test merchants, explain what joint field testing means. Using the milestones and monthly rankings, describe the path from zero to one hundred million requests. Then read Figure 7-3, “Early Field-Test Merchant Results,” and interpret the numbers, periods, and Marketing value for platform merchant pages, the websites of each industry, and the second batch of field-test industries. Explain what changed in each setting during the field-test period and why causation cannot yet be claimed.
Related questions
- Chapter 7 key pointsIDAEO Field Results: Our Own Site and Early Field-Test Merchants
- Figure 7-1IDAEO Growth Milestones: From Zero to One Hundred Million Requests
- Figure 7-2Monthly Ranking Shifts of AI Platforms
- FAQ 7-1What main growth line do the eight milestones show?
- FAQ 7-2What does Research-Evidence-Driven Optimization mean?